

Abstract
Inhomogeneously broadened, non-Lorentzian water resonances have been observed in small image voxels of breast tissue. The non-Lorentzian components of the water resonance are likely produced by bulk magnetic susceptibility shifts caused by dense, deoxygenated tumor blood vessels (the ‘BOLD’ effect), but can also be produced by other characteristics of local anatomy and physiology, including calcifications and interfaces between different types of tissue. Here, we tested the hypothesis that detection of non-Lorentzian components of the water resonance with high spectral and spatial resolution (HiSS) MR imaging allows classification of breast lesions without the need to inject contrast agent. Eighteen malignant lesions and nine benign lesions were imaged with HiSS MRI at 1.5T. A new algorithm was developed to detect non-Lorentzian (or off-peak) components of the water resonance. After a Lorentzian fit was subtracted from the data, the largest peak in the residual spectrum in each voxel was identified as the major off-peak component of the water resonance. The difference in frequency between these off-peak components and the main water peaks, and their amplitudes were measured in malignant lesions, benign lesions, and breast fibroglandular tissue. Off-peak component frequencies were significantly different between malignant and benign lesions (p<0.001). Receiver operating characteristic (ROC) analysis was used to assess the diagnostic performance of HiSS off-peak component analysis compared to dynamic contrast enhanced (DCE) MRI parameters. The areas under the ROC curves for ‘DCE rapid uptake fraction’, ‘DCE washout fraction’, ‘off-peak component amplitude’, and ‘off-peak component frequency’ were 0.75, 0.83, 0.50, and 0.86, respectively. These results suggest that water resonance lineshape analysis performs well in the classification of breast lesions without contrast injection and could improve diagnostic accuracy of clinical breast MR exams. In addition, this approach may provide an alternative to DCEMRI in women who are at risk for adverse reactions to contrast media.
Keywords: EPSI, breast cancer, water resonance lineshape, spectroscopic imaging, lesion classification
Introduction
The use of MRI for breast cancer screening is likely to increase significantly over the next few years. A recent study from the American Cancer Society recommends regular MRI screening for women who are at greater than 20% lifetime risk for breast cancer (1). Dynamic contrast-enhanced magnetic resonance imaging (DCEMRI) is used for screening (2–4) and staging (5; 6) of breast cancer, and for evaluating response to treatment(7–9). The sensitivity of DCEMRI, although variable, is consistently high (75%-100%), however reported specificity is lower (29%-90%) (10–13). The significant false positive rate of DCEMRI is due to the similar enhancement patterns of some benign lesions (e.g. fibroadenomas) and invasive cancers (14). In order to improve specificity and avoid or minimize the number of biopsies resulting from screening MRI, new imaging methods that can complement or substitute for DCEMRI are needed. It is likely that maximum improvements in specificity will result from implementation of a number of complementary techniques, one of which is proposed here.
Alternatives and/or complements to DCEMRI include diffusion-weighted imaging (15; 16), spectroscopy (17; 18), magnetization-transfer imaging (19; 20), and high spectral and spatial resolution (HiSS) imaging of the water and fat resonances (21; 22). HiSS MRI is a spectroscopic imaging technique that provides high contrast, high resolution water proton images with complete fat suppression. In addition, the ability of HiSS to image the details of the water (or fat) resonance makes it sensitive to microscopic magnetic susceptibility gradients caused by deoxyhemoglobin (the ‘BOLD’ effect), hemosiderin or other sources of increased iron content, micro-calcifications, boundaries between tissues, and other sources of local magnetic inhomogeneity. When local susceptibility gradients span multiple voxels, they broaden and shift the water resonance, producing diagnostically useful inherent image contrast (23–28). However, when large susceptibility gradients occur across very short distances within a voxel, only a portion of the water signal in a voxel is shifted. This gives rise to non-Lorentzian features in the water proton resonance, e.g. water resonance asymmetry (29) and partially resolved peaks, or ‘off-peak components’ (30). Here, we focus on these sub-voxelar effects, as they may reflect the spatial heterogeneity that is typical of cancers.
Previous work demonstrates that the different Fourier components (peak and off-peak components) of the water resonance in small voxels represent anatomically and/or functionally distinct environments. For example, in small voxels (on the order of 1mm3) different spectral components of the water resonance respond differently to the changes in oxygenation (26; 31), contrast agent injection (32), and physiologic stimulation (33; 34). Changes in oxygenation or contrast media injection often produce shoulders and/or partially resolved components of the water resonance (26; 31; 32). No significant shoulders or partially resolved components of the water resonance are detected in phantoms consisting of aqueous solutions (35; 36), demonstrating that these features are not artifacts due to eddy currents or shimming. These results suggest that when there is significant heterogeneity within each voxel, non-Lorentzian spectral features provide valuable information which is not available in conventional images. The different spectral components of the water resonance can be used to generate parametric images (29; 33; 35; 36) and may provide diagnostically useful information about local physiology (35).
Off-peak signals in water resonances may distinguish between benign and malignant breast lesions (30; 36). Although these features may have many causes, the major source of local magnetic susceptibility gradients is likely to be deoxygenated tumor blood vessels (37). This hypothesis is supported by a previous study at 4.7T, which showed that detailed lineshape analysis can detect tumor microvasculature without the use of contrast agents (29). Foxley et al. showed that in AT6.1 tumors inoculated in the hind legs of rats, the water line in small voxels was significantly more asymmetric at the tumor rim compared to the tumor center and normal muscle, and that these areas correlated with areas of dense vasculature, as measured using a blood pool contrast agent (iron-oxide particles). Deoxygenated blood may be a useful diagnostic marker for cancers, reflecting the imbalance between oxygen delivery and oxygen metabolism (38), vascular hyperpermeability due to abnormal endothelial basement membranes (39), or extravasation of red blood cells into the interstitial space (40). Studies of breast lesions using diffuse optical spectroscopy have shown that while lesions have higher hemoglobin concentrations than normal breast tissue, malignant lesions are lower in oxygen saturation than benign lesions (41).
Here, we apply a new method to detect and characterize off-peak, non-Lorentzian components of the water resonance that may be indicative of dense, deoxygenated blood vessels. Non-Lorentzian spectral features are compared in malignant and benign breast lesions in addition to breast fibroglandular tissue, to determine whether these features could be used as a diagnostic marker. In previous work, the non-Lorentzian features were examined by generating Fourier component images, and analyzing their morphological features. (35; 36) Here, the entire water resonance spectrum is characterized by a fit to a Lorentzian function, and the residuals (the difference between the best-fit Lorentzian function and the raw data) are analyzed. Other aspects of the water resonance lineshape such as water peak height and water resonance linewidth are also evaluated for use as diagnostic markers. The performance of water resonance lineshape metrics as diagnostic markers for malignancy is evaluated using receiver operating characteristic (ROC) analysis.
Methods
Patient Population
This study was Health Insurance Portability and Accountability Actcompliant and Institutional Review Board approved, with all subjects providing written informed consent. Magnetic resonance imaging was performed on a 1.5T Philips Achieva (Philips Healthcare, Best, The Netherlands) whole-body scanner. Data were acquired from 2 groups of women: those presenting for staging MRI following a positive biopsy for cancer (n=22, median number of days elapsed after biopsy=21, mode number of days elapsed after biopsy=21, hereafter referred to as ‘staging’ patients) and those presenting for a high-risk screening MRI due to a personal or strong family history of cancer (n=4, hereafter referred to as ‘high-risk’ patients). Lesions that were visible on mammography or prior MRIs were selected for this study, since all HiSS data was acquired pre-contrast and the prior imaging data was necessary to help position the HiSS acquisition (see ‘Data Collection’ below). Eighteen malignant lesions were imaged in 18 women and nine benign lesions were imaged in eight women; see Table 1 for a summary of patient and tumor characteristics. Four of the benign lesions were found in patients presenting for staging MRIs due to a biopsy-confirmed cancer elsewhere in the breast. Three of these four benign lesions were diagnosed by radiologists as benign due to their morphology, including dark internal septations which are characteristic of fibroadenomas; the one final fibroadenoma was biopsy-confirmed. The remaining five benign lesions were found in the four high-risk screening patients (one of these patients had two separate lesions). Of these lesions, one was diagnosed by radiologists as a probable fat necrosis, three were diagnostic on imaging as fibroadenomas, and one was a biopsy-confirmed fibroadenoma.
Table 1.
Patient and tumor characteristics. IDC indicates invasive ductal carcinoma. DCIS indicates ductal carcinoma in situ.
| Characteristic | No. of Patients (%) |
|---|---|
| No. of patients | 26 |
| ‘Staging’ patients | 22 (85) |
| ‘High-risk’ patients | 4 (15) |
| No. of lesions | 27 |
| Malignant lesions | 18 (67) |
| Mean age [range], y | 53.7 [41–70] |
| Mean tumor size (A-P x S-I), cm | 2.5 × 2.4 |
| Tumor type and grade | |
| IDC w/DCIS | 7 (39) |
| IDC | 8 (44) |
| Invasive mucinous cancer | 1 (5.6) |
| Adenoid cystic carcinoma | 1 (5.6) |
| Invasive lobular carcinoma | 1 (5.6) |
| Benign lesions | 9 (33) |
| Mean age [range], y | 49.9 [37–64] |
| Mean tumor size (A-P x S-I), cm | 1.1 × 0.8 |
| Tumor type | |
| Fibroadenoma | 8 (89) |
| Fat necrosis | 1 (11) |
Data Collection
Pre-contrast HiSS imaging was integrated into standard clinical breast exams. Either a seven- or a sixteen-channel phased-array Philips/Invivo dedicated breast coil was used for RF detection; RF transmission was performed with the body coil. The imaging protocol included 1) an axial T2-weighted turbo spin-echo sequence (1×1×2mm3 voxels, TR/TE=11.3s/120ms, echo train length=30); 2) a sagittal single-slice HiSS acquisition, obtained pre-contrast with parameters given below; and 3) an axial DCEMRI sequence, obtained with parameters given below. The T2-weighted sequence was used, in addition to either standard x-ray mammographic views (‘staging’ patients, n=22) or previously acquired MR images (‘high-risk’ patients, n=4), to aid an experienced observer in localizing the breast lesion and positioning the sagittal HiSS slice. Apart from addition of HiSS imaging, the standard clinical protocol was followed.
HiSS Data Collection & Analysis
HiSS data were acquired using a modified echo-planar spectroscopic imaging (EPSI) technique (42), which employs an alternating readout gradient to encode the time domain data. Each point in k-space is thus sampled as a function of time during the free induction decay in each voxel. Fourier transformation of the free induction decay produces a proton spectrum in each voxel, consisting primarily of fat and water peaks. Single-slice, sagittal HiSS acquisitions were performed using in-plane resolution of 1mm over a 512×256 mm2field-of-view, slice thickness of 2mm, TR=500 ms, flip angle=90°, spectral bandwidth/resolution=716.8 Hz/5.6 Hz, and echo train duration=179.2ms. The readout gradient was applied in the anterior/posterior direction to minimize artifacts due to respiratory and/or cardiac motion. Shimming was performed using the standard Philips protocol, which consists of a first-order shim over the field-of-view.
The HiSS data acquisition was tested by imaging a phantom containing an 8 mM copper sulfate solution with the EPSI pulse sequence using identical parameters as those used in breast imaging. This allowed us to evaluate whether artifacts, e.g. due to eddy currents or shim gradients, could produce non-Lorentzian lineshapes. The water resonance in all image voxels was a symmetric Lorentzian with linewidth of less than 7 Hz, indicating that no artifacts due to poor shimming or eddy currents were present. This is consistent with previous results obtained in this laboratory (35; 36).
Raw HiSS data were exported from the scanner for off-line post-processing. Post-processing of the HiSS data was performed using IDL (ITT, Boulder, CO) and included 3-D Fourier transformation of the raw k-space data, correction for spectral ghost peaks (44), optimization of the true water peak frequency (28), labeling of water and fat peaks (45), and non-linear least squares fitting of the modulus spectrum to the modulus of the Lorentzian function in each voxel. Modulus rather than phased spectra were used to avoid errors due to incorrect phasing. The fat peak and spectral baseline were parameterized by a modulus Lorentzian (referred to as ‘Lorentzian’ for convenience) and then subtracted from the full spectrum, leaving the pure water resonance, or ‘water-only’ spectrum. The height of the peak of the ‘water-only’ spectrum in each voxel was used to generate ‘HiSS water peak height’ images. Many different types of images can be produced from HiSS data, e.g., water or fat peak height, peak width, peak asymmetry, etc., images, but water peak height images were used in the current research to assess lesions. Due to the high spatial resolution, the signal-to-noise ratio (SNR) of HiSS spectra is too low for detection of metabolite peaks and can only be modeled using a fat and water resonance.
The water-only spectrum was further post-processed to reveal non-Lorentzian, or off-peak, components. Noisy spectra were eliminated from the analysis using a noise threshold which eliminated voxels with water peak height signal-to-noise ratio less than 6:1. A verification procedure was performed to rule out the possibility that the algorithm may have been detecting noisy water peaks, and therefore off-peak components consisting of primarily noise. The spectra from the voxels that were selected based on the noise threshold mentioned above were visually inspected in a separate database of patients (n=10). This was done by generating a binary image (or map) of the voxels selected using the combination of thresholds described above and visually confirming in the spectral domain that these voxels did indeed contain water peaks above the noise level.
The water resonance in each voxel was parameterized by a Lorentzian curve that was subtracted from the water-only spectrum. The residual, or ‘difference’, spectrum was normalized by the root-mean-square spectral noise level in each voxel. Thus off-peak component amplitudes are reported in units of signal-to-noise ratio (SNR). Figures 1a–1c show examples of water-only spectra (solid lines) with overlaid Lorentzian curves (dashed lines) and difference spectra (dotted lines) obtained from individual voxels with this method. The difference spectra were evaluated in a ±6 spectral bin range (±33.6 Hz) about the main water peak (excluding the main water peak) and the maximum in this range (corresponding to the largest deviation from a Lorentzian lineshape) was recorded as the ‘amplitude’ of the detected off-peak component. The frequency offset of the ‘off-peak-component’ was also recorded – this is the difference in Hertz between the peak amplitude of the primary water resonance and the peak amplitude of the ‘off-peak component’ in the difference spectrum. Images mapping the amplitude and frequency of the off-peak components were analyzed for each patient. All regions-of-interest (ROIs) were traced by a reader blinded to the off-peak component images. The ROIs were traced on HiSS water peak height images, using DCEMRI subtraction images as additional reference. Fibroglandular tissue ROIs were traced on water peak height images; a total of 14 fibroglandular tissue ROIs were evaluated (seven from the malignant cases and seven from the benign cases). The other eleven malignant patients and one benign patient had very little fibroglandular tissue in their breasts as evidenced on the water peak height images.
Figure 1.

Panels a–c show examples of water-only spectra (solid lines) with overlaid Lorentzian curves (dashed lines) and difference spectra (dotted gray lines), with partially resolved off-peak components indicated by an arrow. SNR, signal-to-noise ratio.
DCEMRI Data Collection & Analysis
DCEMRI was performed after HiSS imaging using a 3D T1-weighted, fat-suppressed fast gradient echo sequence (the standard clinical protocol). The first post-contrast image series was acquired beginning at 10 seconds after intravenous injection of gadodiamide (Omniscan; GE Healthcare, Oslo, Norway). The gadodiamide was injected intravenously at a dose of 0.1 mmol per kilogram of body weight and at a rate of 2.0 mL/sec and was followed by a 20-mL saline flush administered at the same rate. Three post-contrast image series were acquired (at minutes 1, 2, and 6 post-contrast injection) in the axial plane with an in-plane resolution of 0.94mm, slice thickness of 2mm (TR/TE=7.9 ms/3.9 ms, flip angle=10 degrees, temporal resolution=55–60 seconds).
Signal intensity versus time – or ‘kinetic’ – curves for each lesion were generated using a commercially available computer aided visualization and analysis (CAVA) system (CADstream research version 5.0 (Confirma, Inc., Kirkland, WA)). CADstream software is routinely employed in our clinic to aid in interpretation of DCEMRI results; however, radiologists ultimately decide whether a lesion appears malignant or benign based on the patient’s entire health record, including results from x-ray mammography, ultrasound, and MR imaging, in addition to clinical evaluation. Two independent DCEMRI kinetic parameters, ’rapid uptake fraction’ and ‘washout fraction’ were analyzed on the same sagittal slice as the HiSS acquisition using the CAVA system. ‘Rapid uptake’ and ‘washout’ are qualitative breast imaging reporting and data system (BI-RADS®) lexicon kinetic descriptors that are found in higher proportion in malignant lesions than benign lesions (43). The ‘rapid uptake’ threshold and ‘washout’ thresholds are set by the user in CADstream. The ‘rapid uptake’ threshold was defined as 100% immediate enhancement after contrast injection, and the ‘washout’ threshold was defined as 10% decrease in signal of the delayed series compared to the immediate contrast-enhanced series. These thresholds are routinely used in the clinic - no special thresholds were used for this study.
Statistical analysis
Statistical analyses were performed using IDL software. Mean off-peak component amplitudes and frequencies along with their respective standard errors were calculated. We chose to use non-parametric statistical tests to account for the non-normality of the data due to the limited sample sizes. The Mann-Whitney U test was used for comparisons of off-peak components (frequencies and amplitudes) in malignant and benign lesion ROIs.
ROC analysis was performed to evaluate the diagnostic performance of ROI measurements of off-peak component frequency and amplitude and DCEMRI rapid uptake and washout fractions in the task of classifying invasive versus benign lesions, using pathology as the gold standard. Detailed review of pathological reports and MR images acquired pre and post MR-guided biopsy were used to ensure that the lesions presented here were those that were actually biopsied. ROCKIT software (ROCKIT 0.9B Beta version, Charles E. Metz, University of Chicago) was used to generate and analyze ROC curves. Area under the curve (AUC) for all ROC curves is reported. The AUCs obtained using the off-peak component frequency and DCEMRI washout fraction classifiers were compared to the maximum AUC obtained with their linear combination, using a one-tailed z-score based test in ROCKIT.
Results
HiSS Data Analysis
Typical HiSS water peak height images of breast lesions are shown in Figure 2. Water peak height images of invasive lesions are shown in Figures 2a and 2b, and benign fibroadenomas are shown in Figures 2c and 2d. Both malignant and benign lesions have increased water peak height signal relative to fibroglandular tissue and thus are clearly visualized. Water peak height images were used to manually define ROIs over malignant lesions, benign lesions, and normal fibroglandular tissue. ROI measurements are summarized in Table 2. The mean ± S.E. of the water peak height (expressed as units of SNR) was 44.8 ± 5.0, 40.3 ± 6.9, and 25.0 ± 2.4 in malignant lesions, benign lesions, and fibroglandular tissue ROIs. The mean ± S.E. of the water linewidth in malignant lesions, benign lesions, and fibroglandular tissue was 17.0 ± 1.0 Hz, 18.1 ± 0.5 Hz, and 21.3 ± 1.2 Hz, respectively. Mann-Whitney U tests did not demonstrate significant differences between malignant and benign water peak heights (p > 0.05) or water linewidths (p > 0.05).
Figure 2.

Water peak height images of breast lesions shown with the manually drawn regions of interest (ROIs) (red), acquired prior to contrast injection. (a) Invasive ductal carcinoma grade II; (b) invasive ductal carcinoma grade II; (c) fibroadenoma; (d) fibroadenoma.
Table 2.
ROI measurements of the water resonance. Mean ± S.E. and median values are reported.
| Malignant lesions [Mean±S.E, Median] | Benign lesions [Mean±S.E, Median] | Fibroglandular Tissue [Mean±S.E, Median] | |
|---|---|---|---|
| Water peak height (SNR) | [44.8 ±5.0, 37.6] | [40.4 ±6.90, 33.5] | [25.1±2.42, 24.3] |
| Water linewidth (Hz) | [17.1±1.0, 18.2] | [18.1±0.5, 17.7] | [21.2 ±1.25, 22.0] |
| Off-peak component amplitude (SNR) | [4.40 ± 0.18, 4.05] | [4.30 ± 0.33, 4.08] | [3.68 ± 0.09, 3.62] |
| Off-peak component frequency (Hz) | [11.3 ±1.41, 13.19]* | [1.26 ±2.58, 3.21]* | [0.81±1.62, 1.13] |
p<0.01
Figure 3 shows water peak height images (a) and the off-peak component images (b and c) overlaid onto HiSS water peak height images for a malignant (top) and a benign lesion (bottom). The off-peak component images were ‘filtered’ to display the off-peak components in areas with large water peak heights. In this example, a signal-to-noise threshold of 27:1 for water resonance peak heights was used. Off-peak component amplitude images (Fig. 3b) show similar pixel values in malignant lesions and benign lesions. This is also reflected in the ROI measurements of the off-peak component amplitudes (expressed as units of SNR); the mean ± S.E. of the amplitudes was 4.40 ± 0.18, 4.30 ± 0.33, and 3.68 ± 0.09 in malignant lesions, benign lesions, and fibroglandular tissue, respectively (Table 2). The Mann-Whitney U test did not demonstrate a significant difference between malignant and benign off-peak component amplitudes (p > 0.05).
Figure 3.
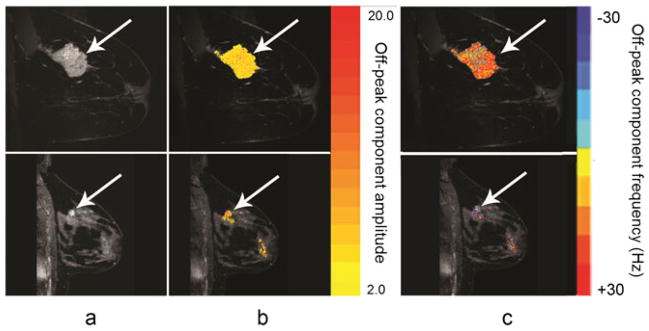
Images of lesions generated in this study from a sagittal high spectral and spatial resolution (HiSS) acquisition acquired without contrast. Top: images from a woman presenting with invasive ductal carcinoma grade III; bottom: images from a woman presenting with fibroadenoma. (a) HiSS water peak height images; (b) off-peak component amplitude images overlaid onto water peak height images with color bar; (c) off-peak component frequency images overlaid onto water peak height images with color bar. A water peak height signal-to-noise threshold of 27 : 1 was used to filter the off-peak component images.
Images of the off-peak component frequency (Fig. 3c) show that the detected off-peak components tend to occur at higher resonance frequencies (relative to the primary water peak) in malignant lesions compared to benign lesions. A boxplot of the mean off-peak component frequencies averaged over each ROI is shown in Figure 4. All statistics reported here include outlying data; these are values that are 1.5 times the inter-quartile range away from either quartile and are indicated with an open circle. The average frequency offset was positive in 15 of 16 malignant lesions; the mucinous cancer was found to have a negative average frequency offset. Three of the nine benign lesions had negative average off-peak component frequencies. The fibroglandular tissue ROIs showed smaller and more often negative frequency shifts than malignant lesions. The means ± S.E. of the off-peak component frequencies in malignant lesions, benign lesions, and fibroglandular tissue were 11.3 ± 1.41 Hz, 1.26 ± 2.6 Hz, and 0.80 ± 1.62 Hz, respectively (Table 2). Visual inspection of Figure 4 reveals that the data are not normally distributed, and thus medians of the off-peak component frequencies are reported. The medians were 13.2 Hz, 3.21 Hz, and 1.13 Hz in the malignant lesions, benign lesions, and fibroglandular tissue, respectively. The Mann-Whitney U test showed a statistically significant difference in off-peak component frequencies of malignant and benign lesions (p <0.01).
Figure 4.

Boxplot of mean off-peak component frequencies in malignant lesions, benign lesions and fibroglandular tissue regions of interest (ROIs). Outliers (open circles) are defined as those that lie a distance of greater than 1.5 times the interquartile range from either quartile.
DCEMRI
For comparison, the ROC performance of the DCEMRI data was also evaluated. All of the eighteen malignant lesions enhanced above the CADstream threshold of 50% initial enhancement. The means ± standard errors (S.E.) of the rapid uptake fractions for these lesions were 0.46 ± 0.10 and washout fractions were 0.29 ± 0.07. Six of the nine benign fibroadenomas did not enhance above the CADstream threshold of 50% enhancement over the initial signal; thus, the rapid uptake and washout fractions for these lesions were zero. The means ± S.E. of the rapid uptake fractions for all benign lesions were 0.23 ± 0.13 and washout fractions were 0.01 ± 0.01. Conventional binormal ROC curves were fitted for the rapid uptake and washout fractions (shown in Figure 5) and the corresponding AUC ± estimated S.E. were 0.75 ± 0.13 and 0.83 ± 0.16, respectively. The 95% confidence interval for the DCE rapid fraction AUC was [0.46, 0.93] and for the DCE washout fraction was [0.38, 0.99].
Figure 5.

Conventional binormal receiver operating characteristic (ROC) curves obtained from ROCKIT software for dynamic contrast-enhanced MRI (DCE MRI) metrics.
Figure 6 illustrates the conventional binormal fit to the ROC curve that was used to evaluate the diagnostic performance of the mean off-peak component frequency in distinguishing malignant from benign lesions. The AUC ± estimated standard error for off-peak component frequency was 0.86 ± 0.07. The asymmetric 95% confidence interval for AUC was [0.69, 0.95]. Based on the statistical analysis provided in the ROCKIT software, analysis of the off-peak component resonance frequency could provide 80% sensitivity (95% asymmetric confidence interval of (57%, 94%)) with 76% specificity for differentiating benign from malignant lesions. The specificity obtained at 100% sensitivity was 11%, and the sensitivity obtained at 100% specificity was 67%. ROC analysis of the mean off-peak component amplitude yielded an AUC of 0.50 ± 0.12.
Figure 6.

Conventional binormal receiver operating characteristic (ROC) curve obtained from ROCKIT software for off-peak component frequency plotted with empirical operating points.
A linear combination of the HiSS-derived classifier (off peak component frequency) and a DCEMRI-derived classifier (DCE washout fraction) achieved the maximum AUC of 0.93 (95% asymmetric CI: [0.78, 0.99]). This value was significantly higher than the AUC obtained using HiSS data alone (p = 0.04). The improvement over the AUC obtained using the DCEMRI washout fraction was larger, although the difference did not reach statistical significance (p = 0.26).
Discussion
In general, benign lesions showed a small mean washout fraction, a trend which has been observed in other studies (46), and a small or negative frequency offset of off-peak water resonance components. Conversely, malignant lesions exhibited a larger mean washout fraction and were associated with a large, positive frequency offset of off peak water resonance components. Three of the fibroadenomas included in this study exhibited rapid uptake kinetics. Lesions of this type are difficult to separate from malignant lesions based on DCEMRI data alone. These three fibroadenomas had off-peak component frequencies of −5.14, 0.58, and 3.21 Hz, and would likely be classified as benign based on water resonance lineshape analysis using HiSS imaging. Therefore, a combination of HiSS and DCEMRI may improve specificity of breast MRI by eliminating or reducing the number of false positives. For example, in this work, the combination of HiSS and DCEMRI classifiers achieved an AUC of 0.93 – significantly better than HiSS alone, which in turn obtained a higher AUC than either of the DCEMRI classifiers. The large confidence interval of the DCEMRI AUC values precluded statistical significance in the comparison of theAUC performance of the combination of HiSS and DCEMRI to DCEMRI washout fraction, which this is likely due to our limited database. Still, overall, the increase in AUC from 0.83 to 0.93 upon inclusion of HiSS analysis is a very encouraging result.
Images produced from analysis of water resonance lineshape may provide some advantages relative to DCEMRI. Since high temporal resolution is not required for HiSS EPSI acquisitions, data can be acquired with relatively high spatial resolution and SNR. HiSS may be sensitive to tumor metabolism – since deoxygemoglobin levels depend both on the balance between blood flow and oxygen consumption - as well as tumor blood vessel density. And finally, the ability to classify malignant breast lesions without contrast agent administration is desirable for the population of patients that are at risk for adverse effects (47).
The work presented here sought to test whether non-Lorentzian (off-peak) components could be used to classify as opposed to identify breast lesions. We did observe significant non-Lorentzian components outside of the breast lesions within breast fibroglandular tissue, which indicates that these areas could be considered as ‘false-positives’ for a breast lesion detection task. However, the mean frequency offset of fibroglandular tissue off-peak components was significantly smaller than the mean frequency offset of off-peak components in malignant lesions. Therefore this analysis shows promise as a breast lesion detection technique; this remains to be investigated.
The inhomogeneously broadened spectra observed in malignant lesions may be due to the ‘BOLD’ effect, i.e. due to high concentrations of deoxyhemoglobin. Due to its paramagnetism, deoxyhemoglobin could produce resonance frequency shifts in the water signal originating in and near a network of blood vessels. Alternatively, shifts could be due to increased iron in tumor cells or hemosiderin. The positive frequency shift for non-Lorentzian components of the water resonance in malignant lesions suggests increased bulk susceptibility in one portion of a voxel due to relatively high concentrations of paramagnetic substances. However, the frequency shift in and around a single blood vessel or some other structure with increased magnetic susceptibility is dependent on geometry and orientation (48). These effects are very difficult to model, especially in the case of deoxyhemoglobin in blood vessels with complicated geometry. While quantifying this effect analytically is likely impossible, numerical simulations of blood vessel networks or heterogeneous distributions of other paramagnetic molecules could be used to examine this effect in future work.
Increased diamagnetism should also be considered as a source of non-Lorentzian lineshapes, e.g. changes in the composition of membrane lipids or structural proteins, but these are expected to have modest effects on the local magnetic field. In addition, exchange between relatively free and relatively bound pools of water can shift the water resonance and can, in principle (50), produce a non-Lorentzian spectral feature. A more focused study of an animal model will be required to directly probe the mechanisms responsible for the water proton spectra observed in tumors.
The observed shoulders and partially resolved components of the water resonance could in principle be caused by shim gradients and/or eddy currents. However, the experimental evidence suggests that this is not the case. Very large, non-linear shim gradients across a single voxel would be required to produce non-Lorentzian spectra. HiSS imaging of phantoms using EPSI produces relatively narrow and symmetrical water resonances (35; 36) with high reproducibility of detailed water spectra (35). Furthermore, previous work (26; 31; 32) demonstrates that carbogen and contrast agents have spectrally inhomogeneous effects on the water resonance in small voxels; this suggests that the different spectral components detected by HiSS represent anatomically and/or physiologically distinct subvoxelar compartments.
There were several technical limitations to this study. Due to time constraints, single-slice HiSS images were obtained, and lesions may not have been optimally sampled. In the future, more rapid data acquisition methods, including parallel imaging (45) will be used, so that a large volume of tissue can be imaged. This would also facilitate histogram analysis, rather than ROI - based analysis, which could increase diagnostic accuracy. Additionally, improvements to water resonance phasing algorithms could increase sensitivity to small local magnetic susceptibility gradients. Further, the small number of patients contributed to wide confidence intervals – a much larger study is needed to verify the present results, and provide information concerning cancer subtypes – e.g. DCIS and high risk lesions vs. invasive cancer. Repetition of this study at higher field strength could improve classification of breast lesions, due to improvements in signal-to-noise ratio and larger separation of off-peak components from the bulk of the water signal. Finally, in this work, all of the malignant lesions had been biopsied, while the majority of the benign lesions were not. Due to the nature of the MRI referral process in the current medical practice, this is a limitation that most studies comparing MR images of benign and malignant breast lesions will encounter. However, the voxels showing off-peak components in this study were distributed throughout the lesion, which would not be the case if they originated from the biopsy scar. In addition, the characteristics of the off-peak components in the biopsied benign lesions did not differ significantly from those in non-biopsied benign lesions. This gives us confidence that the observed results are the product of lesion physiology, not of the biopsy procedure, and that they could be reproduced in non-biopsied lesions. It should also be noted that in our study, the biopsies of the benign lesions were performed months prior to the MRI exam while the median time from biopsy to MRI in the malignant lesion population was 21 days.
Despite the limitations of the work presented here, these results suggest that HiSS water resonance lineshape analysis could be a useful diagnostic technique for breast MRI. This technique may also provide an alternative to contrast enhanced MRI for patients who are at risk for adverse reactions to contrast media. These adverse reactions may become increasingly important as larger numbers of patients are referred for repeated MRI scans over many years.
In conclusion, results from this pilot study indicate that analysis of the water resonance lineshape of HiSS data provides novel information that could aid in classification of breast lesions at 1.5-T without the use of contrast agents. This is likely due to the sensitivity of HiSS MRI to regions of dense tumor vasculature with deoxygenated hemoglobin, or other sources of paramagnetism in malignant tumors. The results presented here must be validated in a larger patient cohort at higher field strengths. It remains to be determined whether HiSS lineshape analysis could be used to improve specificity of breast cancer MR imaging or possibly substitute for DCEMRI in cases where contrast media injection is contra-indicated.
Acknowledgments
This work was supported in part by the Segal Family Foundation, PA-08-190: Research Supplements to Promote Diversity in Health-Related Research, a supplement for NIH P50 CA125183-01: SPORE in Breast Cancer (PI: O.I. Olopade), the National Institute of Biomedical Imaging and Bioengineering (grant R01 EB003108-01), and the National Cancer Institute (grant R01 CA078803-04A2). We are grateful to Dr. Charles Metz for his advice and insight. We would like to thank our collaborators at Philips Healthcare for their continued support.
Abbreviations
- DCEMRI
Dynamic contrast enhanced MRI
- HiSS
High spectral and spatial resolution
- ROC
Receiver operating characteristic
- IDC
invasive ductal carcinoma
- EPSI
echo planar spectroscopic imaging
- CAVA
computer aided visualization and analysis
- SNR
Signal-to-noise ratio
- ROI
Region of interest
- AUC
Area under the curve
References
- 1.Saslow D, Boetes C, Burke W, Harms S, Leach MO, Lehman CD, Morris E, Pisano E, Schnall M, Sener S, Smith RA, Warner E, Yaffe M, Andrews KS, Russell CA. American Cancer Society guidelines for breast screening with MRI as an adjunct to mammography. CA Cancer J Clin. 2007 Apr;57(2):75–89. doi: 10.3322/canjclin.57.2.75. [DOI] [PubMed] [Google Scholar]
- 2.Kuhl CK, Schrading S, Leutner CC, Morakkabati-Spitz N, Wardelmann E, Fimmers R, Kuhn W, Schild HH. Mammography, breast ultrasound, and magnetic resonance imaging for surveillance of women at high familial risk for breast cancer. J Clin Oncol. 2005 Nov;23(33):8469–8476. doi: 10.1200/JCO.2004.00.4960. [DOI] [PubMed] [Google Scholar]
- 3.Leach MO, Boggis CRM, Dixon AK, Easton DF, Eeles RA, Evans DGR, Gilbert FJ, Griebsch I, Hoff RJC, Kessar P, Lakhani SR, Moss SM, Nerurkar A, Padhani AR, Pointon LJ, Thompson D, Warren RML. Screening with magnetic resonance imaging and mammography of a UK population at high familial risk of breast cancer: a prospective multicentre cohort study (MARIBS) Lancet. 2005 May;365(9473):1769–1778. doi: 10.1016/S0140-6736(05)66481-1. [DOI] [PubMed] [Google Scholar]
- 4.Lehman CD, Blume JD, Weatherall P, Thickman D, Hylton N, Warner E, Pisano E, Schnitt SJ, Gatsonis C, Schnall M, DeAngelis GA, Stomper P, Rosen EL, O’Loughlin M, Harms S, Bluemke DA. Screening women at high risk for breast cancer with mammography and magnetic resonance imaging. Cancer. 2005 May;103(9):1898–1905. doi: 10.1002/cncr.20971. [DOI] [PubMed] [Google Scholar]
- 5.Esserman L, Hylton N, Yassa L, Barclay J, Frankel S, Sickles E. Utility of magnetic resonance imaging in the management of breast cancer: evidence for improved preoperative staging. J Clin Oncol. 1999 Jan;17(1):110–119. doi: 10.1200/JCO.1999.17.1.110. [DOI] [PubMed] [Google Scholar]
- 6.Fischer U, Kopka L, Grabbe E. Breast carcinoma: effect of preoperative contrast-enhanced MR imaging on the therapeutic approach. Radiology. 1999 Dec;213(3):881–888. doi: 10.1148/radiology.213.3.r99dc01881. [DOI] [PubMed] [Google Scholar]
- 7.Martincich L, Montemurro F, De Rosa G, Marra V, Ponzone R, Cirillo S, Gatti M, Biglia N, Sarotto I, Sismondi P, Regge D, Aglietta M. Monitoring response to primary chemotherapy in breast cancer using dynamic contrast-enhanced magnetic resonance imaging. Breast Cancer Res Treat. 2004 Jan;83(1):67–76. doi: 10.1023/B:BREA.0000010700.11092.f4. [DOI] [PubMed] [Google Scholar]
- 8.Pickles MD, Lowry M, Manton DJ, Gibbs P, Turnbull LW. Role of dynamic contrast enhanced MRI in monitoring early response of locally advanced breast cancer to neoadjuvant chemotherapy. Breast Cancer Res Treat. 2005 May;91(1):1–10. doi: 10.1007/s10549-004-5819-2. [DOI] [PubMed] [Google Scholar]
- 9.Loo CE, Teertstra HJ, Rodenhuis S, van de Vijver MJ, Hannemann J, Muller SH, Peeters M-JV, Gilhuijs KGA. Dynamic contrast-enhanced MRI for prediction of breast cancer response to neoadjuvant chemotherapy: initial results. AJR Am J Roentgenol. 2008 Nov;191(5):1331–1338. doi: 10.2214/AJR.07.3567. [DOI] [PubMed] [Google Scholar]
- 10.Kuhl CK, Mielcareck P, Klaschik S, Leutner C, Wardelmann E, Gieseke J, Schild HH. Dynamic breast MR imaging: are signal intensity time course data useful for differential diagnosis of enhancing lesions? Radiology. 1999 Apr;211(1):101–110. doi: 10.1148/radiology.211.1.r99ap38101. [DOI] [PubMed] [Google Scholar]
- 11.Huang W, Fisher PR, Dulaimy K, Tudorica LA, O’Hea B, Button TM. Detection of breast malignancy: diagnostic MR protocol for improved specificity. Radiology. 2004 Aug;232(2):585–591. doi: 10.1148/radiol.2322030547. [DOI] [PubMed] [Google Scholar]
- 12.Bluemke DA, Gatsonis CA, Chen MH, DeAngelis GA, DeBruhl N, Harms S, Heywang-Köbrunner SH, Hylton N, Kuhl CK, Lehman C, Pisano ED, Causer P, Schnitt SJ, Smazal SF, Stelling CB, Weatherall PT, Schnall MD. Magnetic resonance imaging of the breast prior to biopsy. JAMA. 2004 Dec;292(22):2735–2742. doi: 10.1001/jama.292.22.2735. [DOI] [PubMed] [Google Scholar]
- 13.Kuhl CK, Schild HH, Morakkabati N. Dynamic bilateral contrast-enhanced MR imaging of the breast: trade-off between spatial and temporal resolution. Radiology. 2005 Sep;236(3):789–800. doi: 10.1148/radiol.2363040811. [DOI] [PubMed] [Google Scholar]
- 14.Brinck U, Fischer U, Korabiowska M, Jutrowski M, Schauer A, Grabbe E. The variability of fibroadenoma in contrast-enhanced dynamic MR mammography. AJR Am J Roentgenol. 1997 May;168(5):1331–1334. doi: 10.2214/ajr.168.5.9129437. [DOI] [PubMed] [Google Scholar]
- 15.Ei Khouli RH, Jacobs MA, Mezban SD, Huang P, Kamel IR, Macura KJ, Bluemke DA. Diffusion-weighted imaging improves the diagnostic accuracy of conventional 3 -T breast MR imaging Radiology. 2010 Jul;256(1):64–73. doi: 10.1148/radiol.10091367. [DOI] [PMC free article] [PubMed] [Google Scholar]
- 16.Partridge SC, Demartini WB, Kurland BF, Eby PR, White SW, Lehman CD. Differential diagnosis of mammographically and clinically occult breast lesions on diffusion-weighted MRI. J Magn Reson Imaging. 2010 Mar;31(3):562–570. doi: 10.1002/jmri.22078. [DOI] [PubMed] [Google Scholar]
- 17.Hu J, Yu Y, Kou Z, Huang W, Jiang Q, Xuan Y, Li T, Sehgal V, Blake C, Haacke EM, Soulen RL. A high spatial resolution 1H magnetic resonance spectroscopic imaging technique for breast cancer with a short echo time. Magn Reson Imaging. 2008 Apr;26(3):360–366. doi: 10.1016/j.mri.2007.07.004. [DOI] [PMC free article] [PubMed] [Google Scholar]
- 18.Hu J, Feng W, Hua J, Jiang Q, Xuan Y, Li T, Haacke EM. A high spatial resolution in vivo 1H magnetic resonance spectroscopic imaging technique for the human breast at 3 T. Med Phys. 2009 Nov;36(11):4870–4877. doi: 10.1118/1.3213087. [DOI] [PMC free article] [PubMed] [Google Scholar]
- 19.Schreiber WG, Brix G, Knopp MV, Hess T, Lorenz WJ. Improved visualization of breast lesions with gadolinium-enhanced magnetization transfer MR imaging. Magn Reson Med. 1996 Jun;35(6):861–869. doi: 10.1002/mrm.1910350612. [DOI] [PubMed] [Google Scholar]
- 20.Bonini RHM, Zeotti D, Saraiva LAL, Trad CS, Filho JMS, Carrara HHA, de Andrade JM, Santos AC, Muglia VF. Magnetization transfer ratio as a predictor of malignancy in breast lesions: preliminary results. Magn Reson Med. 2008 May;59(5):1030–1034. doi: 10.1002/mrm.21555. [DOI] [PubMed] [Google Scholar]
- 21.Medved M, Newstead GM, Abe H, Zamora MA, Olopade OI, Karczmar GS. High spectral and spatial resolution MRI of breast lesions: preliminary clinical experience. AJR Am J Roentgenol. 2006 Jan;186(1):30–37. doi: 10.2214/AJR.04.1704. [DOI] [PubMed] [Google Scholar]
- 22.Medved M, Newstead GM, Abe H, Olopade OI, Shimauchi A, Zamora MA, Karczmar GS. Clinical implementation of a multislice high spectral and spatial resolution-based MRI sequence to achieve unilateral full-breast coverage. Magn Reson Imaging. 2010 Jan;28(1):16–21. doi: 10.1016/j.mri.2009.05.022. [DOI] [PMC free article] [PubMed] [Google Scholar]
- 23.Franconi F, Chapon C, Le Jeune JJ, Richomme P, Lemaire L. Susceptibility gradient quantization by MRI signal response mapping (SIRMA) to dephaser. Med Phys. 2010 Feb;37(2):877–884. doi: 10.1118/1.3298019. [DOI] [PMC free article] [PubMed] [Google Scholar]
- 24.Fujima N, Kudo K, Terae S, Hida K, Ishizaka K, Zaitsu Y, Asano T, Yoshida D, Tha KK, Haacke EM, Sasaki M, Shirato H. Spinal arteriovenous malformation: evaluation of change in venous oxygenation with susceptibility-weighted MR imaging after treatment. Radiology. 2010 Mar;254(3):891–899. doi: 10.1148/radiol.09090286. [DOI] [PubMed] [Google Scholar]
- 25.Denk C, Rauscher A. Susceptibility weighted imaging with multiple echoes. J Magn Reson Imaging. 2010 Jan;31(1):185–191. doi: 10.1002/jmri.21995. [DOI] [PubMed] [Google Scholar]
- 26.Al-Hallaq HA, Fan X, Zamora M, River JN, Moulder JE, Karczmar GS. Spectrally inhomogeneous BOLD contrast changes detected in rodent tumors with high spectral and spatial resolution MRI. NMR Biomed. 2002 Feb;15(1):28–36. doi: 10.1002/nbm.728. [DOI] [PubMed] [Google Scholar]
- 27.Karczmar GS, River JN, Li J, Vijayakumar S, Goldman Z, Lewis MZ. Effects of hyperoxia on T2* and resonance frequency weighted magnetic resonance images of rodent tumours. NMR Biomed. 1994 Mar;7(1–2):3–11. doi: 10.1002/nbm.1940070103. [DOI] [PubMed] [Google Scholar]
- 28.Fan X, Du W, MacEneaney P, Zamora M, Karczmar G. Structure of the water resonance in small voxels in rat brain detected with high spectral and spatial resolution MRI. J Magn Reson Imaging. 2002 Nov;16(5):547–552. doi: 10.1002/jmri.10193. [DOI] [PubMed] [Google Scholar]
- 29.Foxley S, Fan X, Mustafi D, Haney C, Zamora M, Markiewicz E, Medved M, Wood AM, Karczmar GS. Sensitivity to tumor microvasculature without contrast agents in high spectral and spatial resolution MR images. Magn Reson Med. 2009 Feb;61(2):291–298. doi: 10.1002/mrm.21801. [DOI] [PMC free article] [PubMed] [Google Scholar]
- 30.Wood AM, Medved M, Pineda F, Escanow JS, Newstead GM, Karczmar GS, Foxley S, Ivancevic M, Swaminathan S, Olopade F. Off-peak Components of the Water Resonance Show Blood Vessels and May Distinguish Malignant and Benign Breast Lesions. 96th Scientific Assembly and Annual Meeting; RSNA, Chicago. November/December 2010.. [Google Scholar]
- 31.Al-Hallaq HA, Zamora M, Fish BL, Farrell A, Moulder JE, Karczmar GS. MRI measurements correctly predict the relative effects of tumor oxygenating agents on hypoxic fraction in rodent BA1112 tumors. Int J Radiat Oncol Biol Phys. 2000 May;47(2):481–488. doi: 10.1016/s0360-3016(00)00445-4. [DOI] [PubMed] [Google Scholar]
- 32.Du W, Du YP, Bick U, Fan X, MacEneaney PM, Zamora MA, Medved M, Karczmar GS. Breast MR imaging with high spectral and spatial resolutions: preliminary experience. Radiology. 2002 Aug;224(2):577–585. doi: 10.1148/radiol.2242011022. [DOI] [PubMed] [Google Scholar]
- 33.Reichenbach JR, Venkatesan R, Schillinger DJ, Kido DK, Haacke EM. Small vessels in the human brain: MR venography with deoxyhemoglobin as an intrinsic contrast agent. Radiology. 1997 Jul;204(1):272–277. doi: 10.1148/radiology.204.1.9205259. [DOI] [PubMed] [Google Scholar]
- 34.Du W, Karczmar GS, Uftring SJ, Du YP. Anatomical and functional brain imaging using high-resolution echo-planar spectroscopic imaging at 1. Tesla NMR Biomed. 2005 Jun;18(4):235–241. doi: 10.1002/nbm.952. [DOI] [PubMed] [Google Scholar]
- 35.Medved M, Newstead GM, Fan X, Du W, Du YP, MacEneaney PM, Culp RM, Kelcz F, Olopade OI, Zamora MA, Karczmar GS. Fourier components of inhomogeneously broadened water resonances in breast: a new source of MRI contrast. Magn Reson Med. 2004 Jul;52(1):193–196. doi: 10.1002/mrm.20115. [DOI] [PubMed] [Google Scholar]
- 36.Medved M, Newstead GM, Fan X, Du YP, Olopade OI, Shimauchi A, Zamora MA, Karczmar GS. Fourier component imaging of water resonance in the human breast provides markers for malignancy. Phys Med Biol. 2009 Oct;54(19):5767–5779. doi: 10.1088/0031-9155/54/19/007. [DOI] [PMC free article] [PubMed] [Google Scholar]
- 37.Chu SC, Xu Y, Balschi JA, Springer CS., Jr Bulk magnetic susceptibility shifts in NMR studies of compartmentalized samples: use of paramagnetic reagents. Magn Reson Med. 1990 Feb;13(2):239–262. doi: 10.1002/mrm.1910130207. [DOI] [PubMed] [Google Scholar]
- 38.Lunt SJ, Chaudary N, Hill RP. The tumor microenvironment and metastatic disease. Clin Exp Metastasis. 2009;26(1):19–34. doi: 10.1007/s10585-008-9182-2. [DOI] [PubMed] [Google Scholar]
- 39.Baluk P, Morikawa S, Haskell A, Mancuso M, McDonald DM. Abnormalities of basement membrane on blood vessels and endothelial sprouts in tumors. Am J Pathol. 2003 Nov;163(5):1801–1815. doi: 10.1016/S0002-9440(10)63540-7. [DOI] [PMC free article] [PubMed] [Google Scholar]
- 40.Vaupel P, Kallinowski F, Okunieff P. Blood flow, oxygen and nutrient supply, and metabolic microenvironment of human tumors: a review. Cancer Res. 1989 Dec;49(23):6449–6465. [PubMed] [Google Scholar]
- 41.Ntziachristos V, Yodh AG, Schnall MD, Chance B. MRI-guided diffuse optical spectroscopy of malignant and benign breast lesions. Neoplasia. 2002 Aug;4(4):347–354. doi: 10.1038/sj.neo.7900244. [DOI] [PMC free article] [PubMed] [Google Scholar]
- 42.Mansfield P. Real-time echo-planar imaging by NMR. Br Med Bull. 1984 Apr;40(2):187–190. doi: 10.1093/oxfordjournals.bmb.a071970. [DOI] [PubMed] [Google Scholar]
- 43.Jansen SA, Fan X, Karczmar GS, Abe H, Schmidt RA, Giger M, Newstead GM. DCEMRI of breast lesions: is kinetic analysis equally effective for both mass and nonmass-like enhancement? Med Phys. 2008 Jul;35(7):3102–3109. doi: 10.1118/1.2936220. [DOI] [PMC free article] [PubMed] [Google Scholar]
- 44.Du W, Du Y, Fan X, Zamora M, Karczmar G. Reduction of spectral ghost artifacts in high-resolution echo-planar spectroscopic imaging of water and fat resonances. Magnetic Resonance in Medicine: Official Journal of the Society of Magnetic Resonance in Medicine/Society of Magnetic Resonance in Medicine. 2003;49(6):1113–1120. doi: 10.1002/mrm.10485. [DOI] [PubMed] [Google Scholar]
- 45.Medved M, Ivancevic MK, Olopade OI, Newstead GM, Karczmar GS. Echo-planar spectroscopic imaging (EPSI) of the water resonance structure in human breast using sensitivity encoding (SENSE) Magn Reson Med. 2010 Jun;63(6):1557–1563. doi: 10.1002/mrm.22332. [DOI] [PMC free article] [PubMed] [Google Scholar]
- 46.Jansen SA, Fan X, Karczmar GS, Abe H, Schmidt RA, Newstead GM. Differentiation between benign and malignant breast lesions detected by bilateral dynamic contrast-enhanced MRI: a sensitivity and specificity study. Magn Reson Med. 2008 Apr;59(4):747–754. doi: 10.1002/mrm.21530. [DOI] [PMC free article] [PubMed] [Google Scholar]
- 47.Sadowski E, Bennett L, Chan M, Wentland A, Garrett A, Garrett R, Djamali A. Nephrogenic systemic fibrosis: risk factors and incidence estimation. Radiology. 2007;243(1):148–157. doi: 10.1148/radiol.2431062144. [DOI] [PubMed] [Google Scholar]
- 48.Scheffler K, Seifritz E, Bilecen D, Venkatesan R, Hennig J, Deimling M, Haacke EM. Detection of BOLD changes by means of a frequency-sensitive trueFISP technique: preliminary results. NMR Biomed. 2001 Dec;14(7–8):490–496. doi: 10.1002/nbm.726. [DOI] [PubMed] [Google Scholar]
- 49.Kirk K, Kuchel PW. Physical basis of the effect of hemoglobin on the 31P NMR chemical shifts of various phosphoryl compounds. Biochemistry. 1988 Nov;27(24):8803–8810. doi: 10.1021/bi00424a017. [DOI] [PubMed] [Google Scholar]
- 50.Shmueli K, Dodd SJ, Li T-Q, Duyn JH. The contribution of chemical exchange to MRI frequency shifts in brain tissue. Magn Reson Med. 2011 Jan;65(1):35–43. doi: 10.1002/mrm.22604. [DOI] [PMC free article] [PubMed] [Google Scholar]