

Abstract
Dietary substances, including herbal products and citrus juices, can perpetrate interactions with conventional medications. Regulatory guidances for dietary substance–drug interaction assessment are lacking. This deficiency is due in part to challenges unique to dietary substances, a lack of requisite human-derived data, and limited jurisdiction. An in vitro–in vivo extrapolation (IVIVE) approach to help address some of these hurdles was evaluated using the exemplar dietary substance grapefruit juice (GFJ), the candidate marker constituent 6′,7′-dihydroxybergamottin (DHB), and the purported victim drug loperamide. First, the GFJ-loperamide interaction was assessed in 16 healthy volunteers. Loperamide (16 mg) was administered with 240 ml of water or GFJ; plasma was collected from 0 to 72 hours. Relative to water, GFJ increased the geometric mean loperamide area under the plasma concentration–time curve (AUC) significantly (1.7-fold). Second, the mechanism-based inhibition kinetics for DHB were recovered using human intestinal microsomes and the index CYP3A4 reaction, loperamide N-desmethylation (KI [concentration needed to achieve one-half kinact], 5.0 ± 0.9 µM; kinact [maximum inactivation rate constant], 0.38 ± 0.02 minute−1). These parameters were incorporated into a mechanistic static model, which predicted a 1.6-fold increase in loperamide AUC. Third, the successful IVIVE prompted further application to 15 previously reported GFJ-drug interaction studies selected according to predefined criteria. Twelve of the interactions were predicted to within the 25% predefined criterion. Results suggest that DHB could be used to predict the CYP3A4-mediated effect of GFJ. This time- and cost-effective IVIVE approach could be applied to other dietary substance–drug interactions to help prioritize new and existing drugs for more advanced (dynamic) modeling and simulation and clinical assessment.
Introduction
Drug-drug interactions (DDIs) due to inhibition of drug-metabolizing enzymes can produce severe adverse effects, resulting in cautionary statements on drug labels or withdrawal of the drug from the market (Fujioka et al., 2012). Consequently, regulatory agencies recommend or require thorough characterization of new drug candidates as both DDI “victims” and “perpetrators.” Such characterization, spanning from discovery to clinical development, is well defined and generally harmonized among the various agencies. In contrast, relevant guidelines are nonexistent for diet-derived products, including dietary supplements and exotic beverages, which represent an ever-increasing share of the Western health care market. This deficiency reflects the relative lack of robust human-derived in vitro and in vivo data, precluding development of a systematic approach that would help identify dietary substances as potential perpetrators of interactions with drugs, as well as prioritize for clinical evaluation.
As an initial step toward developing an aforementioned approach, methods used to predict and characterize metabolism-based DDIs could be extended to dietary substance–drug interactions. DDI predictions using in vitro enzyme kinetic parameters have become increasingly more advanced in drug discovery (Vieira et al., 2014). Mechanistic static models have shown success for DDIs localized in the liver, the primary site of these interactions. However, because diet-derived constituents generally have a low systemic exposure (due to extensive presystemic metabolism) but high intestinal exposure, and most drugs are taken orally, the gut likely represents the primary site of dietary substance–drug interactions. Accordingly, models that are tailored to processes exclusive to the gut may be more appropriate for predicting these interactions.
Assessing dietary substance–drug interaction risk poses additional challenges compared with DDIs. Unlike drugs, dietary substances typically are complex mixtures that vary substantially in phytochemical composition, between both brands and batches of the same brand (Won et al., 2012). Accordingly, it has been postulated that “marker” constituents can be identified and used to predict the effect of the mixture (Won et al., 2012; National Center for Complementary and Alternative Medicine, 2013). Ideally, one marker constituent would be identified. Whether one or a few, such constituent(s) would enable a simplified and cost-effective means to assess dietary substance–drug interaction risk during the drug discovery process.
Grapefruit juice (GFJ) is an extensively studied perpetrator of dietary substance–drug interactions. When consumed in usual volumes, the “GFJ effect” is limited to the intestine, as evidenced by the general lack of an effect on the pharmacokinetics of intravenously administered drugs and on the terminal half-life of orally administered drugs. Most victim drugs share three requisite traits: they are orally administered, have a low to intermediate absolute bioavailability, and undergo CYP3A4-mediated first-pass metabolism in the intestine (Bailey et al., 2013). GFJ contains a chemical class of constituents, furanocoumarins, which are potent mechanism-based inhibitors of CYP3A4 (Paine et al., 2006a), a prominent drug-metabolizing enzyme expressed in both the intestine and liver (Paine et al., 2006b). 6′,7′-Dihydroxybergamottin (DHB), a typically abundant furanocoumarin in the juice, may represent a single marker constituent predictive of whole juice based on the following key properties/observations: the mechanism-based inhibition (MBI)–associated constant (KI; 1–5 µM) is well below/within concentrations measured in GFJ (0.2–52 μM) (De Castro et al., 2006); the onset of peak effect, defined as the maximum loss of CYP3A4 protein in human intestine-derived cell monolayers (Caco-2) (Paine et al., 2005), is predictive of that in healthy volunteers administered GFJ (Lown et al., 1997); the polarity relative to other furanocoumarins enables straightforward quantification in both GFJ and biologic matrices; and an authentic standard is commercially available that is not cost prohibitive.
In the present work, an in vitro–in vivo extrapolation (IVIVE) approach using DHB as a marker constituent of the exemplar dietary substance GFJ was applied to a purported victim drug that had not been described in the literature. Loperamide, a μ-opioid receptor agonist, was selected as the test victim drug based on the aforementioned criteria. In addition, anecdotal reports suggest an abuse potential when taken at supratherapeutic doses with GFJ (Daniulaityte et al., 2013), substantiating investigation of the interaction liability. The aim of this study was to test the proposed approach of using a marker constituent to predict the effect of a mixture by (1) confirming a CYP3A4-mediated dietary substance–drug interaction involving GFJ and loperamide in healthy volunteers; (2) obtaining MBI kinetic parameters for the marker constituent, DHB, using loperamide N-desmethylation by human intestinal microsomes as the index reaction; (3) applying a mechanistic static model using DHB to predict the GFJ-loperamide interaction; and (4) applying the model to previously reported CYP3A4-mediated GFJ-drug interaction studies to evaluate robustness of both the marker constituent and IVIVE method. Results will aid in the selection of marker constituents to assess dietary substance interaction liability with candidate and marketed drugs and help prioritize these drugs for more advanced modeling and, ultimately, clinical evaluation.
Materials and Methods
Human intestinal microsomes (HIMs), pooled from 13 donors of mixed gender (7 male, 6 female), were purchased from XenoTech, LLC (Lenexa, KS). Plasma pooled from multiple donors (mixed gender, distribution unknown) was purchased from Biological Specialty Corporation (Colmar, PA). Loperamide hydrochloride, D6-loperamide, N-desmethylloperamide, and D3-N-desmethylloperamide were purchased from Toronto Research Chemicals, Inc. (North York, ON, Canada). DHB was purchased from Cayman Chemical (Ann Arbor, MI). Psoralen, NADPH, and dimethylsulfoxide (DMSO) were purchased from Sigma-Aldrich (St. Louis, MO). Liquid chromatography–tandem mass spectrometry (LC-MS/MS)–grade acetonitrile, water, methanol, and formic acid were purchased from Thermo Fisher Scientific (Waltham, MA).
Human Subject Study
Preparation of Grapefruit Juice.
Multiple cans of a single brand (Minute Maid, Sugar Land, TX) and lot of frozen GFJ concentrate were purchased from a local grocery store. The concentrates were thawed and pooled, and an aliquot was saved for measurement of DHB by high-performance liquid chromatography (Paine et al., 2006a). The pooled concentrate was diluted with water to achieve a “double-strength” juice (DHB final concentration ∼70 μM) to maximize the likelihood of observing an interaction. The diluted juice was divided into 240-ml aliquots and stored at −20°C and protected from light until needed.
Clinical Protocol and Participants.
The University of North Carolina Office of Human Research Ethics/Biomedical Institutional Review Board and Clinical and Translational Research Center (CTRC) Oversight Committee reviewed and approved the protocol. Potential subjects provided written informed consent and Health Insurance Portability and Accountability Act authorization before screening at the CTRC, which consisted of a medical history, physical examination, liver function tests, and complete blood count. All women underwent a serum pregnancy test.
Study Design and Procedures.
A prospective, randomized, two-phase, open-label crossover study was conducted at the CTRC (Fig. 1). Prior to the first study phase, the participants were asked to abstain from all fruit juices for 1 week before and during the study, and from alcohol and caffeinated beverages the evening before each study day. Participants were admitted to the CTRC the evening before each study phase. Vital signs (blood pressure, temperature, pulse, respirations) and oxygen saturation were obtained upon admission and monitored periodically throughout the in-patient portion of each phase. All women underwent a repeat serum pregnancy test. After an overnight fast, each participant was administered 16 mg of loperamide (Mylan Inc., Canonsburg, PA) with 240 ml of water or GFJ. Blood (7 ml) was collected from an indwelling intravenous catheter before and 0.5, 1, 2, 3, 4, 5, 6, 8, 10, and 12 hours after loperamide administration. Blood was centrifuged within 1 hour of collection; plasma was removed and stored at −80°C pending analysis for loperamide and the primary CYP3A4-mediated metabolite, N-desmethylloperamide, by LC-MS/MS (see below). Subjects continued to fast until after the 4-hour blood collection, after which meals and snacks, devoid of fruit juices/products and caffeinated beverages, were provided. After the 12-hour blood collection, subjects were discharged. Subjects returned to the CTRC as out-patients for blood draws at 24, 36, 48, and 72 hours after loperamide administration. The two phases were separated by at least 2 weeks.
Fig. 1.

Clinical study design and procedures. As a positive control for miosis, nine subjects were administered morphine sulfate (0.07 mg/kg i.v.; 5-minute infusion); pupil diameter was measured before and 5, 10, 20, 30, 60, 90, and 120 minutes after infusion. After an overnight fast, subjects (n = 16) were administered 16 mg of loperamide with either 240 ml of water (control) or grapefruit juice (treatment). Blood and dark-adapted pupil diameter measurements were obtained before and 0.5, 1, 2, 3, 4, 5, 6, 8, 10, and 12 hours after loperamide administration on the first day of each study phase. Subjects returned as outpatients for blood draws and pupil diameter measurements at 24, 36, 48, and 72 hours after loperamide administration. The two phases were separated by at least 2 weeks.
Concurrent with the blood collections, dark-adapted pupil diameter, the most sensitive index of opioid effect, was measured using a NeurOptics VIP-200 pupillometer with a resolution of 0.1 mm (San Clemente, CA). Pupil diameter was obtained at least in triplicate, with coefficients of variation ≤2.8%. The light intensity of the room, measured by a Sper Scientific 840021 light meter (Scottsdale, AZ), was always <1 lux. As a positive control for the miotic effect, 9 subjects (5 men, 4 women) were administered a “morphine challenge” the evening of the first phase. Morphine sulfate (0.07 mg/kg i.v.; Hospira Inc., Lake Forest, IL) was administered as a 5-minute infusion via a syringe pump. Pupil diameter was measured before and 5, 10, 20, 30, 60, 90, and 120 minutes after infusion. Subjects were in the supine position and were monitored with an automated blood pressure cuff and pulse oximeter during the infusion and for 2 hours thereafter. Vital signs were monitored concurrent with pupil diameter measurement. Supplemental oxygen was available if oxygen saturation decreased to <94%. The opioid antagonist, naloxone (International Medication Systems Ltd., South El Monte, CA), and antiemetic agent, promethazine (Goldline Laboratories, Inc., North Wales, PA), were available if needed.
Determination of Mechanism-Based Inhibition Kinetic Parameters for DHB
Time- and concentration-dependent inhibition of CYP3A4 activity by DHB in HIMs was assessed as described previously (Paine et al., 2004), except that N-desmethylloperamide formation was used as the index reaction. In brief, loperamide and DHB were dissolved in DMSO to yield working solutions of 5 and 2 mM, respectively. Primary incubation mixtures consisted of HIMs (5 mg/ml), DHB (0, 2.5, 5, 10, and 30 µM), and potassium phosphate buffer (0.1 M, pH 7.4). The mixtures were equilibrated at 37°C for 5 minutes before initiating the reactions with NADPH (1 mM final concentration), yielding a final volume of 80 µl; the final concentration of DMSO was ∼1% (v/v). At designated times from 0 to 5 minutes, an aliquot (10 µl) was removed and diluted 20-fold into secondary incubation mixtures containing loperamide and NADPH (1 mM), yielding a final loperamide concentration of 60 μM. Secondary reactions were terminated after 20 minutes by transferring 100 µl to a 96-well plate containing 300 µl of acetonitrile/0.1% (v/v) formic acid and internal standard (0.5 μM D3-N-desmethylloperamide). Plates were centrifuged (2000g for 10 minutes at 4°C), and 200 µl of supernatant was transferred to clean plates. The contents were dried under heated nitrogen (50°C), reconstituted in 200 µl of 95% water:5% acetonitrile:0.1% formic acid (v/v/v) (initial chromatographic conditions), and analyzed for N-desmethylloperamide by LC-MS/MS (see below).
Quantification of Loperamide and N-Desmethylloperamide
Human Plasma.
Plasma (50 µl) was added to methanol (70 µl) containing internal standard (4.3 nM D6-loperamide and D3-N-desmethylloperamide), then precipitated with 360 µl of methanol. The mixtures were vortexed for 5 minutes and centrifuged (3000g for 10 minutes at 4°C). Calibration (0.1–25 nM) and quality control (0.75, 4, and 12 nM) solutions were prepared using authentic standards and blank human plasma. Sample (5 µl) was injected onto an Aquasil C18 (2.1 × 50 mm, 5 µm particle size) analytical column (Thermo Fisher Scientific). Analytes were eluted with a binary gradient consisting of water/0.1% (v/v) formic acid (mobile phase A) and acetonitrile/0.1% (v/v) formic acid (mobile phase B) at a flow rate of 0.75 ml/min. Initially, mobile phase B was held at 20% for 0.4 minute, then increased linearly to 95% for 3.6 minutes. Mobile phase B was held at 95% for 0.5 minute, then returned to initial conditions over 6 seconds and equilibrated. The total run time was 5 minutes. All eluted solvent was directed to an API4000 QTRAP triple quadrupole mass spectrometer (AB Sciex, Framingham, MA). Multiple reaction monitoring mode was used to detect loperamide (477.3→266.2 m/z), N-desmethylloperamide (463.2→252.2 m/z), D6-loperamide (483.3→272.2 m/z), and D3-N-desmethylloperamide (466.3→255.2 m/z); collision energy was set to 20 mV for all analytes. Loperamide and N-desmethylloperamide concentrations were quantified using Analyst software (v1.4.1; AB Sciex) by interpolation from matrix-matched calibration curves and quality controls with a linear range of 0.1–25 nM. The calibration standards and quality controls were judged for batch quality based on the 2013 Food and Drug Administration guidance for industry regarding bioanalytical method validation (US Food and Drug Administration, 2013).
Microsomal Incubations.
Calibration (1–1000 nM) and quality control (2.5, 500, and 800 nM) solutions were prepared using authentic N-desmethylloperamide standard and HIMs. Sample (5 µl) was injected onto an Aquasil C18 (2.1 × 50 mm, 5 µm particle size) analytical column. Chromatographic separation was achieved using the same high-performance liquid chromatography system and mobile phases as for plasma. Due to the high buffer and salt content of the microsomal samples relative to plasma, the binary gradient method was modified. Initial conditions consisted of 10% mobile phase B held for 1 minute, then increased linearly to 95% B over 1.5 minutes and held for 0.5 minute. The gradient was returned to initial conditions over 0.1 minute to equilibrate the column. The total run time was 4 minutes. The eluted solvent was directed to a Sciex API5600 triple quadrupole–time of flight mass spectrometer. Ionization was achieved with a turbo electrospray source operated in positive ion mode. The declustering potential and collision energy were set to 25 V and 30 mV, respectively. N-Desmethylloperamide was quantified using Multiquant software (v2.1.1; AB Sciex), selecting a fragment ion range of 252.1–252.8 and 255.1–255.8 m/z for N-desmethylloperamide and D3-N-desmethylloperamide, respectively. As with plasma analysis, all calibration standards and quality control samples were judged for batch quality based on the 2013 Food and Drug Administration guidance (US Food and Drug Administration, 2013).
Data Analyses
Pharmacokinetic and Pharmacodynamic Analysis.
Pharmacokinetic and pharmacodynamic outcomes were recovered via noncompartmental methods using Phoenix WinNonlin (v6.3; Certara, St. Louis, MO).
Pharmacokinetics.
The maximum concentration (Cmax), time to reach Cmax (Tmax), and last measured concentration (C72h) were obtained directly from the plasma concentration–time profiles. The terminal elimination rate constant (λz) was determined by linear regression of the terminal portion of the log-transformed concentration-time profile using at least three data points. The terminal half-life (t1/2) was calculated as ln(2)/λz. Area under the plasma concentration–time curve (AUC) from time 0 to 72 hours (AUC0-72h) was determined using the trapezoidal method with linear up/log down interpolation. The AUC from time 0 to infinity (AUC0-inf) was calculated as the sum of AUC0-72h and C72h/λz. The oral clearance of loperamide (Cl/F) was calculated as the ratio of dose to AUC0-inf. The metabolite-to-parent AUC ratio [(AUCm/AUCp)0-72h] was calculated as the ratio of the AUC0-72h of N-desmethylloperamide to that of loperamide. The primary pharmacokinetic outcome was the ratio of loperamide AUC0-inf in the presence of GFJ to that in the absence of GFJ (AUCGFJ/AUC).
Pharmacodynamics.
Baseline pupil diameter was obtained at time 0, and miosis was determined as the decrease in pupil diameter from baseline. The area under the effect (miosis)-time curve from 0 to 72 hours (AUEC0-72h) was calculated by the linear trapezoidal method with an adjustment from the baseline pupil diameter measurement. The maximum decrease in pupil diameter (Rmax) was obtained directly from the miosis-time profile.
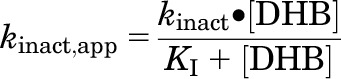
MBI Kinetic Parameters for DHB.
KI (concentration needed to achieve one-half kinact) and kinact (maximum inactivation rate constant) were recovered using previously published methods (Paine et al., 2004; Obach et al., 2007). Final parameter estimates were obtained by nonlinear least-squares regression using Phoenix WinNonlin and eq. 1:
 |
(1) |
where kinact,app denotes the apparent inactivation rate constant at each inhibitor (DHB) concentration, determined by the slope of the monoexponential decline in activity. Model fit was evaluated from visual inspection of the observed versus predicted values, randomness of the residuals, and standard errors of the parameter estimates. The efficiency of inactivation was calculated as the ratio of kinact to KI.
Grapefruit Juice–Loperamide Interaction Prediction Using DHB as a Marker Constituent.
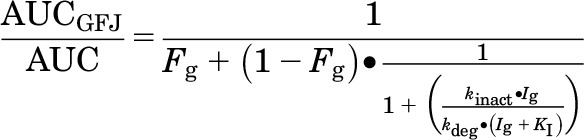
The GFJ-mediated increase in AUC (AUCGFJ/AUC) for loperamide was predicted using DHB as a marker constituent and a mechanistic static model (eq. 2) for intestinal MBI (Obach et al., 2007):
 |
(2) |
where Fg denotes the fraction of the dose of victim drug (loperamide) escaping first-pass extraction in the intestine (0.62), Ig denotes the concentration of inhibitor (DHB) in the enterocyte (5 µM), and kdeg denotes the degradation rate constant associated with intestinal CYP3A4 (0.000481 minute−1) (Obach et al., 2007). The Qgut and Advanced Dissolution, Absorption, and Metabolism (ADAM) models in Simcyp (v13; Certara) (Yang et al., 2007; Jamei et al., 2009) were used to estimate loperamide Fg using MDCK cell permeability (Peff, 0.586 × 10⁻⁴ cm/s) (Tran et al., 2004) and recombinant CYP3A4 metabolism data (Km,CYP3A4, 6.3 µM; Vmax,CYP3A4, 1.7 pmol/min per nanomole CYP3A4) (Kim et al., 2004). The ADAM model was used to estimate Ig using Caco-2 cell permeability data (Peff, 6.202 × 10⁻⁴ cm/s) (Paine et al., 2005) and a DHB “dose” equal to that in the clinical GFJ-loperamide interaction study (72.3 μM, or 6.2 mg/240 ml serving). The fraction of the dose of loperamide absorbed into enterocytes was assumed to remain unchanged in the presence of GFJ.
Grapefruit Juice–Drug Interaction Predictions with Marketed Drugs Using DHB as a Marker Constituent.
The utility of DHB as a marker constituent predictive of CYP3A4-mediated GFJ-drug interactions was examined further with marketed drugs that have been evaluated in the clinic. Test victim drugs (Table 2) were selected based on the following criteria: intestinal CYP3A4 substrate, availability of human pharmacokinetic data, and availability of Fg. Fg was obtained, in order of precedence, from liver transplant recipients during the anhepatic phase of the operation, by the combined intravenous/oral administration method, or from in vitro–in vivo scaling techniques (Galetin et al., 2010). Drugs whose Fg values were estimated by a fourth method, which involves GFJ administration (Gertz et al., 2008), were excluded to avoid bias. Because the static model cannot account for differences in GFJ administration frequencies, and the DHB concentration in the clinical study juice often was not measured/not reported, a range of DHB Ig values (0.05, 5, and 50 µM) was used. AUCGFJ/AUC predictions were made using eq. 2 and evaluated against observations from the literature. As the GFJ-loperamide interaction study was powered to detect a 25% change in loperamide AUC0-inf, predicted AUCGFJ/AUCs were evaluated against observed ratios with a predefined cutoff of 25% to define a successful prediction (Vieira et al., 2014).
TABLE 2.
Victim drug, Fg, F, and clinical study information for the IVIVE
F, oral bioavailability.
Obtained from Brunton et al. (2010) unless indicated otherwise.
Ratio of the area under the plasma concentration–time curve in the presence to absence of grapefruit juice, unless indicated otherwise.
Estimated using intravenous administration, systemic clearance, and oral bioavailability data.
Obtained from Kharasch et al. (2004a).
Determined by in vitro to in vivo extrapolation using in vitro intrinsic clearance data.
Determined from anhepatic patients.
Ratio of maximum concentration in the presence to absence of grapefruit juice.
Ratio of trough concentrations in liver transplant recipients following 1 week of treatment and chronic grapefruit juice consumption.
Obtained from Masica et al. (2004).
Sensitivity Analysis to Assess the Relationship between DHB Ig, Victim Drug Fg, and the Predicted AUCGFJ/AUC.
Due to the uncertainty in DHB Ig, the variability in GFJ administration frequency in clinical studies, the uncertainty in victim drug Fg predictions, and the potential variability in kdeg, AUCGFJ/AUCs were simulated with increasing Ig, Fg, and kdeg. Simulations were conducted in Phoenix WinNonlin using eq. 2, with Ig ranging from 0 to 5 μM, Fg from 0.1 to 0.9, and kdeg from 0 to 0.005 minute−1 in increments of 0.1 µM, 0.05, and 0.0001 minute−1, respectively.
Statistical Analyses
Statistical analyses were conducted using SAS (v9.1.3; SAS Institute, Cary, NC).
Clinical Study.
The sample size was based on 80% power to detect a 25% difference in the primary outcome of loperamide, AUCGFJ/AUC, with an alpha of 0.05. Data are presented as the geometric mean [90% confidence interval] with the exception of Tmax, which is presented as the median (range). The primary outcome was evaluated against the predefined no-effect range of 0.75–1.33. The Wilcoxon signed-rank test was used to test for a difference in Tmax. Differences in AUC0-72h, AUC0-inf, Cmax, t1/2, Cl/F, and AUEC between treatment groups were analyzed by standard repeated-measures analysis of variance (α = 0.05) using log-transformed data.
In Vitro Study.
Data are presented as the mean of duplicate incubations. MBI kinetic parameters are presented as estimates ± S.E.
Results
All Enrolled Subjects Completed the Clinical Study with Negligible Side Effects
The mean ± S.D. concentration of DHB in the test juice was 73.7 ± 4.0 µM, measured in triplicate. Of the 18 potential subjects screened, 8 men and 8 nonpregnant women were enrolled. The median (range) age was 29 (22–59) and 40 (29–53) years, respectively. Participants were self-identified as white (5 men, 4 women), African American (1 man, 4 women), Hispanic (1 man), or Asian (1 man). None of the subjects reported taking concomitant medications or dietary substances known to modulate the metabolism and transport of both loperamide and morphine. Concomitant medications included acetaminophen (2 women) and promethazine (1 woman). All subjects completed both phases of the study. GFJ and both drugs were well tolerated; one subject reported mild constipation with loperamide during the GFJ phase that resolved within 24 hours.
Grapefruit Juice Increased the Systemic Exposure of Loperamide with No Effect on Pupil Diameter
Pharmacokinetics.
Loperamide and N-desmethylloperamide were detected readily in plasma of all subjects throughout the 72-hour collection period. Relative to water, GFJ elevated the plasma concentrations of loperamide but had no effect on those of N-desmethylloperamide (Fig. 2A). The percentage of loperamide AUC0-inf extrapolated from 72 hours to infinite time was always <25% in both the water and GFJ phases. The primary outcome, AUCGFJ/AUC, was outside the range associated with bioequivalence (0.75–1.33) (Table 1). Relative to water, GFJ increased geometric mean loperamide Cmax, AUC0-72h, and AUC0-inf significantly, by ∼60–70%; geometric mean Cl/F decreased significantly, by 43% (Table 1). GFJ had no effect on geometric mean loperamide terminal t1/2. Median loperamide Tmax did not differ significantly between treatments. The percentage of N-desmethylloperamide AUC0-inf extrapolated from 72 hours to infinite time was >40% in the water and GFJ phases in 10 of the subjects, precluding accurate recovery of AUC0-inf, as well as t1/2, in these subjects. As such, geometric means for these outcomes are not reported. GFJ had no effect on N-desmethylloperamide geometric mean Cmax and AUC0-72h and median Tmax; (AUCm/AUCp)0-72h decreased by 40% (Table 1).
Fig. 2.

Loperamide (solid symbols) and N-desmethylloperamide (open symbols) plasma concentrations (A) and pupil diameter measurements (B) in 16 healthy volunteers administered loperamide (16 mg) with 240 ml of water (circles, solid lines) or grapefruit juice (triangles, dashed lines). The inset depicts the 0- to 2-hour pupil diameter–time profile after loperamide (in the absence and presence of grapefruit juice) and morphine (diamonds) administration for the nine volunteers administered the morphine challenge (0.07 mg/kg i.v.). Symbols and error bars denote the geometric mean and upper 90% confidence intervals, respectively.
TABLE 1.
Pharmacokinetic outcomes of loperamide and N-desmethylloperamide in 16 healthy volunteers administered loperamide (16 mg) with 240 ml of water or GFJ
Values denote the geometric mean (90% confidence intervals) unless indicated otherwise.
| Outcome | Water | GFJ | GFJ/Water Ratio |
|---|---|---|---|
| Loperamide | |||
| Cmax (nM) | 6.5 (5.3–8.1) | 10 (8.2–13) | 1.58 (1.33–1.88)a |
| AUC0-72h (nM · h) | 105 (87–126) | 180 (149–220) | 1.72 (1.58–1.87)a |
| AUC0-inf (nM · h) | 118 (96–145) | 203 (165–250) | 1.73 (1.58–1.89)a |
| Cl/F (l/h) | 285 (232–351) | 165 (134–203) | 0.57 (0.53–0.62)a |
| Terminal t1/2 (h) | 23.3 (20.7–26.3) | 23.2 (20.8–26.0) | 1.04 (0.94–1.16) |
| Tmax (h) [median (range)] | 3.0 (0.5–12) | 5.0 (2.0–6.0)b | |
| N-Desmethylloperamide | |||
| Cmax (nM) | 7.9 (6.7–9.2) | 7.7 (6.6–9.0) | 0.98 (0.83–1.15) |
| AUC0-72h (nM · h) | 271 (253–290) | 290 (270–310) | 1.04 (0.99–1.10) |
| Tmax (h) [median (range)] | 5.5 (2.0–12) | 7.0 (4.0–26)b | |
| Metabolite/parent AUC ratio | |||
| (AUCm/AUCp)0-72h | 2.6 (2.2–3.1) | 1.6 (1.3–1.9) |
AUCm, AUC of N-desmethylloperamide; AUCp, AUC of loperamide.
Outside the predefined no-effect range (0.75–1.33).
Not significant (P < 0.05, Wilcoxon signed-rank test).
Pharmacodynamics.
Relative to baseline, morphine, but not loperamide, decreased pupil diameter (Fig. 2B). The geometric mean (90% confidence interval [90% CI]) AUEC0-2h and Rmax for morphine were 150 [115–195] mm*h and 1.9 [1.5–2.5] mm, respectively. The median (range) time to Rmax was 1.0 (0.5–1.5) hours. The geometric mean [90% confidence interval] AUEC0-72h for loperamide in the absence and presence of GFJ was 11.3 [9.2–13.9] and 11.8 [8.5–16.4] mm*h, respectively; the geometric mean Rmax was 0.38 [0.30–0.47] and 0.40 [0.33–0.51] mm, respectively.
DHB Is a Mechanism-Based Inhibitor of Loperamide N-Desmethylation in HIMs
DHB inhibited N-desmethylloperamide formation in a time- and concentration-dependent manner in HIMs (Fig. 3). The KI and kinact were 5.0 ± 0.9 µM and 0.38 ± 0.02 minute−1, respectively. The efficiency of inactivation (kinact/KI) was 76 µl/min per picomole.
Fig. 3.

Time- and concentration-dependent inhibition of loperamide N-desmethylation by DHB in human intestinal microsomes. Symbols denote the mean of duplicate incubations, all of which deviated by <20%. Lines denote linear regression of the initial monoexponential decline; solid lines denote nonlinear least-squares regression of observed values using Phoenix WinNonlin (v6.3). The inset depicts the apparent enzyme inactivation rate as a function of DHB concentration.
DHB Is Predictive of Interactions between Grapefruit Juice and Loperamide and Several Marketed Drugs
Using DHB as a marker constituent of GFJ and a mechanistic static model, the predicted AUCGFJ/AUC for loperamide was 1.6. The AUCGFJ/AUC and Fg for other marketed drugs were obtained from the literature according to predefined criteria. The reported absolute bioavailability and Fg of these drugs ranged from 0.12 to 0.94 and 0.14 to 0.94, respectively (Table 2). Application of the mechanistic static model to these marketed drugs predicted the AUCGFJ/AUC of 12 of 15 interactions to within the predefined 25% criterion (Fig. 4).
Fig. 4.

Relationship between the predicted and observed AUCGFJ/AUC for 15 test drug substrates of the “grapefruit juice effect” due to inhibition of intestinal CYP3A4. Predictions were made using a mechanistic static model. The solid line denotes unity. Dashed lines denote 25% variability around the line of unity. Error bars denote predicted values at an Ig of 0.05 µM (lower) and 50 µM (upper, which are smaller than the circles); circles denote the predicted values at an Ig of 5 µM. Closed circles denote predictions that were accurate to within 25% of observed values. Open circles denote predictions that were >25% of observed values.
Victim Drug Fg Is More Sensitive than Enterocyte Ig and Intestinal CYP3A4 kdeg in the Prediction of AUCGFJ/AUC
AUCGFJ/AUC was simulated with varying Ig, Fg, and kdeg to account for the uncertainty in enterocyte DHB concentration and variability in victim drug Fg and kdeg. Using loperamide as an example, of which the estimated Fg was 0.62 (predicted using the Qgut model in Simcyp), incremental (0.1 µM) increases in Ig reached a maximum AUCGFJ/AUC (1.6) at 1.2 µM (Fig. 5). The Ig required to achieve the maximum AUCGFJ/AUC increased with decreasing Fg. An incremental decrease (0.05) in Fg from 0.90 to 0.45 at a constant Ig (1.2 µM) resulted in a nearly proportional increase in AUCGFJ/AUC. Simulated Fg values less than 0.45 resulted in a greater than proportional increase in AUCGFJ/AUC. Simulations with varying kdeg showed a minimal effect on AUCGFJ/AUC at any given Ig or Fg (not shown).
Fig. 5.

Relationship between the magnitude of a grapefruit juice–drug interaction (defined by AUCGFJ/AUC) for varying enterocyte Ig and Fg. Simulations were conducted using Phoenix WinNonlin and eq. 2.
Discussion
Dietary substance–drug interaction risk assessment is fraught with challenges, adding to those encountered with DDIs. Dietary substances have a more complex biochemical makeup than oral drug formulations. Identification of major constituents (chemical classes or single chemical entities) that contribute to inhibition of drug-metabolizing enzymes, as well as transporters, would help address some of these challenges (Won et al., 2012; National Center for Complementary and Alternative Medicine, 2013). Ideally, a single marker constituent would be identified and evaluated using methods similar to those used during drug development, including in vitro bioactivity assays, IVIVE, and clinical assessment. An approach involving a combination of these methods was evaluated using the exemplar perpetrator dietary substance GFJ and the marker constituent DHB.
Loperamide was selected as the test victim drug based on predefined criteria (Bailey et al., 2013), and a GFJ-loperamide interaction study had not been described. The present healthy volunteer study confirmed the interaction, in which the primary outcome, geometric mean loperamide AUCGFJ/AUC, was 1.7. The lack of effect on loperamide terminal t1/2 was consistent with an interaction limited to the gut, which is typical of GFJ-drug interactions (Won et al., 2012; Bailey et al., 2013). In contrast to loperamide, the pharmacokinetics of the primary CYP3A4-mediated metabolite, N-desmethylloperamide, were unchanged in the presence of GFJ, which may reflect elimination rate–limited kinetics and/or more rapid distribution into peripheral tissues relative to loperamide (Sklerov et al., 2005). The pharmacokinetics of both loperamide and N-desmethylloperamide in the absence of GFJ were consistent with those reported at an equivalent (16 mg) (Mukwaya et al., 2005) or lower (2–4 mg) (Streel et al., 2005; Niemi et al., 2006) loperamide dose after dose normalization.
Based on anecdotal reports describing loperamide abuse when taken with GFJ (Daniulaityte et al., 2013) and the ease of measuring pupil diameter as an index of central nervous system opiate-like effect, a pharmacodynamic interaction was assessed. Compared with baseline, the relatively high dose of loperamide did not produce miosis in either the absence or presence of GFJ. The lack of miosis was consistent with previous healthy volunteer studies in which loperamide was administered at higher doses (≥24 mg) (Skarke et al., 2003) or with potent CYP3A4 or dual CYP3A4/P-glycoprotein (P-gp) inhibitors (Mukwaya et al., 2005; Niemi et al., 2006).
Confirmation of the GFJ-loperamide interaction permitted evaluation of a marker constituent predictive of whole juice. In addition to DHB, the furanocoumarin bergamottin was considered. Although several furanocoumarins (including dimers and trimers of DHB and bergamottin) are mechanism-based inhibitors of CYP3A4, DHB and bergamottin are the most extensively studied, are readily quantifiable in GFJ, and authentic standards are commercially available. Despite the fact that bergamottin is a potent mechanism-based inhibitor, this constituent appears to contribute minimally to the effect in vivo (Goosen et al., 2004), at least with respect to rapidly absorbed CYP3A4 substrates (Paine et al., 2005).
MBI kinetic parameters for DHB were confirmed using pooled HIMs and N-desmethylloperamide formation as the index reaction to inform a mechanistic static interaction model specific to the gut. The parameters, KI and kinact (5.0 μM and 0.38 minute−1, respectively), were comparable to those recovered using other CYP3A4-mediated reactions and HIMs prepared from a single donor, specifically testosterone 6β-hydroxylation (2.5 µM and 0.40 minute−1, respectively) and midazolam 1′-hydroxylation (3.5 µM and 0.31 minute−1, respectively) (Paine et al., 2004). Because MBI appears to predominate over reversible inhibition, at least with respect to fruit juices (Hanley et al., 2012), only MBI was considered for the predictions. The other parameters needed to inform the model, Fg and Ig, were estimated using literature data. The Fg for loperamide and Ig for DHB were predicted using the Qgut and ADAM models within Simcyp (Yang et al., 2007), which were informed by permeability data (loperamide and DHB) (Tran et al., 2004; Paine et al., 2005), metabolic kinetic data (loperamide) (Kim et al., 2004), and intestinal villous blood flow. The predicted AUCGFJ/AUC agreed with the observed AUCGFJ/AUC (1.6 versus 1.7) to within the 25% predefined criterion, supporting DHB as a marker constituent predictive of the CYP3A4-mediated GFJ effect.
The successful IVIVE with the GFJ-loperamide interaction prompted further evaluation with other previously tested CYP3A4 drug substrates. Based on the availability of human pharmacokinetic data and Fg values, 15 interaction studies were identified. Although the absolute bioavailability of three of the drugs was relatively high (>70%), and thus were not victim drugs per se, these drugs were included to provide a wide range of AUCGFJ/AUCs. The Fg values of the test drugs, determined from liver transplant patients during the anhepatic phase of the operation, by combined intravenous and oral administration, or in vitro–in vivo scaling techniques, ranged from 0.11 to 0.94. Drugs whose Fg values were determined using GFJ to “knockout” intestinal CYP3A4 were excluded to avoid bias. The same DHB Ig used for the GFJ-loperamide interaction prediction was used for the other victim drugs. As with loperamide, DHB was predictive to within 25% of the observed AUCGFJ/AUC for 12 of the interactions. The three outlier victim drugs were atorvastatin, simvastatin, and triazolam. The interaction with atorvastatin was overpredicted by 3.3-fold (4.0 versus 1.2), which may reflect atorvastatin being a substrate for organic anion transporting polypeptide (OATP) 2B1 (Km, 0.2 µM) (Kalliokoski and Niemi, 2009), an uptake transporter expressed on the apical membrane of enterocytes and other cell types (Ito et al., 2005). GFJ has been shown to decrease systemic exposure to the OATP substrate fexofenadine via inhibition of intestinal OATP(s) (Dresser et al., 2002). Because inhibition of intestinal OATP(s) and CYP3A4 decrease and increase systemic drug exposure, respectively, these two processes acting in concert would be expected to reduce the AUCGFJ/AUC compared with CYP3A4 inhibition alone. Conversely, substrates of both CYP3A4 and the apically located efflux transporter, P-gp, would be expected to increase the AUCGFJ/AUC compared with CYP3A4 inhibition alone. The AUCGFJ/AUC of such dual CYP3A4/P-gp substrates (cyclosporine, methadone, quinidine, tacrolimus) were well predicted despite reports that DHB inhibits P-gp (Eagling et al., 1999). This observation suggests that the contribution of intestinal CYP3A4 inhibition supersedes that of intestinal P-gp inhibition when GFJ is coadministered with dual CYP3A4/P-gp substrates.
Unlike with atorvastatin, the interaction with simvastatin was underpredicted, by a factor of 2.4 (1.5 versus 3.6). Simvastatin was one of three drugs whose Fg was determined using an in vitro extrapolation technique, which may have overestimated Fg, resulting in the underprediction. The method used to derive simvastatin Fg (0.66) involved oral clinical pharmacokinetic and in vitro microsomal clearance data. This estimate was used in lieu of that obtained with the Qgut model (0.06) (Gertz et al., 2010), as the former was derived using some clinical data versus in vitro data alone. The Fg from the Qgut model would have overpredicted simvastatin AUCGFJ/AUC by 9-fold. The disconnects between the two methods and between the observed and predicted AUCGFJ/AUC suggest that other unknown mechanisms/factors contribute to the GFJ-simvastatin interaction.
As with simvastatin, the interaction with triazolam was underpredicted, albeit modestly (1.5 versus 2.0), which may be due to racial and/or sex differences between subjects. The reference clinical study involved nine healthy Japanese men (Sugimoto et al., 2006), and the estimated Fg was derived from healthy Caucasians (10 men, 11 women) (Masica et al., 2004). In addition, the dose-normalized AUC in the absence of GFJ was lower in the Japanese study compared with that reported for American men (11 Caucasians, 2 African Americans) (Greenblatt et al., 2005). Taken together, the extent of intestinal extraction of triazolam may be greater (i.e., Fg may be lower) in Japanese than American men, which would explain the greater AUCGFJ/AUC in the Japanese cohort.
The aforementioned discrepancies highlight limitations of the IVIVE method used in the current work. First, the accuracy of the predicted AUCGFJ/AUC is dependent on an accurate victim drug Fg, as the model is sensitive to this parameter, particularly when less than 0.45 (Fig. 5). As such, robust methods of predicting Fg remain critical. Second, significant involvement of uptake transporters, including OATPs, in the disposition of the test drug would preclude use of this model, as constituents other than DHB, including the flavanone glycoside naringin, inhibit OATPs. Third, this approach cannot account for varying DHB concentration in GFJ, nor frequency of GFJ administration, as the relationship between juice DHB concentration and enterocyte DHB concentration is not yet understood. These complexities could be addressed using more advanced (dynamic) modeling. Despite these limitations, this IVIVE approach demonstrates DHB as a reasonable marker constituent to predict the interaction liability of GFJ with candidate CYP3A4 drug substrates. In addition, this straightforward approach, which could be implemented readily into work streams in drug discovery programs, could be applied to other dietary substance–drug interactions upon identification of a candidate marker constituent.
In summary, the importance of dietary substance–drug interaction risk assessment has been recognized, yet systematic guidelines have not been established. A framework to identify marker constituent(s) in dietary substances was applied in the current work using GFJ as an exemplar perpetrator, DHB as a candidate constituent, and loperamide as a test victim drug. A mechanistic static model of intestinal CYP3A4 MBI incorporating DHB kinetic parameters was sufficient to predict the GFJ-loperamide interaction, as well as 12 of 15 previously reported GFJ-drug interaction studies, to within 25%. This approach has limitations with victim drugs whose estimated Fg is inaccurate/uncertain and/or are substrates for intestinal OATPs or other uptake transporters. This IVIVE method is a relatively simple and cost-effective means to assess CYP3A4-mediated GFJ-drug interaction liability or to prioritize compounds for more advanced and resource-heavy assessment, such as dynamic modeling and/or clinical evaluation. In conclusion, this IVIVE method expands upon proposed frameworks to assess clinically relevant dietary substance–drug interactions, the results of which will help guide interaction risk assessment.
Acknowledgments
The authors thank their partners at Simcyp for the use of the software and for their technical support, and Dr. Arlene Bridges for assistance with the LC-MS/MS–based plasma quantification. M.F.P. dedicates this article to Dr. David P. Paine.
Abbreviations
- ADAM
Advanced Dissolution, Absorption, and Metabolism
- AUC
area under the plasma concentration–time curve
- AUC0-72h
AUC from time 0 to 72 hours
- AUC0-inf
AUC from time 0 to infinity
- AUEC0-72h
area under the effect-time curve from 0 to 72 hours
- CI
confidence interval
- Cl/F
oral clearance
- CTRC
Clinical and Translational Research Center
- DDI
drug-drug interaction
- DHB
6′,7′-dihydroxybergamottin
- DMSO
dimethylsulfoxide
- GFJ
grapefruit juice
- HIM
human intestinal microsome
- IVIVE
in vitro–in vivo extrapolation
- LC-MS/MS
liquid chromatography–tandem mass spectrometry
- MBI
mechanism-based inhibition
- OATP
organic anion transporting polypeptide
- P-gp
P-glycoprotein
- Rmax
maximum decrease in pupil diameter
Authorship Contributions
Participated in research design: Ainslie, Li, Connolly, Scarlett, Hull, Paine.
Conducted experiments: Ainslie, Li, Connolly, Scarlett.
Contributed new reagents or analytic tools: Ainslie, Wolf, Connolly.
Performed data analysis: Ainslie, Wolf, Li, Connolly.
Wrote or contributed to the writing of the manuscript: Ainslie, Wolf, Hull, Paine.
Footnotes
This work was supported by the National Institutes of Health National Institute of General Medical Sciences [Grant R01-GM077482]; and the National Institutes of Health National Center for Research Resources/National Center for Advancing Translational Sciences [Grant UL1-RR025747 (now UL1-R001111)]. G.R.A. was supported by the National Institutes of Health National Institute of Environmental Health Sciences Toxicology Training [Grant T32-ES007126].
References
- Bailey DG, Dresser G, Arnold JM. (2013) Grapefruit-medication interactions: forbidden fruit or avoidable consequences? CMAJ 185:309–316. [DOI] [PMC free article] [PubMed] [Google Scholar]
- Brunton LL, Chabner BA, Knollmann BC. (2010) Appendix II, in Goodman & Gilman's: The Pharmalogical Basis of Therapeutics (Brunton L. ed) McGraw Hill Medical, New York. [Google Scholar]
- Damkier P, Hansen LL, Brosen K. (1999) Effect of diclofenac, disulfiram, itraconazole, grapefruit juice and erythromycin on the pharmacokinetics of quinidine. Br J Clin Pharmacol 48:829–838. [DOI] [PMC free article] [PubMed] [Google Scholar]
- Daniulaityte R, Carlson R, Falck R, Cameron D, Perera S, Chen L, Sheth A. (2013) “I just wanted to tell you that loperamide WILL WORK”: a web-based study of extra-medical use of loperamide. Drug Alcohol Depend 130:241–244. [DOI] [PMC free article] [PubMed] [Google Scholar]
- Darbar D, Dell’Orto S, Mörike K, Wilkinson GR, Roden DM. (1997) Dietary salt increases first-pass elimination of oral quinidine. Clin Pharmacol Ther 61:292–300. [DOI] [PubMed] [Google Scholar]
- De Castro WV, Mertens-Talcott S, Rubner A, Butterweck V, Derendorf H. (2006) Variation of flavonoids and furanocoumarins in grapefruit juices: a potential source of variability in grapefruit juice-drug interaction studies. J Agric Food Chem 54:249–255. [DOI] [PubMed] [Google Scholar]
- Dresser GK, Bailey DG, Leake BF, Schwarz UI, Dawson PA, Freeman DJ, Kim RB. (2002) Fruit juices inhibit organic anion transporting polypeptide-mediated drug uptake to decrease the oral availability of fexofenadine. Clin Pharmacol Ther 71:11–20. [DOI] [PubMed] [Google Scholar]
- Ducharme MP, Warbasse LH, Edwards DJ. (1995) Disposition of intravenous and oral cyclosporine after administration with grapefruit juice. Clin Pharmacol Ther 57:485–491. [DOI] [PubMed] [Google Scholar]
- Eagling VA, Profit L, Back DJ. (1999) Inhibition of the CYP3A4-mediated metabolism and P-glycoprotein-mediated transport of the HIV-1 protease inhibitor saquinavir by grapefruit juice components. Br J Clin Pharmacol 48:543–552. [DOI] [PMC free article] [PubMed] [Google Scholar]
- Floren LC, Bekersky I, Benet LZ, Mekki Q, Dressler D, Lee JW, Roberts JP, Hebert MF. (1997) Tacrolimus oral bioavailability doubles with coadministration of ketoconazole. Clin Pharmacol Ther 62:41–49. [DOI] [PubMed] [Google Scholar]
- Fujioka Y, Kunze KL, Isoherranen N. (2012) Risk assessment of mechanism-based inactivation in drug-drug interactions. Drug Metab Dispos 40:1653–1657. [DOI] [PMC free article] [PubMed] [Google Scholar]
- Galetin A, Gertz M, Houston JB. (2010) Contribution of intestinal cytochrome p450-mediated metabolism to drug-drug inhibition and induction interactions. Drug Metab Pharmacokinet 25:28–47. [DOI] [PubMed] [Google Scholar]
- Gertz M, Davis JD, Harrison A, Houston JB, Galetin A. (2008) Grapefruit juice-drug interaction studies as a method to assess the extent of intestinal availability: utility and limitations. Curr Drug Metab 9:785–795. [DOI] [PubMed] [Google Scholar]
- Gertz M, Harrison A, Houston JB, Galetin A. (2010) Prediction of human intestinal first-pass metabolism of 25 CYP3A substrates from in vitro clearance and permeability data. Drug Metab Dispos 38:1147–1158. [DOI] [PubMed] [Google Scholar]
- Goosen TC, Cillie D, Bailey DG, Yu C, He K, Hollenberg PF, Woster PM, Cohen L, Williams JA, Rheeders M, et al. (2004) Bergamottin contribution to the grapefruit juice-felodipine interaction and disposition in humans. Clin Pharmacol Ther 76:607–617. [DOI] [PubMed] [Google Scholar]
- Greenblatt DJ, Gan L, Harmatz JS, Shader RI. (2005) Pharmocokinetics and pharmacodynamics of single-dose triazolam: electroencephalography compared with the Digit-Symbol Substitution Test. Br J Clin Pharmacol 60:244–248. [DOI] [PMC free article] [PubMed] [Google Scholar]
- Hanley MJ, Masse G, Harmatz JS, Court MH, Greenblatt DJ. (2012) Pomegranate juice and pomegranate extract do not impair oral clearance of flurbiprofen in human volunteers: divergence from in vitro results. Clin Pharmacol Ther 92:651–657. [DOI] [PMC free article] [PubMed] [Google Scholar]
- Hirota N, Ito K, Iwatsubo T, Green CE, Tyson CA, Shimada N, Suzuki H, Sugiyama Y. (2001) In vitro/in vivo scaling of alprazolam metabolism by CYP3A4 and CYP3A5 in humans. Biopharm Drug Dispos 22:53–71. [DOI] [PubMed] [Google Scholar]
- Holtbecker N, Fromm MF, Kroemer HK, Ohnhaus EE, Heidemann H. (1996) The nifedipine-rifampin interaction. Evidence for induction of gut wall metabolism. Drug Metab Dispos 24:1121–1123. [PubMed] [Google Scholar]
- Ito K, Suzuki H, Horie T, Sugiyama Y. (2005) Apical/basolateral surface expression of drug transporters and its role in vectorial drug transport. Pharm Res 22:1559–1577. [DOI] [PubMed] [Google Scholar]
- Jamei M, Turner D, Yang J, Neuhoff S, Polak S, Rostami-Hodjegan A, Tucker G. (2009) Population-based mechanistic prediction of oral drug absorption. AAPS J 11:225–237. [DOI] [PMC free article] [PubMed] [Google Scholar]
- Jetter A, Kinzig-Schippers M, Walchner-Bonjean M, Hering U, Bulitta J, Schreiner P, Sörgel F, Fuhr U. (2002) Effects of grapefruit juice on the pharmacokinetics of sildenafil. Clin Pharmacol Ther 71:21–29. [DOI] [PubMed] [Google Scholar]
- Kalliokoski A, Niemi M. (2009) Impact of OATP transporters on pharmacokinetics. Br J Pharmacol 158:693–705. [DOI] [PMC free article] [PubMed] [Google Scholar]
- Kharasch ED, Bedynek PS, Walker A, Whittington D, Hoffer C. (2008) Mechanism of ritonavir changes in methadone pharmacokinetics and pharmacodynamics: II. Ritonavir effects on CYP3A and P-glycoprotein activities. Clin Pharmacol Ther 84:506–512. [DOI] [PMC free article] [PubMed] [Google Scholar]
- Kharasch ED, Hoffer C, Whittington D, Sheffels P. (2004a) Role of hepatic and intestinal cytochrome P450 3A and 2B6 in the metabolism, disposition, and miotic effects of methadone. Clin Pharmacol Ther 76:250–269. [DOI] [PubMed] [Google Scholar]
- Kharasch ED, Walker A, Hoffer C, Sheffels P. (2004b) Intravenous and oral alfentanil as in vivo probes for hepatic and first-pass cytochrome P450 3A activity: noninvasive assessment by use of pupillary miosis. Clin Pharmacol Ther 76:452–466. [DOI] [PubMed] [Google Scholar]
- Kim KA, Chung J, Jung DH, Park JY. (2004) Identification of cytochrome P450 isoforms involved in the metabolism of loperamide in human liver microsomes. Eur J Clin Pharmacol 60:575–581. [DOI] [PubMed] [Google Scholar]
- Lennernäs H. (2003) Clinical pharmacokinetics of atorvastatin. Clin Pharmacokinet 42:1141–1160. [DOI] [PubMed] [Google Scholar]
- Lilja JJ, Kivistö KT, Backman JT, Lamberg TS, Neuvonen PJ. (1998) Grapefruit juice substantially increases plasma concentrations of buspirone. Clin Pharmacol Ther 64:655–660. [DOI] [PubMed] [Google Scholar]
- Lilja JJ, Neuvonen M, Neuvonen PJ. (2004) Effects of regular consumption of grapefruit juice on the pharmacokinetics of simvastatin. Br J Clin Pharmacol 58:56–60. [DOI] [PMC free article] [PubMed] [Google Scholar]
- Liu C, Shang YF, Zhang XF, Zhang XG, Wang B, Wu Z, Liu XM, Yu L, Ma F, Lv Y. (2009) Co-administration of grapefruit juice increases bioavailability of tacrolimus in liver transplant patients: a prospective study. Eur J Clin Pharmacol 65:881–885. [DOI] [PubMed] [Google Scholar]
- Lown KS, Bailey DG, Fontana RJ, Janardan SK, Adair CH, Fortlage LA, Brown MB, Guo W, Watkins PB. (1997) Grapefruit juice increases felodipine oral availability in humans by decreasing intestinal CYP3A protein expression. J Clin Invest 99:2545–2553. [DOI] [PMC free article] [PubMed] [Google Scholar]
- Lundahl J, Regårdh CG, Edgar B, Johnsson G. (1997) Effects of grapefruit juice ingestion—pharmacokinetics and haemodynamics of intravenously and orally administered felodipine in healthy men. Eur J Clin Pharmacol 52:139–145. [DOI] [PubMed] [Google Scholar]
- Masica AL, Mayo G, Wilkinson GR. (2004) In vivo comparisons of constitutive cytochrome P450 3A activity assessed by alprazolam, triazolam, and midazolam. Clin Pharmacol Ther 76:341–349. [DOI] [PubMed] [Google Scholar]
- Mukwaya G, MacGregor T, Hoelscher D, Heming T, Legg D, Kavanaugh K, Johnson P, Sabo JP, McCallister S. (2005) Interaction of ritonavir-boosted tipranavir with loperamide does not result in loperamide-associated neurologic side effects in healthy volunteers. Antimicrob Agents Chemother 49:4903–4910. [DOI] [PMC free article] [PubMed] [Google Scholar]
- National Center for Complementary and Alternative Medicine (2013) Dietary Supplement-Drug Interaction Expert Panel Meeting; 2013 Dec 4; Bethesda, MD.
- Niemi M, Tornio A, Pasanen MK, Fredrikson H, Neuvonen PJ, Backman JT. (2006) Itraconazole, gemfibrozil and their combination markedly raise the plasma concentrations of loperamide. Eur J Clin Pharmacol 62:463–472. [DOI] [PubMed] [Google Scholar]
- Obach RS, Walsky RL, Venkatakrishnan K. (2007) Mechanism-based inactivation of human cytochrome p450 enzymes and the prediction of drug-drug interactions. Drug Metab Dispos 35:246–255. [DOI] [PubMed] [Google Scholar]
- Obach RS, Walsky RL, Venkatakrishnan K, Houston JB, Tremaine LM. (2005) In vitro cytochrome P450 inhibition data and the prediction of drug-drug interactions: qualitative relationships, quantitative predictions, and the rank-order approach. Clin Pharmacol Ther 78:582–592. [DOI] [PubMed] [Google Scholar]
- Obach RS, Walsky RL, Venkatakrishnan K, Gaman EA, Houston JB, Tremaine LM. (2006) The utility of in vitro cytochrome P450 inhibition data in the prediction of drug-drug interactions. J Pharmacol Exp Ther 316:336–348. [DOI] [PubMed] [Google Scholar]
- Odou P, Ferrari N, Barthélémy C, Brique S, Lhermitte M, Vincent A, Libersa C, Robert H. (2005) Grapefruit juice-nifedipine interaction: possible involvement of several mechanisms. J Clin Pharm Ther 30:153–158. [DOI] [PubMed] [Google Scholar]
- Paine MF, Criss AB, Watkins PB. (2004) Two major grapefruit juice components differ in intestinal CYP3A4 inhibition kinetic and binding properties. Drug Metab Dispos 32:1146–1153. [DOI] [PubMed] [Google Scholar]
- Paine MF, Criss AB, Watkins PB. (2005) Two major grapefruit juice components differ in time to onset of intestinal CYP3A4 inhibition. J Pharmacol Exp Ther 312:1151–1160. [DOI] [PubMed] [Google Scholar]
- Paine MF, Hart HL, Ludington SS, Haining RL, Rettie AE, Zeldin DC. (2006b) The human intestinal cytochrome P450 “pie”. Drug Metab Dispos 34:880–886. [DOI] [PMC free article] [PubMed] [Google Scholar]
- Paine MF, Shen DD, Kunze KL, Perkins JD, Marsh CL, McVicar JP, Barr DM, Gillies BS, Thummel KE. (1996) First-pass metabolism of midazolam by the human intestine. Clin Pharmacol Ther 60:14–24. [DOI] [PubMed] [Google Scholar]
- Paine MF, Widmer WW, Hart HL, Pusek SN, Beavers KL, Criss AB, Brown SS, Thomas BF, Watkins PB. (2006a) A furanocoumarin-free grapefruit juice establishes furanocoumarins as the mediators of the grapefruit juice-felodipine interaction. Am J Clin Nutr 83:1097–1105. [DOI] [PubMed] [Google Scholar]
- Paine MF, Widmer WW, Pusek SN, Beavers KL, Criss AB, Snyder J, Watkins PB. (2008) Further characterization of a furanocoumarin-free grapefruit juice on drug disposition: studies with cyclosporine. Am J Clin Nutr 87:863–871. [DOI] [PubMed] [Google Scholar]
- Reddy P, Ellington D, Zhu Y, Zdrojewski I, Parent SJ, Harmatz JS, Derendorf H, Greenblatt DJ, Browne K., Jr (2011) Serum concentrations and clinical effects of atorvastatin in patients taking grapefruit juice daily. Br J Clin Pharmacol 72:434–441. [DOI] [PMC free article] [PubMed] [Google Scholar]
- Schwarz UI, Johnston PE, Bailey DG, Kim RB, Mayo G, Milstone A. (2006) Impact of citrus soft drinks relative to grapefruit juice on ciclosporin disposition. Br J Clin Pharmacol 62:485–491. [DOI] [PMC free article] [PubMed] [Google Scholar]
- Skarke C, Jarrar M, Schmidt H, Kauert G, Langer M, Geisslinger G, Lötsch J. (2003) Effects of ABCB1 (multidrug resistance transporter) gene mutations on disposition and central nervous effects of loperamide in healthy volunteers. Pharmacogenetics 13:651–660. [DOI] [PubMed] [Google Scholar]
- Sklerov J, Levine B, Moore KA, Allan C, Fowler D. (2005) Tissue distribution of loperamide and N-desmethylloperamide following a fatal overdose. J Anal Toxicol 29:750–754. [DOI] [PubMed] [Google Scholar]
- Streel B, Ceccato A, Klinkenberg R, Hubert P. (2005) Validation of a liquid chromatographic-tandem mass spectrometric method for the determination of loperamide in human plasma. J Chromatogr B Analyt Technol Biomed Life Sci 814:263–273. [DOI] [PubMed] [Google Scholar]
- Sugimoto K, Araki N, Ohmori M, Harada K, Cui Y, Tsuruoka S, Kawaguchi A, Fujimura A. (2006) Interaction between grapefruit juice and hypnotic drugs: comparison of triazolam and quazepam. Eur J Clin Pharmacol 62:209–215. [DOI] [PubMed] [Google Scholar]
- Takanaga H, Ohnishi A, Murakami H, Matsuo H, Higuchi S, Urae A, Irie S, Furuie H, Matsukuma K, Kimura M, et al. (2000) Relationship between time after intake of grapefruit juice and the effect on pharmacokinetics and pharmacodynamics of nisoldipine in healthy subjects. Clin Pharmacol Ther 67:201–214. [DOI] [PubMed] [Google Scholar]
- Tran TT, Mittal A, Gales T, Maleeff B, Aldinger T, Polli JW, Ayrton A, Ellens H, Bentz J. (2004) Exact kinetic analysis of passive transport across a polarized confluent MDCK cell monolayer modeled as a single barrier. J Pharm Sci 93:2108–2123. [DOI] [PubMed] [Google Scholar]
- US Food and Drug Administration (2013) Draft Guidance: Bioanalytical Method Validation, US Food and Drug Administration, Rockville, MD. [Google Scholar]
- Vieira ML, Kirby B, Ragueneau-Majlessi I, Galetin A, Chien JY, Einolf HJ, Fahmi OA, Fischer V, Fretland A, Grime K, et al. (2014) Evaluation of various static in vitro-in vivo extrapolation models for risk assessment of the CYP3A inhibition potential of an investigational drug. Clin Pharmacol Ther 95:189–198. [DOI] [PubMed] [Google Scholar]
- Won CS, Oberlies NH, Paine MF. (2012) Mechanisms underlying food-drug interactions: inhibition of intestinal metabolism and transport. Pharmacol Ther 136:186–201. [DOI] [PMC free article] [PubMed] [Google Scholar]
- Yang J, Jamei M, Yeo KR, Tucker GT, Rostami-Hodjegan A. (2007) Prediction of intestinal first-pass drug metabolism. Curr Drug Metab 8:676–684. [DOI] [PubMed] [Google Scholar]
- Yasui N, Kondo T, Furukori H, Kaneko S, Ohkubo T, Uno T, Osanai T, Sugawara K, Otani K. (2000) Effects of repeated ingestion of grapefruit juice on the single and multiple oral-dose pharmacokinetics and pharmacodynamics of alprazolam. Psychopharmacology (Berl) 150:185–190. [DOI] [PubMed] [Google Scholar]