Abstract
Catecholaminergic polymorphic ventricular tachycardia (CPVT) causes sudden cardiac death due to mutations in cardiac ryanodine receptors (RyR2), calsequestrin, or calmodulin. Flecainide, a class I antiarrhythmic drug, inhibits Na+ and RyR2 channels and prevents CPVT. The purpose of this study is to identify inhibitory mechanisms of flecainide on RyR2. RyR2 were isolated from sheep heart, incorporated into lipid bilayers, and investigated by single-channel recording under various activating conditions, including the presence of cytoplasmic ATP (2 mM) and a range of cytoplasmic [Ca2+], [Mg2+], pH, and [caffeine]. Flecainide applied to either the cytoplasmic or luminal sides of the membrane inhibited RyR2 by two distinct modes: 1) a fast block consisting of brief substate and closed events with a mean duration of ∼1 ms, and 2) a slow block consisting of closed events with a mean duration of ∼1 second. Both inhibition modes were alleviated by increasing cytoplasmic pH from 7.4 to 9.5 but were unaffected by luminal pH. The slow block was potentiated in RyR2 channels that had relatively low open probability, whereas the fast block was unaffected by RyR2 activation. These results show that these two modes are independent mechanisms for RyR2 inhibition, both having a cytoplasmic site of action. The slow mode is a closed-channel block, whereas the fast mode blocks RyR2 in the open state. At diastolic cytoplasmic [Ca2+] (100 nM), flecainide possesses an additional inhibitory mechanism that reduces RyR2 burst duration. Hence, multiple modes of action underlie RyR2 inhibition by flecainide.
Introduction
In cardiac excitation-contraction coupling, the action potential depolarizes the L-type Ca2+ channel leading to Ca2+ release from the sarcoplasmic reticulum (SR) via ryanodine receptor 2 (RyR2) Ca2+ release channels located on the SR membrane (Nabauer et al., 1989). Following Ca2+ release, Ca2+ is sequestered into the SR via the SR Ca2+ ATPase or extruded from the cell by the Na/Ca exchanger (Dibb et al., 2007). The role of SR Ca2+ uptake and release (Ca2+ cycling) in maintaining the cardiac rhythm is highlighted by the arrhythmias associated with Ca2+ store overload. One such arrhythmia linked to the SR overload is catecholaminergic polymorphic ventricular tachycardia (CPVT) (Blayney and Lai, 2009). Mutations in RyR2 (Priori et al., 2001; George et al., 2003), calsequestrin (CASQ2) (Postma et al., 2002), or calmodulin (Nyegaard et al., 2012) can cause CPVT. These mutations increase RyR2 leak, causing spontaneous Ca2+ release due to excessive diastolic Ca2+ release. This activates the Na/Ca exchanger in the plasmalemma that produces the inward depolarizing current underlying the delayed after depolarizations leading to arrhythmias (Knollmann et al., 2006; Liu et al., 2006).
Flecainide is an orally administered, potent, antiarrhythmic agent that blocks cardiac sodium channels (Nav1.5) in a time- and voltage-dependent manner to reduce the maximum upstroke velocity of the action potential (Borchard and Boisten, 1982; Campbell and Vaughan Williams, 1983; Kojima et al., 1989). The kinetics of flecainide block of Nav1.5 have been extensively studied (Anno and Hondeghem, 1990; Nitta et al., 1992; Grant et al., 2000; Nagatomo et al., 2000; Liu et al., 2002;). It has a relatively high affinity for Nav1.5 channels in their open and inactivated states (Grant et al., 2000; Liu et al., 2002) compared with their closed state. The recent discoveries that flecainide also blocked RyR2 channels, suppressed Ca2+ waves in CASQ2−/− cardiomyocytes, and prevented CPVT in mice and humans (Watanabe et al., 2009) suggest that RyR2 block may contribute to antiarrhythmic drug efficacy against Ca2+-triggered arrhythmias. This was demonstrated again more recently by the use of RyR2 block by carvedilol and its derivatives, which prevented stress-induced ventricular tachyarrhythmias in RyR2-mutant mice (Zhou et al., 2011). However, previous attempts to use RyR2 inhibitors to reverse effects of RyR2 mutations have not been successful in preventing arrhythmia (reviewed by McCauley and Wehrens, 2011; Watanabe and Knollmann, 2011). For example, the dual Na+ and RyR2 antagonist tetracaine did not suppress the Ca2+ waves in CASQ2−/− myocytes upon prolonged exposure (Watanabe et al., 2009; Hilliard et al., 2010). Thus, it appears that it is not RyR2 block per se that is important in preventing Ca2+ overload arrhythmias. Therefore, there is a need to understand mechanisms for pharmacological inhibition of RyR2 by flecainide. Although the flecainide dose-response for RyR2 inhibition has been measured (Watanabe et al., 2009), no detailed study has been done to examine the action of this drug on the channel and how it depends on the RyR2 activation state.
Here, we use single-channel recording of RyR2 from sheep to develop a model for flecainide inhibition, which will provide an understanding of the action of the drug in cardiac muscle. The work reported here extends a previous finding that flecainide is an open-channel blocker (Hilliard et al., 2010). We now identify multiple flecainide inhibitory mechanisms that contribute to flecainide block of RyR2.
Materials and Methods
Single-Channel Measurements.
SR vesicles containing RyR2 were isolated from sheep hearts and incorporated in artificial bilayer membranes as previously described (Laver et al., 1995). In brief, lipid bilayers were formed across the aperture of a delrin cup with a diameter of 150–250 mm using a lipid mixture of phosphatidylethanolamine and phosphatidylcholine (8:2 w/w; Avanti Polar Lipids, Alabaster, AL) in n-decane (50 mg/ml; ICN Biomedicals, Irvine, CA). During the SR vesicle fusion period, the cis (cytoplasmic) chamber contained 250 mM Cs+ (230 mM CsCH3O3S, 20 mM CsCl) + 1.0 mM CaCl2, and the trans (luminal) chamber contained 50 mM Cs+ (30 mM CsCH3O3S, 20 mM CsCl) + 0.1 mM CaCl2. When ion channels were detected in the bilayer, the trans Cs+ was raised to 250 mM by aliquot addition of 4 M CsCH3O3S. During experiments, the composition of the cis solution was altered by a perfusion system, and the trans solution was altered by aliquot additions. The local perfusion (O'Neill et al., 2003) allowed exposure of single RyR2 to multiple drug concentrations applied in random sequence within ∼3 seconds.
Chemicals.
All solutions were pH buffered using 10 mM TES (N-tris[hydroxymethyl]methyl-2-aminoethanesulfonic acid) and titrated to pH 7.4 using CsOH (ICN Biomedicals). A Ca2+ electrode (Radiometer, Westlake, OH) was used in our experiments to determine the purity of Ca2+ buffers and Ca2+ stock solutions as well as free [Ca2+] >100 nM. Free Ca2+ was titrated with CaCl2 and buffered using 4.5 mM BAPTA [1,2-bis(o-aminophenoxy)ethane-N,N,N′,N′-tetraacetic acid; obtained from Invitrogen (Carlsbad, CA); free [Ca2+] <1 μM] or dibromo-BAPTA (up to 2 mM; free [Ca2+] between 1 and 10 μM). Because all solutions applied in cis bath contained ATP (ATP chelates Ca2+ and Mg2+), free levels of Mg2+ (added as MgCl2) were calculated using estimates of ATP purity and effective Mg2+ binding constants that were determined previously under our experimental conditions (Laver et al., 2004). The cesium salts were obtained from Sigma-Aldrich (St. Louis, MO). CaCl2 and MgCl2 were obtained from BDH Chemicals/VWR (Radnor, PA). Caffeine and flecainide were obtained from Sigma-Aldrich and were prepared as stock solutions in Milli-Q water (EMD Millipore, Billerica, MA).
Data Acquisition and Analysis.
Experiments were carried out at room temperature (23 ± 2°C). Electric potentials were expressed using standard physiologic convention (i.e., cytoplasm relative to SR lumen at virtual ground). Control of the bilayer potential and recording of unitary currents was done using either an Axopatch 200B amplifier (Axon Instruments/Molecular Devices, Sunnyvale, CA) or a Bilayer Clamp-525C (Warner Instruments, Hamden, CT). Channel currents were digitized at 50 kHz and low-pass filtered at 5 kHz. Before analysis, the current signal was redigitized at 5–10 kHz and low-pass filtered at 1–3 kHz. Single-channel parameters, open probability, mean open time, and mean closed time were measured using a threshold discriminator at 50% of channel amplitude (Channel2 software by P. W. Gage and M. Smith, Australian National University, Canberra, Australia). Channel substate analysis was carried out using the hidden Markov model (Chung et al., 1990). The algorithm calculated the idealized, multilevel, current time course (i.e., background noise subtracted), and the transition probability matrix from the raw signal using maximum likelihood criteria.
Individual readings of open probability, mean open time, and closed times were derived from 30–60 seconds of RyR2 recording. Dwell-time histograms were compiled from 103–104 opening events. Hill equations were fitted to the dose-response data by the method of least squares. Average data are given as the mean ± S.E.M. The significance multigroup comparisons are made using analysis of variance (P < 0.01). The significance of the difference between pairs of control and test values was tested using Student’s t test (*P < 0.05 and **P < 0.01).
Results
General Observations.
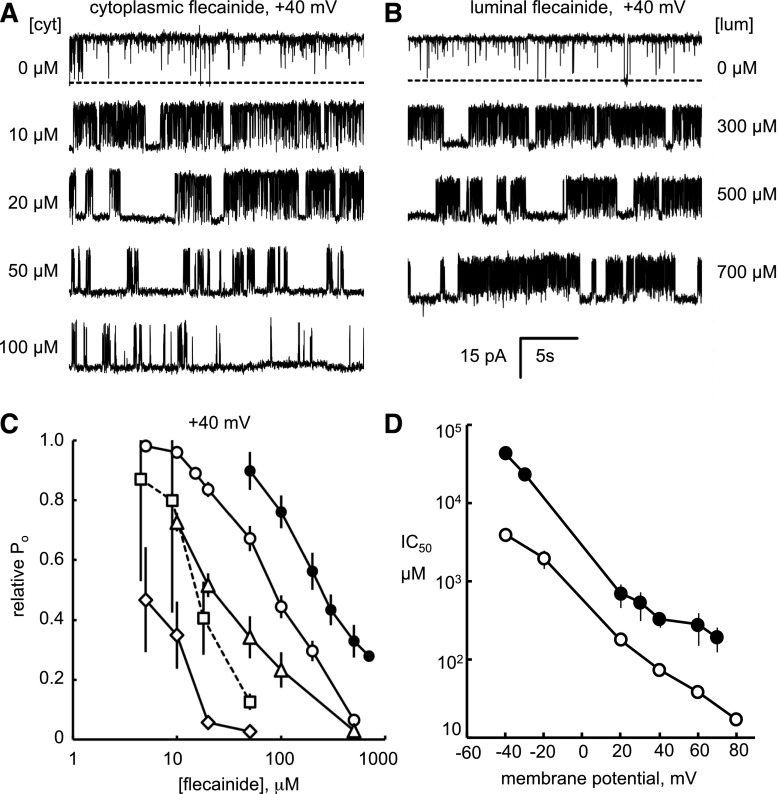
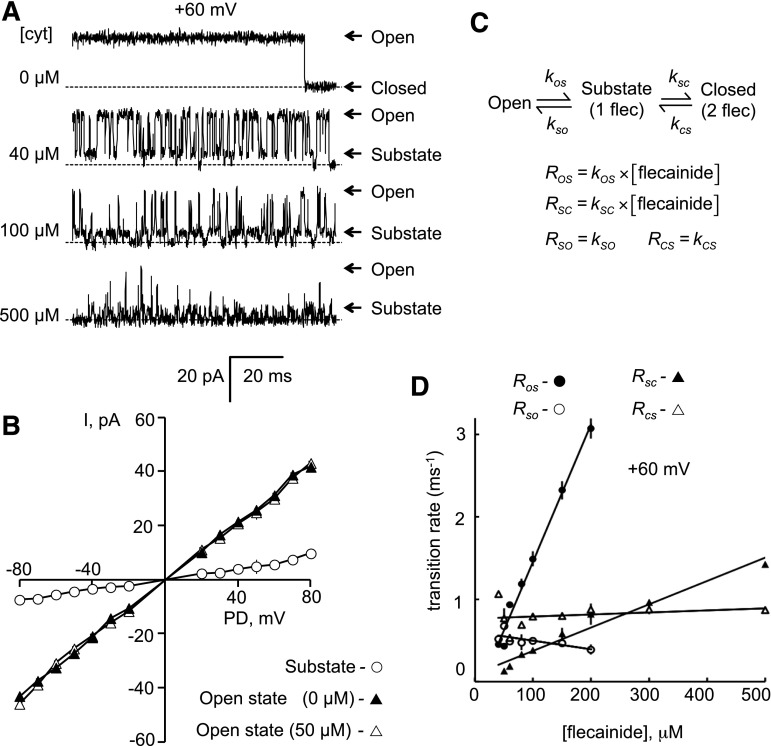
RyR2 were nearly maximally activated (open probability, Po = 0.98 ± 0.02) by cytoplasmic Ca2+ (100 μM) in the presence of 2 mM ATP. Addition of flecainide to the cytoplasmic bath (membrane potential + 40 mV) induced two modes of RyR2 inhibition that were associated with channel closures on the millisecond and second timescales (fast and slow modes, respectively; Fig. 1A). The millisecond events represent transitions to a substate that are analyzed in detail later (Figs. 7 and 8). Our initial threshold analysis of channel gating lumped the substates together with complete channel closures.
Fig. 1.
Flecainide inhibition of RyR2 open probability under various experimental conditions. Representative single-channel recordings of sheep RyR2 at +40 mV showing inhibition by flecainide in the cytoplasmic (A) and luminal (B) bath ([flecainide] at the end of each trace). The cytoplasmic bath contained 2 mM ATP; free Ca2+ = 0.1 mM and free Mg2+ = 1 mM. The luminal bath contained 0.1 mM Ca2+. Channel openings appear as upward current jumps from the baseline (top traces, the channel closed state indicated by dashed line). (C) [Flecainide] dependencies of RyR2 open probability (Po) relative to that in the absence of flecainide (experimental conditions, legend, and n values given in Table 1). (D) The voltage dependence of IC50 for cytoplasmic and luminal flecainide inhibition (symbols in Table 1).
Fig. 7.
Substate analysis of fast-mode block of RyR2. (A) Representative single-channel recordings of RyR2 at +60 mV. The cytoplasmic (cyt) bath contained 2 mM ATP and 1 mM CaCl2 (free Ca2+ = 0.45 mM), and luminal bath contained 0.1 mM Ca2+. Addition of flecainide (cytoplasmic concentrations at the left of each trace) resulted in more frequent channel closures and appearance of substates at ∼25% of the maximum conductance. (B) Current-voltage relationships for maximum and substates in the presence of 50 µM flecainide (n = 8–16). (C) Model for fast-mode block. According to this model, the on rates, ROS and RSC, are proportional to [flecainide], and the off rates, RSO and RCS, are independent of [flecainide]. (D) The on rates are proportional to [flecainide] and the off rates are independent of [flecainide]. Transition rates were derived from hidden Markov model analysis (n = 3). Symbols show the mean ± S.E.M.
Fig. 8.
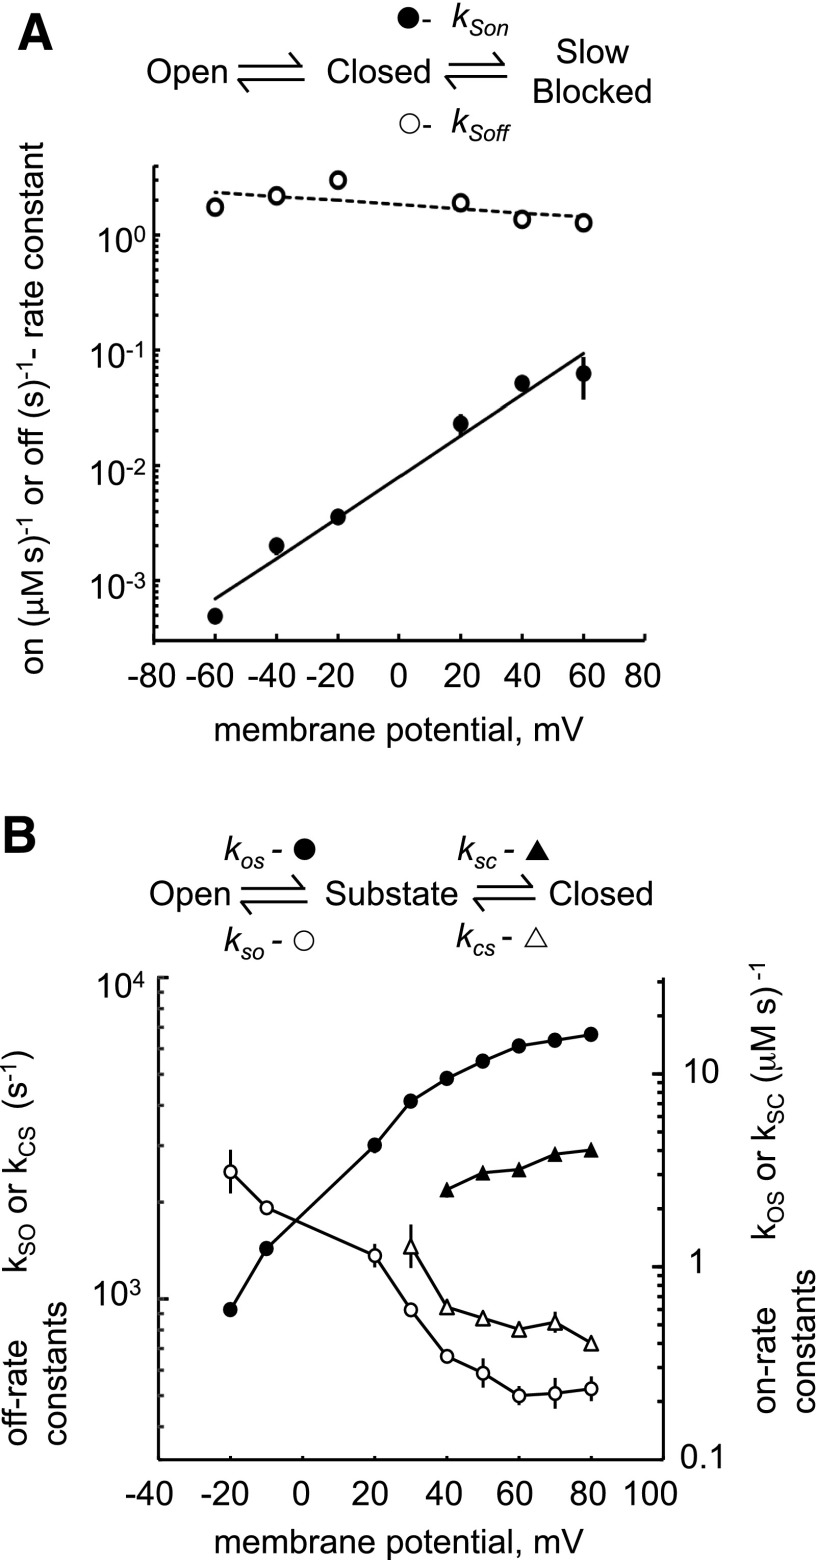
Voltage dependencies of rate constants for slow (A) and fast (B) modes of block. (A) Slow-mode rate constants were calculated as described in Fig. 5A (n = 5–10). (B) Fast-mode rate constants were calculated as described in Fig. 7C (n = 3–5). Where no error bars are visible, they are contained within the symbol.
Flecainide exhibited similar inhibiting kinetics when applied to the luminal side of the bilayer, albeit with a higher IC50 (Fig. 1, B and C, cf. ○ cytosolic and ● luminal). The IC50 for flecainide was strongly dependent on the ionic conditions (Fig. 1C; Table 1). Reducing the cytosolic ionic strength from 250 to 150 mM caused a 5-fold decrease in the IC50 (Fig. 1C, cf. △ and ◇), decreasing cytosolic free [Ca2+] from 100 μM to 100 nM also caused a 5-fold decrease (cf. ○ and ⬜), and adding 1 mM free Mg2+ to the cytosol caused a 3-fold decrease in the IC50 (cf. ○ and △). The flecainide IC50 values were also strongly dependent on membrane potential (Fig. 1D). IC50 for cytoplasmic and luminal applications of flecainide had similar slopes on logarithmic plots of IC50 versus bilayer voltage, decreasing by factors of 3.2 ± 0.2 (cytoplasmic; ○) and 3.6 ± 0.5 (luminal; ●) for each 25-mV depolarization. The Hill coefficients derived from fitting the data ranged from 0.6 to 2 (Table 1). The higher-than-unity values for some of the Hill coefficients indicate a multiple binding site mechanism for flecainide inhibition.
TABLE 1.
Flecainide concentrations for half inhibition of RyR2 (IC50), Hill coefficients (H), open probability in the absence of flecainide (Po max), and numbers of experiments (n) under various experimental conditions obtained from the dose-response curves in Fig. 1C. In each case, the luminal solution contained 250 mM Cs+, 100 μM Ca2+, and no Mg2+.
| Symbol(Fig. 1, C and D) | Side ofFlecainide Addition | Cytoplasmic Ion Concentrations |
IC50 | H | Po max | n | ||
|---|---|---|---|---|---|---|---|---|
| Cs+ | Ca2+ | Mg2+ | ||||||
| mM | μM | mM | μM | |||||
| ○ | cis | 250 | 100 | 0 | 87 ± 6 | 1.2 ± 0.2 | 0.97 ± 0.02 | 6 |
| ● | trans | 250 | 100 | 0 | 250 ± 50 | 0.6 ± 0.2 | 0.91 ± 0.02 | 3 |
| △ | cis | 250 | 100 | 1 | 25 ± 4 | 1.0 ± 0.3 | 0.75 ± 0.06 | 5 |
| ◇ | cis | 150 | 100 | 1 | 5.0 ± 1.0 | 1.4 ± 0.8 | 0.37 ± 0.10 | 4 |
| ⬜ | cis | 250 | 0.1 | 0 | 17 ± 2 | 2.0 ± 1.0 | 0.055 ± 0.038 | 8 |
Fast and Slow Modes of Flecainide Block at Systolic [Ca2+].
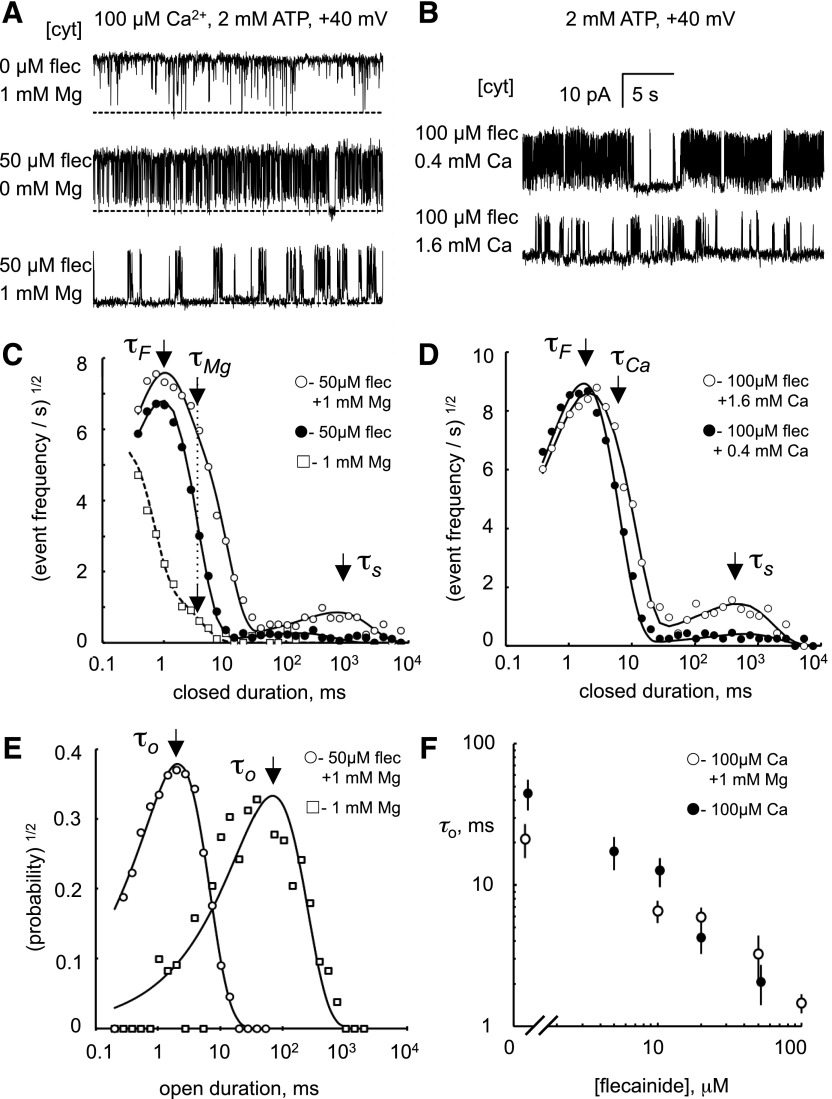
Since the potency of flecainide depended on the ionic conditions, we aimed to determine if this was a property of one or both modes of block. During Ca2+ release during systole, the [Ca2+] in the dyad cleft reaches 100 μM (Cannell and Soeller, 1997). In the presence of 100 μM cytoplasmic Ca2+ (2 mM ATP), addition of 50 μM flecainide to the cytosol induced fast inhibition with very few long closures (i.e., minimal slow block; Fig. 2A, middle trace), whereas long closures became much more apparent when 50 μM flecainide and 1 mM Mg2+ were added to the cytoplasmic bath (Fig. 2A, bottom trace). Mg2+ did not induce these long closures in the absence of flecainide (Fig. 2A, top trace). Addition of very high [Ca2+] (i.e., 0.4 and 1.6 mM) to the cytoplasmic bath in the absence of Mg2+ also increased the frequency of long channel closures (Fig. 2B). Thus, it appears that the potency of the slow mode of flecainide block is highly sensitive to the presence of divalent cations on the cytoplasmic side of the channel.
Fig. 2.
Fast and slow modes of flecainide block in systolic [Ca2+] and [Mg2+]. (A and B) Representative single-channel recordings of RyR2 at +40 mV showing inhibition by cytoplasmic flecainide (flec) in the presence of various cytoplasmic [Mg2+] and [Ca2+] (concentrations at the left of each trace). Channel openings appear as upward current jumps from the baseline. (C and D) Closed dwell-time histograms showing the rate of closed events based on the method of Sigworth and Sine (1987) as described in the text. Histograms were compiled from 60-second recordings from which the traces in (A) and (B) were taken. The data (○) are fitted with three exponential decays with time constants τF, τS, and τMg/Ca, the latter arising from closures associated with Mg2+/Ca2+ inhibition of RyR2. τF and τS appear as peaks in these plots indicated by the arrows. τMg/Ca is poorly resolved and appears as a shoulder near τF. (●) is fitted with two exponential decays with time constants τF and τS, where the latter is a relatively small peak. (E) Corresponding open dwell-time histograms for the top and bottom traces in (A). (F) Dependencies of mean open time, τo, on flecainide concentration (n = 3–9).
These effects of divalent ionic conditions on the kinetics of flecainide block were quantified by compiling frequency histograms of open and closed times from single-channel recordings (Fig. 2, C–E). Histograms were displayed using the log-bin method of Sigworth and Sine (1987), where individual exponential components appear as separate peaks centered on their time constant value. In these plots, the probability/frequency values are represented by their square roots because this provides uniform statistical scatter over the full range of times. Closed dwell-time histograms are presented as frequency of occurrence, Fc(t), of closed durations (t) rather than their probability, Pc(t) [Fc(t) = Pc(t)/τo, where τo is the mean open time] to give a better indication of the total closing rates for each mode of block.
Open dwell-time probability histograms exhibited one or two exponential decays with an overall mean open duration of ∼100 ms in the absence of flecainide. Flecainide applied to either the cytoplasmic (Fig. 2E) or luminal solutions (Supplemental Fig. 1) shifted the probability distributions to shorter times. The mean open duration, τo, varied as the inverse of flecainide concentration, as shown in Fig. 2F.
RyR2 closed dwell-time frequency distributions exhibited two features in the absence of flecainide (with 1 mM cytoplasmic Mg2+): an exponential decay with a time constant of 3 ms, which is characteristic of Mg2+ inhibition (Fig. 2C, □; see arrow labeled τMg), plus the tail of a partially resolved peak with a submillisecond time constant. Addition of 50 μM cytoplasmic flecainide introduced two exponentials in the closed time distributions, with time constants of ∼1 ms (fast mode) and ∼1 second (slow mode), as seen in Fig. 2C (○, see arrows labeled τF and τS, associated with fast and slow modes, respectively). In the absence of Mg2+, (Fig. 2C, ●), the peak amplitude associated with the slow time constant was markedly reduced, whereas the peak associated with the fast time constant was relatively unaffected. A similar effect was seen when 500 μM flecainide was added to the luminal bath (Supplemental Fig. 1). Figure 2, B and D shows that increasing cytoplasmic Ca2+ in the millimolar range had a similar effect on flecainide inhibition as Mg2+. Thus, only the slow mode of flecainide block is sensitive to the divalent ionic conditions.
Fast and Slow Modes of Flecainide Block at Diastolic [Ca2+].
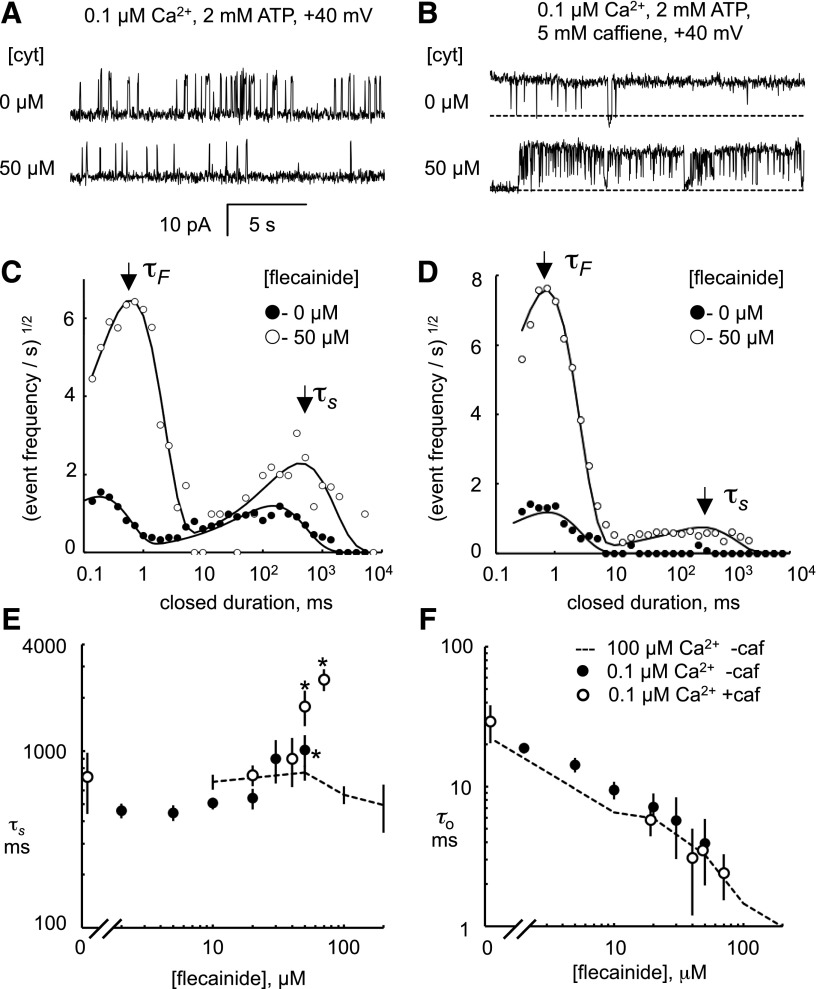
We also analyzed flecainide block at diastolic levels of cytoplasmic Ca2+ (0.1 μM and 2 mM ATP) to see if it shared the same mechanisms as seen at systolic [Ca2+] (Fig. 3). At these subactivating levels of Ca2+, RyR2 had a Po = 0.14 ± 0.04 and mean open and closed times of ∼20 and ∼400 ms, respectively (Fig. 3A, top trace). Dwell time histograms of closed events (Fig. 3C, ●) exhibit two peaks centered at 0.2 and 200 ms. Addition of 50 μM flecainide to the cytoplasmic bath (Fig. 3A, bottom trace) 1) increased the long time constant of closed times (τS; Fig. 3E, ●); 2) caused a fast mode of block with a time constant, τF = 0.83 ± 0.08 (n = 6), which did not vary with [flecainide] over the range 10–50 μM (not shown); and 3) decreased the mean open time (τo; Fig. 3F, ●). The fast closures caused the conversion of channel long-lasting openings present under control conditions to bursts of openings. Flecainide decreased the duration of these bursts from 36 to 12 ms at 50 μM with an IC50 of 15 μM.
Fig. 3.
Fast and slow modes of flecainide block in diastolic [Ca2+]. (A and B) Representative single-channel recordings of RyR2 at +40 mV showing inhibition by cytoplasmic flecainide (cyt) in the presence of 0.1 μM Ca2+ (A) or 0.1 μM Ca2+ plus 5 mM caffeine (B). Channel openings appear as upward current jumps from the baseline. (C and D) Closed dwell-time histograms compiled 60-second recordings from which the traces in (A) and (B) were taken. The data are fitted with two exponential decays with time constants τF and τS that appear as peaks in these plots, indicated by the arrows. (E and F) Concentration dependencies of the mean duration of long flecainide-induced (τS) closures and mean open time (τo) in the presence and absence of 5 mM caffeine (caf). The dashed line represents values obtained in the presence of 100 μM cytoplasmic Ca2+ plus 1 mM Mg2+. The legend in (F) applies to (E). *Significant difference from zero flecainide (P < 0.05).
The effect of flecainide on τo and τF is similar to that seen in systolic [Ca2+], suggesting that the fast mode of block is the same in systole and diastole. However, the [flecainide] dependencies of τS associated with the slow mode were different in systolic and diastolic [Ca2+] (Fig. 3E, cf. dashed line and ●), the latter showing a positive [flecainide] dependence. This could be explained by Ca2+ affecting the reaction rates of the slow mechanism and/or an apparent lengthening of closed events due to the superposition of slow-mode closures and the long deactivated states of the channel that occur at subactivating [Ca2+]. Distinguishing these possibilities requires a direct measurement of the duration of individual slow-mode blocked events, which is not possible when they are masked by these deactivated RyR2 closures.
To more directly measure the duration of slow-mode block, we eliminated the masking by the RyR2-deactivated states by adding 5 mM caffeine to the cytoplasmic bath to increase the channel activation at 0.1 μM Ca2+ (Fig. 3B, top trace). Addition of 50 μM flecainide under these conditions induced short and long closures of the channel (bottom trace) with closed-time histograms shown in Fig. 3D. The time constant, τS, was similar to that in the absence of caffeine (Fig. 3E) but different from that at high Ca2+ concentrations (Fig. 3E, dashed line), suggesting that differences in the reaction rates contribute to the different time constants of the slow mode of block at diastolic and systolic [Ca2+].
Slow Mode of Flecainide Block Is Specific for RyR2 Closed States.
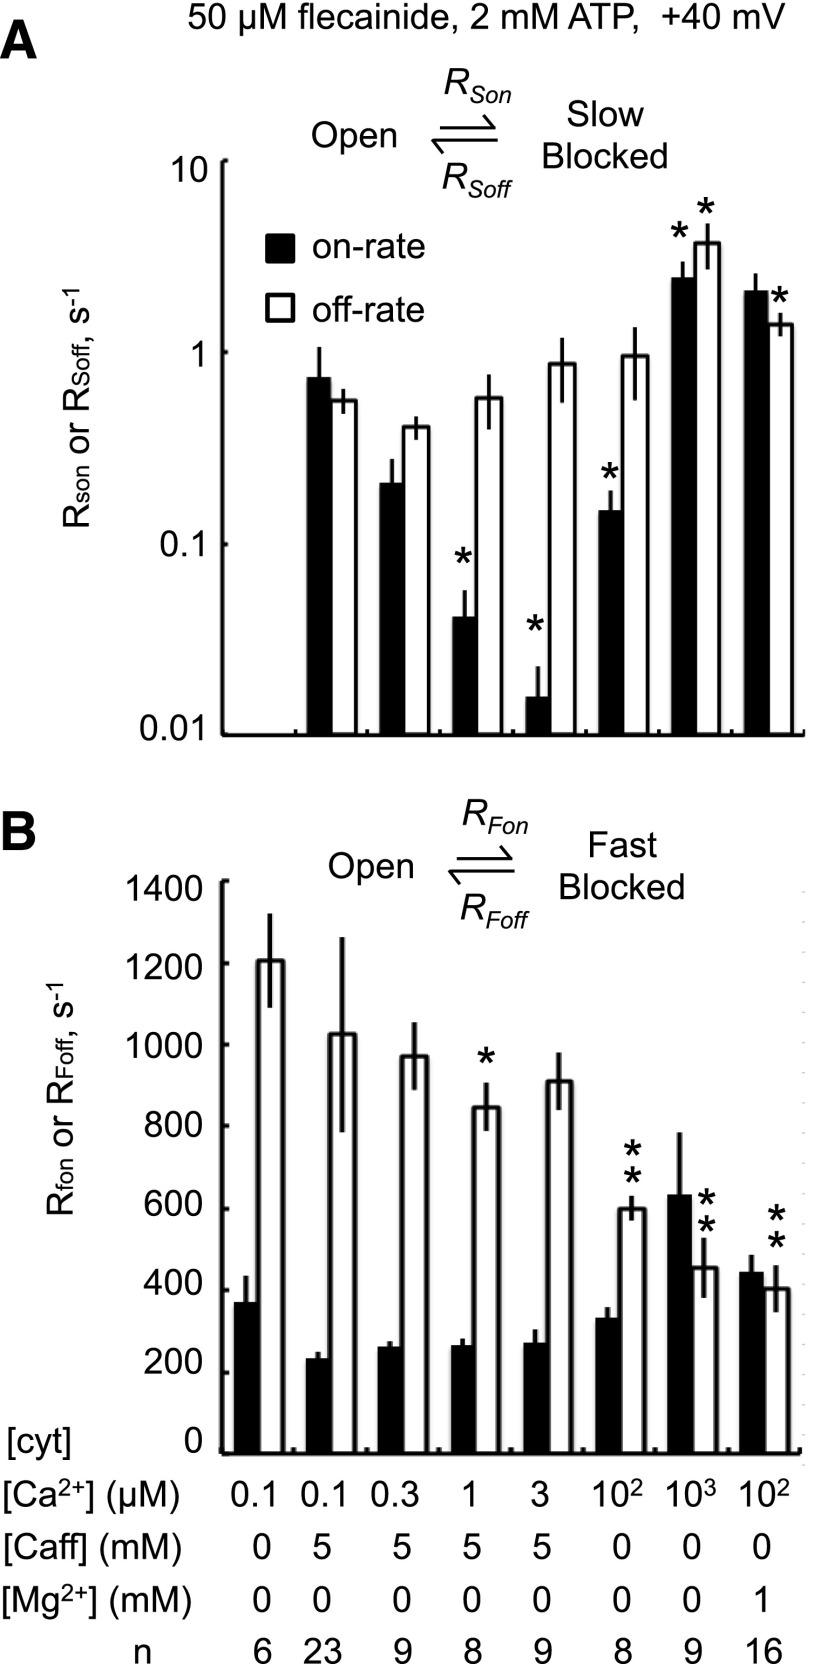
Figure 4 summarizes the on and off rates for flecainide block by fast and slow modes under different channel-activating conditions. The rates were derived from dwell-time histograms as described in the caption to Fig. 4. The on rate of the slow blocking mode was markedly reduced under conditions where RyR2 are strongly activated by cytoplasmic caffeine and/or Ca2+ compared with RyR2 at subactivating [Ca2+] (Fig. 4A, 0.1 μM Ca2+) or where RyR2 are subjected to Ca2+ or Mg2+ inhibition (Fig. 4A, 1 mM Ca2+ or Mg2+). This suggests that the slow mode of block has a preference for the inactive RyR2 channel. The rates associated with the fast mode (Fig. 4B) had a relatively weak dependence on the activating conditions compared with those for the slow mode. Nonetheless, the fast mode off rate was 2- to 3-fold lower at 100 μM to 1 mM cytoplasmic [Ca2+] than at 0.1 μM, whereas caffeine had only a minor effect on the fast off rate.
Fig. 4.
Rates of slow (A) and fast modes (B) of flecainide block associated with the illustrated reaction schemes. Block was induced by 50 μM flecainide in the presence of various cytoplasmic concentrations of caffeine, Ca2+, and Mg2+. For the fast-mode, on rate, RFon = 1/τo and RFoff = 1/τF. For the slow-mode, on rate, RSon equals the inverse of the time between long closures (defined here as closures longer than 200 ms) and RSoff equals the inverse of τS. Note that slow-mode inhibition was not resolved in 0.1 μM Ca2+ alone. Asterisks indicate significant differences from 0.1 μM Ca2+ plus caffeine in (A) and 0.1 μM Ca2+ alone in (B) (*P < 0.05; **P < 0.01).
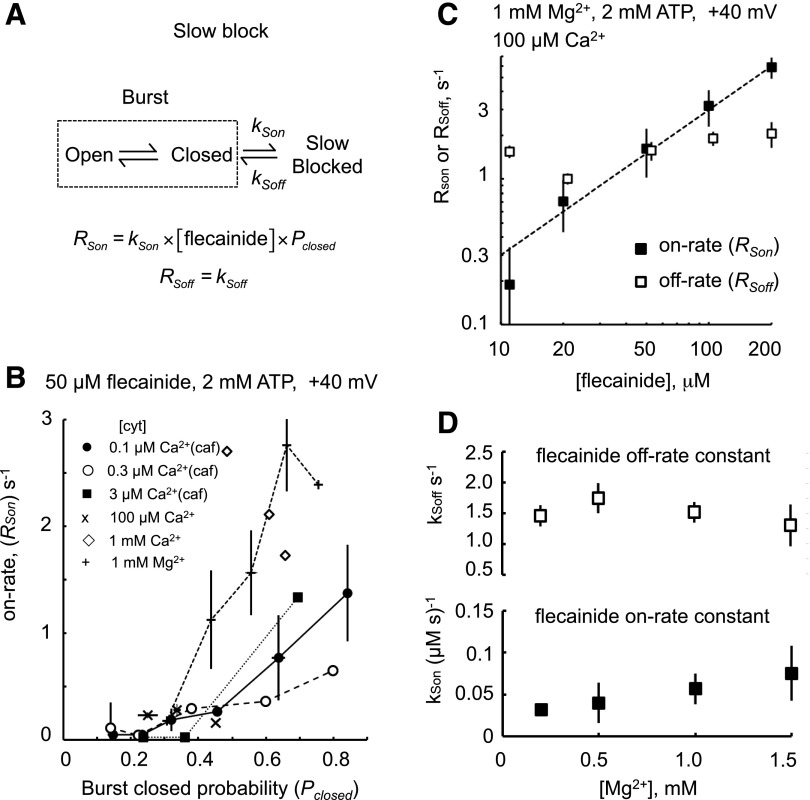
We examined the hypothesis that RyR2 can only enter the slow mode of block via the closed/inactive state of the channel as depicted by the scheme in Fig. 5A. According to this scheme, the on rate increases proportionally with RyR2 closed probability (Pc). Hence, looking for a correlation between the flecainide slow on rate and RyR2 closed probability in the same channel will test this hypothesis. We used the well known observation that RyR2 can exhibit substantial variations in open probability (modal gating) under steady activating conditions, and that there are also channel-to-channel variations in activity. In this analysis, Pc was measured within the bursts of channel activity that occurred between the slow-mode blocked events. Flecainide on rate exhibited a strong positive correlation with Pc under a range of activating conditions (Fig. 5B). Moreover, the correlations were similar for all activating conditions except for cytoplasmic solutions containing 1 mM Ca2+ or Mg2+ that exhibited 2-fold higher on rates. Thus, channels with low Pc gating modes also had low on rates, and this accounts for nearly all of the dependence of the slow mode potency on the RyR2-activating conditions seen in Fig. 4.
Fig. 5.
The slow mode of flecainide block is a closed-channel block as described by the scheme in (A). In the reaction scheme, the dashed rectangle encloses open and closed states of the RyR2 that appear as bursts of activity between slow-mode blocking events (defined here as closures >200 ms). According to this scheme, RSon increases with RyR2 closed probability and with [flecainide]. (B) The on-rate RSon increases with RyR2 closed probability within bursts, regardless of cytosolic (cyt) [Ca2+] and [Mg2+] or the presence of caffeine (caf). (C) The on-rate RSon increases proportionally with [flecainide] (proportionality indicated by the dashed line). (D) Confirms that the rate constants for slow flecainide block [see equations in (A)] do not depend on cytosolic [Mg2+].
The proposed scheme is also consistent with the [flecainide] dependencies of slow-mode rates in Fig. 5C, where the on rate for slow inhibition increased proportionally with flecainide concentration and the off rate showed no significant dependence on concentration. The scheme is also consistent with [Mg2+] dependence of the rate constants for the slow mode (kSon and kSoff; Fig. 5D), where it can be seen that kSon and kSoff did not show any dependence on [Mg2+], thus confirming that these can be considered as constants describing the interaction of Mg2+ and flecainide on RyR2.
Effect of pH on Flecainide Inhibition.
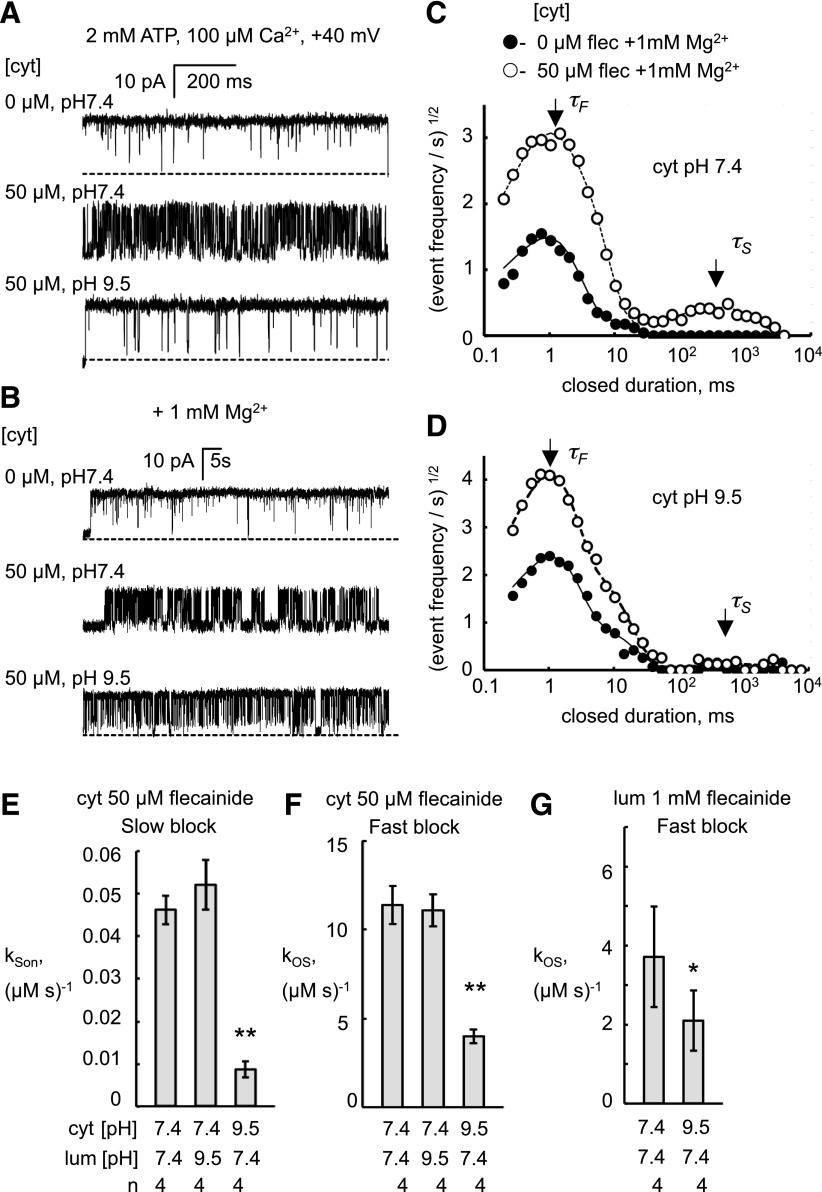
Flecainide is a monovalent cation at neutral pH with a positive charge on its amide group (pKa = 9.2) (Liu et al., 2003). At pH 7.4, 99% of the molecules are in the charged, protonated form, whereas at pH 9.5, this fraction is reduced to 40%. To know which form of flecainide is responsible for RyR2 inhibition, we compare the rates of fast and slow modes of flecainide inhibition at pH 7.4 and 9.5, as shown in Fig. 6. The recordings in Fig. 6, A and B show that raising cytoplasmic pH from 7.4 to 9.5 markedly decreased the inhibition caused by 50 μM flecainide. This is shown for both the fast mode in Fig. 6A (in the absence of Mg2+) and for the slow mode in Fig. 6B, where 1 mM Mg2+ is present. Dwell-time histograms (Fig. 6, C and D) demonstrate that raising cytoplasmic pH from 7.4 to 9.5 attenuates the frequency of both short and long exponential components of the flecainide-induced closures. This occurred via a 6-fold reduction in the on-rate constant of the slow mode (Fig. 6E) and a 2-fold reduction in the fast mode (Fig. 6F). The loss of potency at high pH indicates that the cationic form of flecainide mediates the bulk of slow and fast modes of block.
Fig. 6.
The flecainide cation is a more potent blocker than its neutral form. Cytoplasmic (cyt) flecainide (pKa = 9.2) at 50µM causes flicker block of RyR2 at pH 7.4. (A and B) Recordings obtained at +40 mV with cytoplasmic conditions as indicated. As the pH was raised to 9.5 in the presence of flecainide (flec), the block was abolished within the time of solution exchange. Channel openings appear as upward current jumps from the baseline. (A) Shows alleviation of fast block at high pH and (B) where 1 mM Mg2+ is present, shows alleviation of fast and slow block at high pH. (C and D) Closed-time histograms compiled from the records in (B) indicating the time constants for fast and slow inhibition, τF and τS, respectively. pH 9.5 attenuates the peak associated with slow inhibition. (E–G) Rate constants for fast and slow inhibition modes and their dependence on cytoplasmic and luminal pH. Rate constants were derived from histograms as described in the text. Asterisks indicate significant differences from pH 7.4 in both cytoplasmic and luminal (lum) solutions (*P < 0.05; **P < 0.01).
The relative effects of cytoplasmic and luminal pH on flecainide block were used to gain clues about the side (i.e., cis or trans) of action of flecainide on the RyR2. This is difficult to determine from flecainide alone because it appears to readily cross the bilayer. It is apparent from Fig. 6, E and F that the on rates of slow and fast block for flecainide applied from the cytoplasmic side were sensitive to cytoplasmic pH and not luminal pH. Moreover, increasing cytoplasmic pH could attenuate fast-mode block by flecainide applied from the luminal side (Fig. 6G). Together, these results indicate that flecainide only has access to its site of action from the cytoplasmic side.
Substate Block by Flecainide Fast Mode.
Single-channel recording of the fast mode of block at +60 mV in the presence of 100 μM cytoplasmic Ca2+ and 2 mM ATP revealed that it was due to flecainide-induced transitions from the RyR2 open state to a conductance substate and flecainide-induced transitions from the substate to the closed state (Fig. 7A). Substate current level did not depend on flecainide concentration. The current/voltage relationships (Fig. 7B) indicate a slope conductance of 87 ± 5 pS for the substate and 525 ± 10 pS for the open state, which was identical to that of the open state in the absence of flecainide.
We tested the hypothesis that the substate was due to the binding of a single flecainide molecule to the RyR2, and that the brief closures were due to the binding of two molecules as shown by the scheme in Fig. 7C. The scheme predicts that transition rates from open state to substate and from substate to closed state are proportional to flecainide concentration, whereas the corresponding reverse transition rates are concentration-independent. The concentration dependencies of rates shown in Fig. 7D show that indeed this is the case. The transition rates for the fast inhibition were calculated using the hidden Markov model algorithm (Materials and Methods).
Voltage Dependence of Flecainide Inhibition.
The voltage dependence of the flecainide rate constants may provide clues to the location of its binding sites on the RyR2 molecule within the transmembrane electric field. The flecainide slow-mode on-rate constant was strongly voltage-dependent, whereas the off-rate constant had no voltage dependence (Fig. 8A). For the fast mode, the flecainide rate constants were all voltage-dependant (Fig. 8B). Transitions between open and substates (Fig. 8B, circles) were relatively easy to resolve above the signal noise, and therefore their rates could be observed over a wider voltage range than transitions between the substate and closed states. Increasing the bilayer potential difference from −20 to +80 mV increased the flecainide on-rate constant (●) by 20-fold and decreased the off-rate constant (○) by 5-fold. The voltage dependence of the rate constants for transitions between the substate and closed states (Fig. 8B, triangles) paralleled those of the open-state and substate transitions, albeit with 4-fold slower on-rate and 2-fold faster off-rate constants.
The Woodhull model of voltage-dependent ion block (Woodhull, 1973) attributes the voltage dependence of each binding constant to the voltage dependence of the electrostatic potential of the flecainide cation in the channel. According to this model, the voltage dependence of the flecainide rate constants is related to the ionic charge of flecainide (z = 1) and the relative positions of the flecainide binding sites (δ) and energy barriers (δb) in the trans-membrane electric field by:
where V is the bilayer potential, kon(0) and koff(0) are the binding constants at zero volts, and F, R, and T have their usual meanings. Values of δ are derived from the slopes of the log-linear plots shown in Fig. 8. For cytoplasmic flecainide, δ = 0 would indicate a location on the cytoplasmic side of the membrane and δ = 1, the luminal side. For the slow inhibition, the voltage dependence of the ratio kSon/kSoff gives a value of δ = 1.15 ± 0.14, suggesting a binding site for the slow mode that is much closer to the luminal bath potential than the cytoplasmic bath. For the fast mode of flecainide block, the voltage dependencies of the rate constants were not readily interpreted within the framework of the Woodhull model because the slopes of the voltage dependencies varied over the experimental voltage range (δ ranged from 0 to 1.4 ± 0.4) and so did not give a unique value for δ.
[Cs+] Dependence of Flecainide Inhibition.
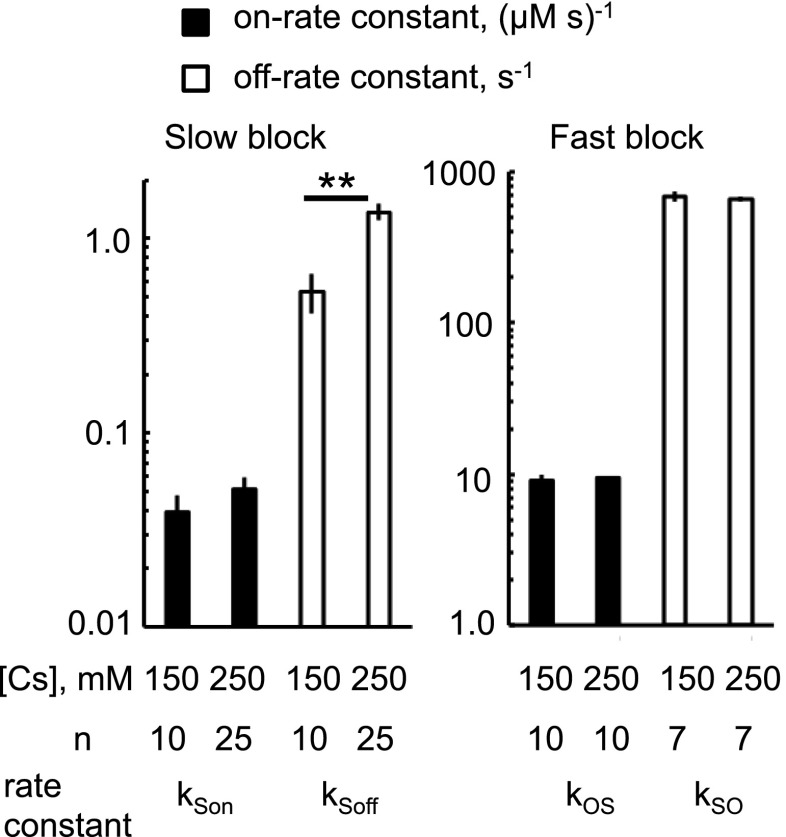
We measured the effect of reducing [Cs+] from 250 to 150 mM to match the physiologic ionic strength of the cytoplasm, and found that the IC50 for flecainide block was reduced ∼5-fold (Fig. 1C). In Fig. 9, we examined the effect of this change in [Cs+] on rate constants for fast and slow modes of flecainide block. The rate constants for fast inhibition were insensitive to [Cs+], but reducing [Cs+] from 250 to 150 mM caused a 2.5-fold decrease in the off-rate constant for the slow mode. However, the change in off-rate constant would account for only half (2.5-fold) of the decrease in the IC50 seen in Fig. 1C. An additional contribution to the effect of [Cs+] on the IC50 may arise from the reduced channel Po in 150 mM [Cs+] (0.75 in 250 mM reducing to 0.37 in 150 mM; see Po max in Table 1), leading to an increase in the on rate for the closed-state block as shown in Fig. 5, A and B. Therefore, the increased potency of flecainide at lower [Cs+] is likely due to both a reduction in the off rate for the closed-state, slow block and an increase in the closed-state probability of the channel.
Fig. 9.
Cytosolic [Cs+] dependence of the rate constants for flecainide inhibition by slow and fast modes (+40 mV). The slow mode of block was measured in the presence of cytoplasmic 1 mM Mg2+, 2 mM ATP, and 100 μM Ca2+. The fast mode was measured in the absence of Mg2+. ** P < 0.01.
Discussion
This study presents a detailed analysis of the kinetics of RyR2 inhibition by flecainide, and its dependence on the activation state of the channel and the overall scheme derived for inhibition is shown in Fig. 10. We show that two modes of action of flecainide (fast and slow) are responsible for the RyR2 block previously reported by Watanabe et al. (2009). The two modes of block are clearly distinguished at systolic cytoplasmic [Ca2+]. The flecainide fast block is evident as relatively frequent transitions (∼1 kHz) between the channel open state and a conductance substate and between that substate and the closed state. The kinetics of fast block (Fig. 7C) follow the same scheme as block of RyR2 by quinidine and cocaine (Tsushima et al., 1996, 2002), where the substates correspond to periods when one drug molecule is bound to the RyR2, and full closures occur when two molecules are bound. The on and off rates for fast block were insensitive to the open state of the channel. The flecainide slow block is seen as less frequent transitions (∼1 Hz) between the open and closed states of the channel, which have not been previously reported. The kinetics of slow block are consistent with a scheme (Fig. 5A) where block occurs from the RyR2 closed state, and where flecainide-induced long closures represent periods in which a single flecainide molecule is bound to the RyR2. The pH dependencies of fast and slow flecainide block (Fig. 6) indicate that these blocking modes are mediated predominantly by the protonated, cation form of flecainide.
Fig. 10.

Overall scheme showing the various mechanisms proposed here for flecainide inhibition of RyR2. Asterisks indicate reaction steps that depend on flecainide.
The kinetics of flecainide block at diastolic cytoplasmic [Ca2+] are different from those seen under systolic [Ca2+] (cf. Figs. 2 and 3). The time constants for the dwell times associated with the fast mode of inhibition are similar in diastolic and systolic conditions, suggesting that the fast mode operates in a similar way under both systolic and diastolic conditions. However, the kinetics of the slow mode measured in systolic [Ca2+] do not account for the properties of the slow-mode inhibition at diastolic [Ca2+] in two respects: 1) the [flecainide] dependencies of long closed times (τS) are very different (Fig. 3E), and 2) the on-rate constant for slow block in systolic [Ca2+] (kSon = 0.05 μMs−1; Fig. 8A at +40mV) is 20-fold too slow to account for the reduction in burst duration (36–12 ms) brought about by 50 μM flecainide at diastolic [Ca2+]. The [flecainide]-dependent reduction in burst duration reported here and previously (Hilliard et al., 2010) indicates another, faster mechanism of inhibition that might be an increased deactivation rate of the RyR2 channel caused by flecainide (i.e., the deactivation transition in Fig. 10).
The anesthetics procaine and the quaternary amine derivatives of lidocaine (QX314, QX222) have been shown to act on RyR2 only when applied to the cytoplasmic side of the membrane (Tinker and Williams, 1993; Xu et al., 1993). However, determination of the side of the membrane from which flecainide binds to the RyR2 is complicated by the fact that flecainide is membrane-permeable. For example, in cardiomyocytes, flecainide must enter the cell to reach its site of action on Nav1.5 channels (Strichartz, 1973; Wang et al., 1995). In our bilayer experiments, flecainide, when applied to either side of the membrane, exhibited the same voltage-dependent modes of block, suggesting that flecainide readily crosses the bilayer and that cytoplasmic and luminal flecainide act by a common mechanism. The 3-fold lower potency for flecainide on the luminal side (relative to cytoplasmic) and the fact that flecainide inhibition was only sensitive to cytoplasmic pH indicate that the flecainide site of action is only accessible from the cytoplasmic solution.
We observed distinctly different [Cs+] and voltage dependencies of the flecainide on and off rates associated with fast and slow block (Figs. 8 and 9), suggesting that the fast and slow modes operate via different binding sites. However, the mechanisms for the [Cs+] and voltage dependencies are not yet clear. The Woodhull model (Woodhull, 1973) does not readily explain the nonexponential voltage dependence of the rate constant for the fast mode of block (Fig. 8B). An alternative model has been proposed to explain the voltage dependence of binding of uncharged drugs to RyR2 such as amitriptyline and ryanodols (Tanna et al., 2000; Chopra et al., 2009). In that model, the voltage dependence of energy barrier profiles is due to distortion of the binding site by the electric field. It is possible that both mechanisms contribute to the observed voltage dependence of flecainide block.
The fast RyR2 blocking mode of flecainide appears to be a common property of local anesthetics. Cocaine (Tsushima et al., 1996), quinidine, quinadinium (Tsushima et al., 2002), and the quaternary amine derivative of lidocaine (QX314; Xu et al., 1993) inhibit RyR2 with a flicker block comprising a conductance substate and complete channel closures. The voltage dependence of fast flecainide inhibition has an effective valency (δ) of 1.4, which is similar to that reported for quinidine (1.2; Tsushima et al., 2002) and QX314 (1.4; Tinker et al., 1992). These voltage dependencies were seen as evidence that the local anesthetics bind in the channel pore. However, the strongest evidence for this comes from mutagenesis studies in Na+ and K+ that show amino acid residues near the cytoplasmic end of the pore channels are important for binding of local anesthetics, including flecainide (Ragsdale et al., 1994, 1996; Yeola et al., 1996). The slow block of RyR2 has also been reported for tetracaine (Xu et al., 1993; Laver and van Helden, 2011), and that also was seen to be a closed-stated blocking mechanism.
In Nav1.5 channels, three local anesthetic blocking mechanisms have been identified (Sheets et al., 2010): 1) an open/inactivated-state block associated with a reduction in the gating charge and stabilization of the S4 segments, 2) a resting closed-state block that may involve a diffuse binding region in the inner vestibule of the pore, and 3) a fast-flicker block due to interaction of the charged forms of local anesthetics with the cytoplasmic side of the selectivity filter. The slow and fast modes for flecainide block of RyR2 have similar characteristics as the latter two forms of Na+ channel block (items 2 and 3, respectively).
Under systolic conditions, tetracaine shares very similar RyR2 inhibition mechanisms with flecainide (Laver and van Helden, 2011). They both have fast and slow modes of block where only the slow mode has a preference for the closed RyR2 confirmation. This raises a question as to why drugs with such similar mechanisms of action have such different effects on Ca2+-release events. Flecainide increases Ca2+ spark frequency but reduces their amplitude, whereas tetracaine only reduces spark frequency. Moreover, flecainide reduces the occurrence of Ca2+ waves, whereas tetracaine increases Ca2+ wave amplitude (Hilliard et al., 2010). The answer may lie in the relative off rates of flecainide and tetracaine associated with their slow modes of block. It has been proposed that tetracaine destabilizes SR Ca2+ release because it is a more potent inhibitor of Ca2+ release during diastole. This would increase diastolic Ca2+ loading of the SR, leading to an increase in systolic Ca2+ release when tetracaine block is alleviated (Laver and van Helden, 2011). During the course of the heartbeat, the relatively fast off rate of tetracaine (∼20 seconds−1) will allow substantial loss in its blocking potency during systole. This would effectively increase the feedback on SR Ca2+ release generated by cytoplasmic and luminal Ca2+ and promote instability of Ca2+ release, whereas the slower off rate for flecainide (∼1 second−1) will tend to sustain flecainide block throughout systole.
The better antiarrhythmic efficacy of flecainide versus tetracaine may lie in its different blocking kinetics under diastolic conditions. Flecainide reduces burst duration of RyR2 activity at diastolic cytoplasmic [Ca2+], whereas tetracaine does not (Hilliard et al., 2010). However, it needs to be emphasized that, in addition to RyR2 inhibition, Na+ channel block by flecainide is clearly important for its efficacy in CPVT. Reducing the Na+ current can 1) inhibit action potentials triggered by sodium-calcium exchanger–mediated depolarizations (Watanabe et al., 2009), and 2) increase sodium-calcium exchanger–mediated Ca2+ efflux, leading to a decrease in Ca2+ concentration in the vicinity of RyR2 (Sikkel et al., 2013; Steele et al., 2013).
In conclusion, we find that in systolic [Ca2+], flecainide causes RyR2 closures via independent fast and slow modes. The slow mode has a preference for the closed RyR2 confirmation, whereas the fast mode does not depend on RyR2 state. Flecainide accesses its sites of action for both modes of inhibition from the cytoplasmic side of the membrane. In diastolic [Ca2+], there is another flecainide inhibition mechanism causing an open-channel block, in addition to the fast and slow modes.
Supplementary Material
Acknowledgments
The authors thank Paul Johnson for his assistance with the single-channel recording.
Abbreviations
- BAPTA
1,2-bis(o-aminophenoxy)ethane-N,N,N′,N′-tetraacetic acid
- CASQ2
calsequestrin
- CPVT
catecholaminergic polymorphic ventricular tachycardia
- Nav1.5
cardiac voltage-dependent sodium channels
- RyR2
cardiac ryanodine receptor 2
- SR
sarcoplasmic reticulum
- TES
N-tris[hydroxymethyl]methyl-2-aminoethanesulfonic acid
Authorship Contributions
Participated in research design: Mehra, Laver.
Conducted experiments: Mehra.
Contributed new reagents or analytic tools: Laver.
Performed data analysis: Mehra, Laver.
Wrote or contributed to the writing of the manuscript: Knollmann, Mehra, Imtiaz, van Helden, Laver.
Footnotes
This work was funded by the New South Wales Health infrastructure grant through the Hunter Medical Research Institute to D.R.L., the National Health and Medical Research Council Project grant [APP1005974] to D.R.L. and B.C.K., and the National Institutes of Health [Grant HL88635] to B.C.K.
 This article has supplemental material available at molpharm.aspetjournals.org.
References
- Anno T, Hondeghem LM. (1990) Interactions of flecainide with guinea pig cardiac sodium channels. Importance of activation unblocking to the voltage dependence of recovery. Circ Res 66:789–803. [DOI] [PubMed] [Google Scholar]
- Blayney LM, Lai FA. (2009) Ryanodine receptor-mediated arrhythmias and sudden cardiac death. Pharmacol Ther 123:151–177. [DOI] [PMC free article] [PubMed] [Google Scholar]
- Borchard U, Boisten M. (1982) Effect of flecainide on action potentials and alternating current-induced arrhythmias in mammalian myocardium. J Cardiovasc Pharmacol 4:205–212. [DOI] [PubMed] [Google Scholar]
- Campbell TJ, Vaughan Williams EM. (1983) Voltage- and time-dependent depression of maximum rate of depolarisation of guinea-pig ventricular action potentials by two new antiarrhythmic drugs, flecainide and lorcainide. Cardiovasc Res 17:251–258. [DOI] [PubMed] [Google Scholar]
- Cannell MB, Soeller C. (1997) Numerical analysis of ryanodine receptor activation by L-type channel activity in the cardiac muscle diad. Biophys J 73:112–122. [DOI] [PMC free article] [PubMed] [Google Scholar]
- Chopra N, Laver D, Davies SS, Knollmann BC. (2009) Amitriptyline activates cardiac ryanodine channels and causes spontaneous sarcoplasmic reticulum calcium release. Mol Pharmacol 75:183–195. [DOI] [PMC free article] [PubMed] [Google Scholar]
- Chung SH, Moore JB, Xia LG, Premkumar LS, Gage PW. (1990) Characterization of single channel currents using digital signal processing techniques based on Hidden Markov Models. Philos Trans R Soc Lond B Biol Sci 329:265–285. [DOI] [PubMed] [Google Scholar]
- Dibb KM, Eisner DA, Trafford AW. (2007) Regulation of systolic [Ca2+]i and cellular Ca2+ flux balance in rat ventricular myocytes by SR Ca2+, L-type Ca2+ current and diastolic [Ca2+]i. J Physiol 585:579–592. [DOI] [PMC free article] [PubMed] [Google Scholar]
- George CH, Higgs GV, Lai FA. (2003) Ryanodine receptor mutations associated with stress-induced ventricular tachycardia mediate increased calcium release in stimulated cardiomyocytes. Circ Res 93:531–540. [DOI] [PubMed] [Google Scholar]
- Grant AO, Chandra R, Keller C, Carboni M, Starmer CF. (2000) Block of wild-type and inactivation-deficient cardiac sodium channels IFM/QQQ stably expressed in mammalian cells. Biophys J 79:3019–3035. [DOI] [PMC free article] [PubMed] [Google Scholar]
- Hilliard FA, Steele DS, Laver D, Yang Z, Le Marchand SJ, Chopra N, Piston DW, Huke S, Knollmann BC.(2010) Flecainide inhibits arrhythmogenic Ca2+ waves by open state block of ryanodine receptor Ca2+ release channels and reduction of Ca2+ spark mass. J Mol Cell Cardiol 48:293–301. [DOI] [PMC free article] [PubMed] [Google Scholar]
- Knollmann BC, Chopra N, Hlaing T, Akin B, Yang T, Ettensohn K, Knollmann BE, Horton KD, Weissman NJ, Holinstat I, et al. (2006) Casq2 deletion causes sarcoplasmic reticulum volume increase, premature Ca2+ release, and catecholaminergic polymorphic ventricular tachycardia. J Clin Invest 116:2510–2520. [DOI] [PMC free article] [PubMed] [Google Scholar]
- Kojima M, Hamamoto T, Ban T. (1989) Sodium channel-blocking properties of flecainide, a class IC antiarrhythmic drug, in guinea-pig papillary muscles. An open channel blocker or an inactivated channel blocker. Naunyn Schmiedebergs Arch Pharmacol 339:441–447. [DOI] [PubMed] [Google Scholar]
- Laver DR, O’Neill ER, Lamb GD. (2004) Luminal Ca2+-regulated Mg2+ inhibition of skeletal RyRs reconstituted as isolated channels or coupled clusters. J Gen Physiol 124:741–758. [DOI] [PMC free article] [PubMed] [Google Scholar]
- Laver DR, Roden LD, Ahern GP, Eager KR, Junankar PR, Dulhunty AF. (1995) Cytoplasmic Ca2+ inhibits the ryanodine receptor from cardiac muscle. J Membr Biol 147:7–22. [DOI] [PubMed] [Google Scholar]
- Laver DR, van Helden DF. (2011) Three independent mechanisms contribute to tetracaine inhibition of cardiac calcium release channels. J Mol Cell Cardiol 51:357–369. [DOI] [PubMed] [Google Scholar]
- Liu H, Atkins J, Kass RS. (2003) Common molecular determinants of flecainide and lidocaine block of heart Na+ channels: evidence from experiments with neutral and quaternary flecainide analogues. J Gen Physiol 121:199–214. [DOI] [PMC free article] [PubMed] [Google Scholar]
- Liu N, Colombi B, Memmi M, Zissimopoulos S, Rizzi N, Negri S, Imbriani M, Napolitano C, Lai FA, Priori SG. (2006) Arrhythmogenesis in catecholaminergic polymorphic ventricular tachycardia: insights from a RyR2 R4496C knock-in mouse model. Circ Res 99:292–298. [DOI] [PubMed] [Google Scholar]
- Liu H, Tateyama M, Clancy CE, Abriel H, Kass RS. (2002) Channel openings are necessary but not sufficient for use-dependent block of cardiac Na(+) channels by flecainide: evidence from the analysis of disease-linked mutations. J Gen Physiol 120:39–51. [DOI] [PMC free article] [PubMed] [Google Scholar]
- McCauley MD, Wehrens XH. (2011) Targeting ryanodine receptors for anti-arrhythmic therapy. Acta Pharmacol Sin 32:749–757. [DOI] [PMC free article] [PubMed] [Google Scholar]
- Näbauer M, Ellis-Davies GC, Kaplan JH, Morad M. (1989) Modulation of Ca2+ channel selectivity and cardiac contraction by photorelease of Ca2+. Am J Physiol 256:H916–H920. [DOI] [PubMed] [Google Scholar]
- Nagatomo T, January CT, Makielski JC. (2000) Preferential block of late sodium current in the LQT3 DeltaKPQ mutant by the class I(C) antiarrhythmic flecainide. Mol Pharmacol 57:101–107. [PubMed] [Google Scholar]
- Nitta J, Sunami A, Marumo F, Hiraoka M. (1992) States and sites of actions of flecainide on guinea-pig cardiac sodium channels. Eur J Pharmacol 214:191–197. [DOI] [PubMed] [Google Scholar]
- Nyegaard M, Overgaard MT, Søndergaard MT, Vranas M, Behr ER, Hildebrandt LL, Lund J, Hedley PL, Camm AJ, Wettrell G, et al. (2012) Mutations in calmodulin cause ventricular tachycardia and sudden cardiac death. Am J Hum Genet 91:703–712. [DOI] [PMC free article] [PubMed] [Google Scholar]
- O’Neill ER, Sakowska MM, Laver DR. (2003) Regulation of the calcium release channel from skeletal muscle by suramin and the disulfonated stilbene derivatives DIDS, DBDS, and DNDS. Biophys J 84:1674–1689. [DOI] [PMC free article] [PubMed] [Google Scholar]
- Postma AV, Denjoy I, Hoorntje TM, Lupoglazoff JM, Da Costa A, Sebillon P, Mannens MM, Wilde AA, Guicheney P. (2002) Absence of calsequestrin 2 causes severe forms of catecholaminergic polymorphic ventricular tachycardia. Circ Res 91:e21–e26. [DOI] [PubMed] [Google Scholar]
- Priori SG, Napolitano C, Tiso N, Memmi M, Vignati G, Bloise R, Sorrentino V, Danieli GA. (2001) Mutations in the cardiac ryanodine receptor gene (hRyR2) underlie catecholaminergic polymorphic ventricular tachycardia. Circulation 103:196–200. [DOI] [PubMed] [Google Scholar]
- Ragsdale DS, McPhee JC, Scheuer T, Catterall WA. (1994) Molecular determinants of state-dependent block of Na+ channels by local anesthetics. Science 265:1724–1728. [DOI] [PubMed] [Google Scholar]
- Ragsdale DS, McPhee JC, Scheuer T, Catterall WA. (1996) Common molecular determinants of local anesthetic, antiarrhythmic, and anticonvulsant block of voltage-gated Na+ channels. Proc Natl Acad Sci USA 93:9270–9275. [DOI] [PMC free article] [PubMed] [Google Scholar]
- Sheets MF, Fozzard HA, Lipkind GM, Hanck DA. (2010) Sodium channel molecular conformations and antiarrhythmic drug affinity. Trends Cardiovasc Med 20:16–21. [DOI] [PMC free article] [PubMed] [Google Scholar]
- Sigworth FJ, Sine SM. (1987) Data transformations for improved display and fitting of single-channel dwell time histograms. Biophys J 52:1047–1054. [DOI] [PMC free article] [PubMed] [Google Scholar]
- Sikkel MB, Collins TP, Rowlands C, Shah M, O’Gara P, Williams AJ, Harding SE, Lyon AR, MacLeod KT. (2013) Flecainide reduces Ca(2+) spark and wave frequency via inhibition of the sarcolemmal sodium current. Cardiovasc Res 98:286–296. [DOI] [PMC free article] [PubMed] [Google Scholar]
- Steele DS, Hwang HS, Knollmann BC. (2013) Triple mode of action of flecainide in catecholaminergic polymorphic ventricular tachycardia. Cardiovasc Res 98:326–327. [DOI] [PMC free article] [PubMed] [Google Scholar]
- Strichartz GR. (1973) The inhibition of sodium currents in myelinated nerve by quaternary derivatives of lidocaine. J Gen Physiol 62:37–57. [DOI] [PMC free article] [PubMed] [Google Scholar]
- Tanna B, Welch W, Ruest L, Sutko JL, Williams AJ. (2000) The interaction of a neutral ryanoid with the ryanodine receptor channel provides insights into the mechanisms by which ryanoid binding is modulated by voltage. J Gen Physiol 116:1–9. [DOI] [PMC free article] [PubMed] [Google Scholar]
- Tinker A, Lindsay AR, Williams AJ. (1992) Large tetraalkyl ammonium cations produce a reduced conductance state in the sheep cardiac sarcoplasmic reticulum Ca2+-release channel. Biophys J 61:1122–1132. [DOI] [PMC free article] [PubMed] [Google Scholar]
- Tinker A, Williams AJ. (1993) Charged local anesthetics block ionic conduction in the sheep cardiac sarcoplasmic reticulum calcium release channel. Biophys J 65:852–864. [DOI] [PMC free article] [PubMed] [Google Scholar]
- Tsushima RG, Kelly JE, Wasserstrom JA. (1996) Characteristics of cocaine block of purified cardiac sarcoplasmic reticulum calcium release channels. Biophys J 70:1263–1274. [DOI] [PMC free article] [PubMed] [Google Scholar]
- Tsushima RG, Kelly JE, Wasserstrom JA. (2002) Subconductance activity induced by quinidine and quinidinium in purified cardiac sarcoplasmic reticulum calcium release channels. J Pharmacol Exp Ther 301:729–737. [DOI] [PubMed] [Google Scholar]
- Wang Z, Fermini B, Nattel S. (1995) Effects of flecainide, quinidine, and 4-aminopyridine on transient outward and ultrarapid delayed rectifier currents in human atrial myocytes. J Pharmacol Exp Ther 272:184–196. [PubMed] [Google Scholar]
- Watanabe H, Chopra N, Laver D, Hwang HS, Davies SS, Roach DE, Duff HJ, Roden DM, Wilde AA, Knollmann BC. (2009) Flecainide prevents catecholaminergic polymorphic ventricular tachycardia in mice and humans. Nat Med 15:380–383. [DOI] [PMC free article] [PubMed] [Google Scholar]
- Watanabe H, Knollmann BC. (2011) Mechanism underlying catecholaminergic polymorphic ventricular tachycardia and approaches to therapy. J Electrocardiol 44:650–655. [DOI] [PubMed] [Google Scholar]
- Woodhull AM. (1973) Ionic blockage of sodium channels in nerve. J Gen Physiol 61:687–708. [DOI] [PMC free article] [PubMed] [Google Scholar]
- Xu L, Jones R, Meissner G. (1993) Effects of local anesthetics on single channel behavior of skeletal muscle calcium release channel. J Gen Physiol 101:207–233. [DOI] [PMC free article] [PubMed] [Google Scholar]
- Yeola SW, Rich TC, Uebele VN, Tamkun MM, Snyders DJ. (1996) Molecular analysis of a binding site for quinidine in a human cardiac delayed rectifier K+ channel. Role of S6 in antiarrhythmic drug binding. Circ Res 78:1105–1114. [DOI] [PubMed] [Google Scholar]
- Zhou Q, Xiao J, Jiang D, Wang R, Vembaiyan K, Wang A, Smith CD, Xie C, Chen W, Zhang J, et al. (2011) Carvedilol and its new analogs suppress arrhythmogenic store overload-induced Ca2+ release. Nat Med 17:1003–1009. [DOI] [PMC free article] [PubMed] [Google Scholar]
Associated Data
This section collects any data citations, data availability statements, or supplementary materials included in this article.


