

Abstract
Background
Attrition is common in alcohol clinical trials and the resultant loss of data represents an important methodological problem. In the absence of a simulation study, the drinking outcomes among those who are lost to follow-up are not known. Individuals who drop out of treatment and continue to provide drinking data, however, may be a reasonable proxy group for making inferences about the drinking outcomes of those lost to follow-up.
Methods
We used data from the COMBINE study, a multisite, randomized clinical trial, to examine drinking during the four months of treatment among individuals who dropped out of treatment but continued to provide drinking data (i.e., “treatment dropouts;” n=185). First, we estimated the observed treatment effect size for naltrexone versus placebo in a sample that included both treatment completers (n=961) and treatment dropouts (n=185; total N=1146), as well as the observed treatment effect size among just those who dropped out of treatment (n=185). In both the total sample (N=1146) and the dropout sample (n=185), we then deleted the drinking data after treatment dropout from those 185 individuals to simulate missing data. Using the deleted datasets we then estimated the effect of naltrexone on the continuous outcome percent heavy drinking days using six methods to handle missing data (last observation carried forward, baseline observation carried forward, placebo mean imputation, missing=heavy drinking days, multiple imputation (MI), and full information maximum likelihood (FIML)).
Results
MI and FIML produced effect size estimates that were most similar to the true effects observed in the full data set in all analyses, while missing=heavy drinking days performed the worst.
Conclusions
Although missing drinking data should be avoided whenever possible, MI and FIML yield the best estimates of the treatment effect for a continuous outcome measure of heavy drinking when there is dropout in an alcohol clinical trial.
Keywords: missing data, alcohol use disorder, relapse, treatment, clinical trials, continuous outcome measure
Introduction
Participant dropout (i.e., attrition or loss to follow-up) from alcohol clinical trials is problematic on multiple levels. From a research perspective, the loss of participants due to attrition reduces the sample size, with a corresponding reduction of statistical power to detect effects of treatment, leading to biased estimates of the treatment effect (Roy et al., 2007), particularly when there is differential dropout rates across treatment groups. Clinically, treatment dropout is often attributed to client factors, such as medication side effects or limited motivation to change, although poor therapeutic alliance and program demands have also been reflected in the clinician's perspective on treatment dropout (Palmer et al., 2009). From a regulatory perspective, it is critical to understand how and why treatment dropout may impact the ultimate treatment efficacy (National Research Council, 2010). Intent-to-treat (ITT) analyses, often considered the gold standard for clinical trials, require that patients assigned to a specific treatment be included in the analysis of that assigned treatment, regardless of their adherence to treatment. Yet missing data can undermine the certainty of effect sizes in ITT and researchers are encouraged to use multiple approaches to estimate effects in ITT when missing data are an issue (Nich & Carroll, 2002).
Prior studies have identified several important predictors of attrition from clinical trials, as well as alcohol treatment dropout. Demographic factors that may be related to attrition and treatment dropout include membership in a minority group, unemployment, younger age, and male gender (see Palmer et al., 2009 for a review). Client factors, such as lower motivation to change, lower severity of problems, mental health comorbidity, and poor social support have all been shown to predict higher rates of attrition and treatment dropout (Elbreder et al., 2011; McKeller et al., 2006; Palmer et al., 2009; Tull and Gratz, 2012). Program factors, such as more controlling environments and greater barriers to treatment engagement have been shown to predict treatment dropout (McKellar et al., 2006; Palmer et al., 2009). In pharmacotherapy studies, within-treatment factors such as lack of benefit and adverse events have been associated with early non-adherence to treatment (Gueorguieva et al., 2013).
Methods to Analyze Data among Treatment Dropouts
Guidelines for handling missing data in clinical trials from the National Research Council (2010) are supported by nearly 40 years of research on the mechanisms and handling of missing data in psychological and medical research (Little and Rubin, 2002; Rubin, 1976). In the guidelines it is recommended that researchers emphasize reducing the occurrence of missing data and when missing data occurs that modern statistical methods for dealing with missing data be employed (e.g., full information maximum likelihood and multiple imputation approaches). In a recent simulation study, we compared the performance of various missing data methods for handling missing data in an alcohol clinical trial that included pharmacotherapy and behavioral intervention using a common outcome measure, percent heavy drinking days (PHDD; Hallgren and Witkiewitz, 2013). We found that full information maximum likelihood estimation and multiple imputation methods produced the least biased estimates of effect sizes in simulated data, while complete cases analysis (i.e., listwise deletion) and single imputation approaches (e.g., last observation carried forward and the worst-case scenario of assuming missing as reflecting heavy drinking) produced biased estimates of effect sizes in nearly all simulation conditions. These findings were consistent with those from studies utilizing simulated and real-world data from treatment studies of other addictive drugs which also found maximum likelihood and multiple imputation to be superior methods for handling missing data (e.g., Barnes et al., 2010; Hedden et al., 2009; Hedeker et al., 2007).
Briefly, full information maximum likelihood estimation and multiple imputation methods both rely on iterative procedures to obtain parameter estimates using all available data. In multiple imputation, several datasets are estimated with each dataset containing a single plausible value for the missing data values based on a prediction equation that utilize mean and covariance structures of the available data (e.g., where each value is estimated using a regression-based imputation procedure). Each imputed dataset incorporates random error variance into the imputed values, then the analysis of interest is performed on each dataset and the results are pooled to yield estimates and standard errors of treatment effects. In full information maximum likelihood, the mean and covariance structures for all available data are analyzed using an expectation maximization algorithm to identify parameter estimates that maximize the model fit with the observed data (i.e., minimizing the distance between the observed and predicted data). In other words, data are not imputed or generated, rather the fit of an estimated model is maximized to reproduce the observed data based on all data that are available. With both methods, individuals who are missing some data can still be included in analyses.
Our prior work, using simulated dropout from real-world clinical trial data, found that full information maximum likelihood estimation and multiple imputation best approximated the true effect sizes and that other methods yielded substantial bias under varying conditions of dropout (e.g., different dropout rates between treatment conditions, dropout completely random vs. stratified by baseline or follow-up heavy drinking). However, these findings were based on a dataset that included only treatment completers and the missing data were “simulated” to be missing under varying conditions (e.g., differential dropout rates, different missing data mechanisms). Thus, the degree to which each method produces biased results among participants who actually drop out of treatment remains unknown. Although what happens to individuals who do not complete the research assessments cannot be known with certainty, we hypothesized that those who dropped out of treatment and continue to report their drinking data through the end of the study may be a reasonable proxy for those who are lost to follow-up. More importantly, the treatment dropouts are a clear proxy for individuals in clinical trials who drop out of treatment and who would have completed assessments, if they were followed after dropping out.
The goal of the current study was to examine the performance of these missing data methods to analyze the effect of naltrexone among “treatment dropouts,” defined as individuals who completed the research assessments, but dropped out of treatment (i.e., discontinued medication and stopped attending therapy sessions), within a randomized trial for alcohol dependence. Specifically, we took advantage of the research design of the COMBINE study (Anton et al., 2006), in which treatment dropouts were followed and invited to complete all drinking research assessments through the end of the four-month treatment period, to examine the effects of missing data among the treatment dropouts.
We started by using the observed data from treatment completers and treatment dropouts, then, among individuals who dropped out of treatment, we manually deleted (i.e., set to missing) their drinking data for all time points after they dropped out. We then applied various missing data methods to estimate effect of naltrexone treatment and compared these estimates to the treatment effect observed in the actual data. To maximize the sample size of the treatment dropouts available for analyses, we utilized data from all individuals who were randomized to receive naltrexone and compared them against all those randomized to receive placebo naltrexone, irrespective of whether they received only medical management or a more intensive behavioral intervention (see below).
Materials and Methods
Participants and Measures
The data for this study are from the COMBINE study (COMBINE Study Research Group, 2003), a multi-site, randomized clinical trial for the treatment of alcohol dependence. A total of 1383 alcohol dependent subjects across 11 research sites were randomized into nine treatment groups that received a combination of medications, medical management (MM), and/or a Combined Behavioral Intervention (CBI): Naltrexone + Acamprosate Placebo + MM; Acamprosate + Naltrexone Placebo + MM; Naltrexone + Acamprosate + MM; Acamprosate Placebo + Naltrexone Placebo + MM; Naltrexone + Acamprosate Placebo + CBI; Acamprosate + Naltrexone Placebo + CBI; Naltrexone + Acamprosate + CBI; Acamprosate Placebo + Naltrexone Placebo + CBI; and CBI-only.
Of the total sample (N = 1383), we excluded CBI-only participants (n = 157) and all participants who were lost to follow-up (i.e., dropped out of treatment and did not complete research assessments; n = 24); resulting in a sample size of 1202 individuals who received medication and either completed treatment and provided some drinking data during treatment (n = 968) or dropped out of treatment and provided some drinking data during treatment (n = 234). The CBI-only participants were excluded because they did not receive naltrexone or placebo naltrexone, which was the main independent variable for the analyses described below. Of this sample, 4.7% (56 out of 1202) had some missing drinking data during treatment, with 1% of drinking data missing among treatment completers (7 out of 968) and 20.9% of drinking data missing among treatment dropouts (49 out of 234). Thus, participants who dropped out of treatment and completed some assessments were significantly more likely to have missing data than those who completed treatment (χ2 (1) = 173.40, p < 0.001). Individuals with some missing drinking data in both groups (n=56; 7 treatment completers and 49 treatment dropouts) were excluded from the remainder of the analyses, leaving 1146 individuals for analysis.
Individuals with some missing data were deleted from subsequent analyses because we wanted to start the analyses with those individuals who had complete drinking data. Importantly, all analyses were conducted with and without these 56 individuals included and the results were consistent regardless of including or not including those individuals with some missing data. The results reported below are based on the sample with complete data (n = 1146).
Treatment Completer and Dropout Sample
The “Treatment Completer and Dropout” sample (n = 1146) included individuals in the medication/placebo conditions who completed all research assessments and either completed all four months of treatment (n=961) or dropped out of treatment (n = 185) but provided drinking data. As shown in Table 1, approximately 31% were female, 23.2% were ethnic minorities (76.8% Non-Hispanic White, 11.1% Hispanic, 8.2% African American, 1.4% identified as “multi-racial,” 1.3% American Indian or Alaska Native, 0.2% Asian American or Pacific Islander, and 1.0% “other”), 94.1% had at least 12 years of education, 42.4% were married and the average age was 44.6 (SD = 10.3).
Table 1.
Demographics by Treatment Completion or Treatment Dropout Status. Dropouts here are defined as those who stopped treatment but continued to provide drinking data through the end of the treatment trial (16 weeks). Lost to Follow-Up were those who stopped treatment and did not provide further drinking data. The Loss to Follow-Up group is provided for comparison purposes only.
| Demographics and Baseline Characteristics | Completers and Dropouts (n=1146) | Completers Only (n=961) | Dropouts Only (n=185) | Loss to Follow-Up (n=24) |
|---|---|---|---|---|
| Female N (%) | 355 (31%) | 295 (30.7%) | 60 (32.4%) | 6 (25.0%) |
| Ethnicity N (%) | ||||
| Non-Hispanic White | 880 (76.8%) | 748 (77.8%) | 132 (71.4%) | 17 (70.8%) |
| Hispanic | 127 (11.1%) | 94 (9.8%) | 33 (17.8%) a | 6 (25.0%) |
| African American | 94 (8.2%) | 86 (8.9%) | 8 (4.3%) a | 1 (4.2%) |
| American Indian/Alaska Native | 15 (1.3%) | 9 (0.9%) | 6 (3.2%) a | 0 (0.0%) |
| Asian American | 2 (0.2%) | 2 (0.2%) | 0 (0.0%) | 0 (0.0%) |
| Bi- or Multi-racial | 15 (1.4%) | 11 (1.2%) | 4 (2.2%) | 0 (0.0%) |
| “Other” | 12 (1.0%) | 10 (1.0%) | 2 (1.1%) | 0 (0.0%) |
| Age M (SD) | 44.58 (10.26) | 45.23 (10.20) | 41.23 (9.96) a | 37.46 (6.74) b |
| Married N (%) | 486 (42.4%) | 423 (44.0%) | 63 (34.1%) a | 10 (41.7%) |
| 12 Years of Education N (%) | 1078 (94.1%) | 912 (94.9%) | 166 (89.7%) a | 21 (87.5%) |
| Alcohol Dependence Scale M (SD) | 16.64 (7.38) | 16.40 (7.27) | 17.87 (7.82) a | 18.70 (6.23) |
| Baseline % heavy drinking days M (SD) | 65.61 (28.38) | 65.45 (28.37) | 66.41 (28.47) | 63.61 (32.08) |
Note.
p < 0.05 difference between Completers Only and Dropouts Only;
p < 0.05 difference between Dropouts Only and those Lost to Follow-Up
Treatment Dropout Sample
The “Treatment Dropout” sample included the individuals in the medication/placebo conditions who completed all research assessments and provided drinking data through the end of the 16 week trial but also dropped out of treatment (i.e., stopped medications and counseling; n = 185). Of this sample, 43 (23.2%) dropped out during the first month of treatment, 64 (34.6%) dropped out during the second month of treatment, 32 (17.3%) dropped out during the third month of treatment, and 46 (24.9%) dropped out during the fourth/last month of treatment.
As seen in Table 1, individuals who dropped out of treatment and completed assessments were significantly younger (t (1146) = 4.91, p < 0.001), more likely to be American Indian or Alaska Native (χ2 (1) = 6.39, p = 0.01), Hispanic (χ2 (1) = 10.22, p = 0.001), less likely to be African American (χ2 (1) = 4.41, p = 0.04), be married (χ2 (1) = 6.30, p = 0.01), or to complete 12 years of education (χ2 (1) = 7.43, p = 0.006) compared to those who completed treatment. This is consistent with demographic variables that commonly predict attrition from follow-up assessments in other clinical trials (Palmer et al., 1999). Differences between samples at baseline were also observed for alcohol dependence severity: Individuals who dropped out of treatment and completed research assessments had significantly higher scores on the Alcohol Dependence Scale (ADS; Skinner & Horn, 1984) than those who completed treatment (t (1146) = -2.48, p = 0.01), but the groups did not differ on salient drinking measures (e.g., PHDD) at baseline.
Lost to Follow-Up Sample
The “Lost to Follow-Up” sample included individuals in the medication/placebo conditions who dropped out of treatment and did not complete research assessments (n = 24) during the four months of treatment. This sample was not included in any of the analyses, but is included in Table 1 to provide comparisons with the Treatment Completer and Treatment Dropout samples. Compared to the Treatment Dropout sample, individuals in the Lost to Follow-up sample were significantly younger (t (207) = 2.42, p = 0.021), but did not differ on any of the other demographic variables, alcohol dependence severity (as measured by the ADS), or baseline PHDD.
Drinking Outcome
The primary outcome of interest was PHDD, because it combines both the frequency and intensity of drinking and is thus a commonly used measure in modern alcohol clinical trials (e.g., Fertig et al., 2012; Litten et al., 2013). The Form-90 interview (Miller and Del Boca, 1994) was used to calculate PHDD with a heavy drinking day defined as 4 or more drinks in a day for women and 5 or more drinks in a day for men. PHDD was derived for the prior 30 days at each assessment point (i.e., at the end of months 1, 2, 3, and 4 during treatment). For the independent variable, subjects receiving naltrexone (with acamprosate or acamprosate placebo) were coded as 1 (Treatment Completer and Dropout sample: n = 572; Treatment Dropout sample: n = 97) and those receiving naltrexone placebo (with acamprosate or acamprosate placebo) were coded as 0 (Treatment Completer and Dropout sample: n = 574; Treatment Dropout sample: n = 88).
Data Analysis
Data were analyzed using general linear mixed models with naltrexone as a predictor of PHDD across all four months of treatment as the outcome of interest using Mplus version 7.11 (Muthén & Muthén, 2012). To examine the effects of treatment dropout over the course of treatment, we first created two complete datasets: “Treatment Completers and Dropouts – Complete,” which included the 1146 individuals who completed all drinking assessments and either completed treatment (n = 961) or dropped out of treatment (n = 185); and “Treatment Dropouts Only – Complete,” which included the 185 individuals who dropped out of treatment but completed all of the drinking assessments. Mixed models provided estimates of the fixed effects of treatment (naltrexone versus placebo naltrexone) and random effects of time (months during treatment). We then degraded these datasets by setting the drinking data to be missing after the point of treatment dropout (i.e., we manually deleted the drinking data from subjects who dropped out of treatment after the point of treatment dropout to simulate missing data as if they were completely lost to follow-up which might occur in a clinical trial). Thus, we created two degraded datasets: “Treatment Completers and Dropouts – Deleted,” which included the drinking assessments of individuals who completed treatment (n = 961) and those who dropped out of treatment (n =185), but drinking data were deleted (set to missing) after the point of treatment dropout among those who dropped out; and “Treatment Dropouts Only – Deleted,” which included only the available data from subjects who dropped out of treatment (n =185) with drinking data deleted (set to missing) after the point of treatment dropout.
Missing data methods
The mixed model results from “Treatment Completers and Dropout - Complete” and “Treatment Dropout Only - Complete” datasets reflected the “true” effects of naltrexone in the observed data. For the “Treatment Completers and Dropout -Deleted” and “Treatment Dropout Only – Deleted” datasets we estimated the effect of naltrexone using six different methods for handling missing data: last observation carried forward (LOCF), baseline observation carried forward (BOCF), placebo mean imputation (PMI), missing=heavy drinking, multiple imputation (MI), and full information maximum likelihood (FIML). For the LOCF analyses, the PHDD from the time point prior to treatment dropout (e.g., the last month of drinking data available) was carried forward to replace the missing values after treatment dropout. For the BOCF analyses, the PHDD from baseline was carried forward to replace the missing values after treatment dropout. For the PMI analyses, the average PHDD for the placebo group (across the treatment period) was imputed as the PHDD for each missing value after treatment dropout. For the missing=heavy drinking analyses, subjects were assumed to be heavy drinking on every day after treatment dropout, thus PHDD=100% was imputed for each month after treatment dropout. For the MI condition, we created 50 different imputed datasets and then combined them using a pooled estimate of the treatment effect. For the FIML analyses, the variance-covariance matrix for all available data was analyzed. For both MI and FIML, “auxiliary variables” can be included to increase the precision of the estimated parameters (see details in Hallgren & Witkiewitz, 2013). In the current study we included alcohol dependence severity (as measured by the ADS; Skinner & Horn, 1984) and age as auxiliary variables. These variables were selected because they were included in our prior simulation study of missing data methods in alcohol clinical trials (Hallgren & Witkiewitz, 2013) and because they were associated with missingness.
Results
Based on the observed data from the full sample, individuals who dropped out of treatment, including Treatment Dropouts and those Lost to Follow-Up (provided for comparison purposes only) generally engaged in more frequent heavy drinking during each month compared to those who continued in treatment (Table 2). Subjects who were assigned to placebo naltrexone and dropped out of treatment engaged in the most frequent heavy drinking. Surprisingly, the effect size (Cohen's d) of naltrexone was larger in subjects who dropped out of treatment than those who continued in treatment.
Table 2.
Average Percent Heavy Drinking Days (PHDD) by Treatment Group and Treatment Dropout Status. Dropouts here are defined as those who stopped treatment but continued to provide drinking data through the end of the treatment trial (16 weeks). Lost to Follow-Up were those who stopped treatment and did not provide further drinking data. The Loss to Follow-Up group is provided for comparison purposes only.
| PHDD | Month 0 M (SD) |
Month 1 M (SD) |
Month 2 M (SD) |
Month 3 M (SD) |
Month 4 M (SD) |
|---|---|---|---|---|---|
|
|
|||||
| Completers | (n=967) | (n=967) | (n=967) | (n=965) | (n=961) |
| Naltrexone | 65.54 (28.4) n=479 | 9.87 (11.2) n=479 | 11.53 (20.9) n=479 | 10.48 (21.2) n=478 | 9.55 (20.3) n=476 |
| Placebo Naltrexone | 66.20 (28.4) n=488 | 11.23 (20.2) n=488 | 13.46 (23.3) n=488 | 12.99 (22.8) n=487 | 14.20 (25.0) n=485 |
| Cohen's d | -0.02 | 0.08 | 0.09 | 0.11 | 0.20 |
|
| |||||
| Dropouts | (n=234) | (n=233) | (n=212) | (n=196) | (n=185) |
| Naltrexone | 66.25 (28.6) n=121 | 18.45 (27.9) n=121 | 27.52 (34.5) n=110 | 28.89 (34.9) n=103 | 31.96 (37.6) n=97 |
| Placebo Naltrexone | 67.02 (28.8) n=113 | 19.05 (23.9) n=112 | 33.50 (37.2) n=102 | 41.75 (38.8) n=93 | 43.95 (40.5) n=88 |
| Cohen's d | -0.02 | 0.02 | 0.17 | 0.35 | 0.31 |
|
| |||||
| Lost to Follow-up | (n=24) | (n=19) | (n=2) | ||
| Naltrexone | 71.67 (29.8) n=14 | 20.53(23.8) n=11 | 16.67 (--) n=1 | -- | -- |
| Placebo Naltrexone | 52.33 (33.2) n=10 | 11.70 (15.3) n=8 | 3.57 (--) n=1 | -- | -- |
| Cohen's d | -0.87 | -0.44 | -- | ||
Note. -- Data not available.
Treatment Completer and Dropout Sample (n = 1146)
The observed effect of naltrexone on PHDD in the sample composed of subjects who completed and dropped out of treatment (Treatment Completer and Dropout - Complete), which represents the mean difference in PHDD for the naltrexone condition compared to the placebo-naltrexone condition (with negative values favoring naltrexone), was statistically significant (B (SE) = -3.37 (1.34), p = 0.01; Cohen's d = -0.16) (Table 3). We then deleted the data (i.e., set the data to be missing) from those who dropped out (n = 185) of treatment after the time of dropout (Treatment Completer and Dropout - Deleted) and re-estimated the effect of naltrexone during treatment using the six missing data analysis strategies described above within the context of a mixed effects model. The FIML and MI approaches most closely approximated the true effect observed in the full sample, although both approaches slightly underestimated the standard error and yielded slightly larger Cohen's d effect sizes. The PMI approach was next closest to the true effect, but also underestimated the standard error and yielded a larger Cohen's d effect size. Cohen's d effect sizes were greatly underestimated using LOCF, BOCF, and missing=heavy drinking, with missing=heavy drinking having the most biased treatment effect estimate and standard error. The standard error for LOCF was nearest to the true standard error, while the BOCF and missing=heavy drinking over-estimated the standard error.
Table 3.
Mixed Model of Percent Heavy Drinking Days during Treatment for Naltrexone vs. Placebo Naltrexone among Treatment Completers and Dropouts (n = 1146) who completed all drinking assessments (Treatment Completers and Dropouts - Complete) and with post dropout drinking reports set to missing among Treatment Dropouts (Treatment Completers and Dropouts - Deleted)
| Percent heavy drinking days (PHDD) | N | Regression Estimate | SE | p-value | Cohen's d |
|---|---|---|---|---|---|
| Completers and Dropouts - Complete | 1146 | -3.368 | 1.338 | 0.012 | -0.16 |
|
| |||||
| Missing Data Analyses with Treatment Completers and Dropouts - Deleted | |||||
| N | Estimate | SE | p-value | Cohen's d | |
| Full information maximum likelihood (FIML) | 1146 | -3.402 | 1.201 | 0.005 | -0.18 |
| Multiple imputation (MI) | 1146 | -3.282 | 1.104 | 0.003 | -0.19 |
| Baseline observation carried forward | 1146 | -2.172 | 1.448 | 0.134 | -0.09 |
| Last observation carried forward | 1146 | -2.470 | 1.355 | 0.068 | -0.11 |
| Placebo mean imputation | 1146 | -2.889 | 1.070 | 0.007 | -0.17 |
| Missing = heavy drinking | 1146 | -1.216 | 1.758 | 0.489 | -0.04 |
Note. The “Estimate” is the unstandardized regression estimate with placebo naltrexone coded 0 and the naltrexone coded 1 and thus represents the difference between groups on percent heavy drinking days.
Figure 1 graphically depicts the unstandardized estimate (with error bars representing ± 1 standard error) of the actual treatment effect among the Treatment Completers and Dropouts -Complete dataset (i.e., “Actual Effect”) compared to the treatment effects among the “Deleted Group” (i.e., treatment dropouts with drinking data set to missing) using the various approaches for handling missing data. As already noted, the estimates for FIML, MI and PMI came closest to the actual treatment effect estimate (shown by the horizontal dashed line) and the standard error intervals for the BOCF and LOCF models contain the actual treatment effect estimate. Notably the missing=heavy drinking estimate standard error interval does not contain the actual treatment effect estimate.
Figure 1.
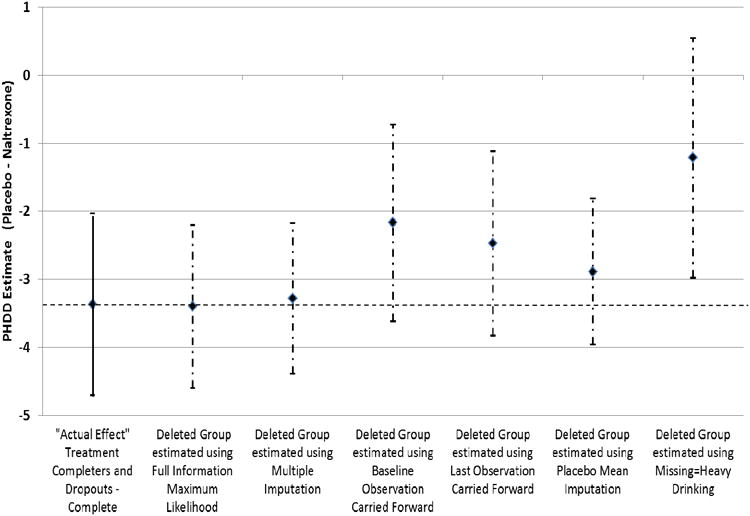
Estimates from the mixed model of percent heavy drinking days in treatment completers and treatment dropouts (“Actual Effect” among Completers and Dropouts – Complete; n = 1146; solid line) and for the data from the treatment dropouts where post dropout drinking data was set to missing (“Deleted Group” Completers and Dropouts – Deleted; dashed-dotted line) using missing data methods (standard error bars based on the data in Table 3). The dashed horizontal line represents “true” (i.e., “actual effect”) placebo-naltrexone difference based on the Treatment Completers and Dropouts – Complete sample.
Treatment Dropout Sample (n = 185)
As seen in Table 4, the observed effect (unstandardized regression estimate) of naltrexone on PHDD in the Treatment Dropout Only sample composed of subjects who dropped out of treatment (Treatment Dropout Only - Complete) was larger than the effect of naltrexone in the full sample, however the standard error was also larger and the overall treatment effect was not statistically significant (B (SE) = -8.89 (4.64), p = 0.06; Cohen's d = - 0.29). We then deleted the data from those who dropped out of treatment after the time of dropout (Treatment Dropouts Only - Deleted) and re-estimated the effect of naltrexone on PHDD during treatment using the six missing data analysis strategies described above within the context of a mixed effects model. The FIML and MI approach most closely approximated the true effect (unstandardized regression estimate) observed in the full dropouts only sample, although both approaches slightly underestimated the standard error leading to a larger Cohen's d effect size in these missing data conditions. All other missing data approaches except PMI greatly underestimated the true effect (unstandardized regression estimate), with missing=heavy drinking performing the worst. The standard errors for BOCF, PMI, and missing=heavy drinking were underestimated, while the standard error was over-estimated for the LOCF model. The standard error using the PMI approach was particularly underestimated, which resulted in the largest Cohen's d effect size.
Table 4.
Mixed Model of Percent Heavy Drinking Days (PHDD) during Treatment from Naltrexone vs. Placebo Naltrexone among Treatment Dropouts (n = 185) who completed all drinking assessments (Treatment Dropouts Only - Complete) with post dropout drinking reports set to missing (Treatment Dropouts Only - Deleted).
| Percent Heavy drinking days (PHDD) | N | Regression Estimate | SE | p-value | Cohen's d |
|---|---|---|---|---|---|
| Treatment Dropouts Only - Complete | 185 | -8.890 | 4.637 | 0.055 | -0.29 |
|
| |||||
| Missing Data Analyses with Data Set to Missing (Treatment Dropouts Only - Deleted) | |||||
| N | Estimate | SE | p-value | Cohen's d | |
| Full information maximum likelihood (FIML) | 185 | -8.448 | 4.450 | 0.058 | -0.36 |
| Multiple imputation (MI) | 185 | -8.484 | 3.454 | 0.014 | -0.38 |
| Baseline observation carried forward | 185 | -3.286 | 3.803 | 0.388 | -0.14 |
| Last observation carried forward | 185 | -3.317 | 4.827 | 0.492 | -0.10 |
| Placebo mean imputation | 185 | -4.461 | 1.930 | 0.021 | -0.42 |
| Missing = Heavy drinking | 185 | 0.343 | 3.540 | 0.923 | 0.02 |
Note. The “Estimate” is the unstandardized regression estimate with placebo naltrexone coded 0 and the naltrexone coded 1 and thus represents the difference between groups on percent heavy drinking days.
Figure 2 graphically depicts the unstandardized estimate (with error bars representing ± 1 standard error) of the actual treatment effect among the Treatment Dropouts Only - Complete data (i.e., “Actual Effect”) compared to the treatment effects among the “Deleted Group” (i.e., treatment dropouts with drinking data set to missing) using the various approaches for handling missing data. For the Treatment Dropouts Only sample, only FIML and MI contain the estimate of the true effect within one standard error of the estimate for those models. The true effect does not exist within the standard error of the estimate for the alternative missing data approaches.
Figure 2.
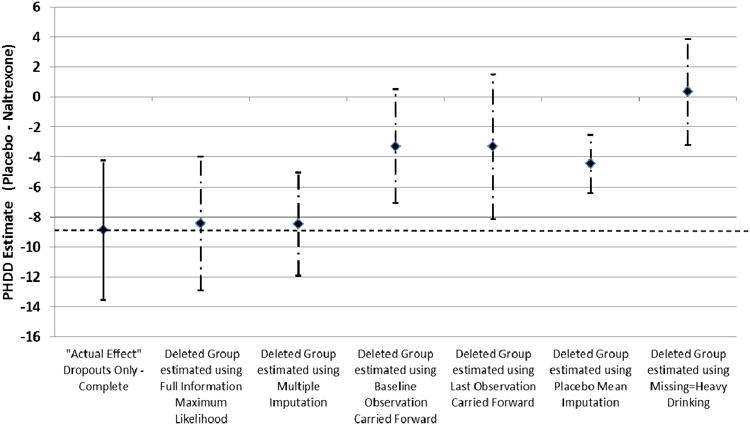
Estimates from mixed model of percent heavy drinking days among treatment dropouts (“Actual Effect” among Treatment Dropouts Only – Complete; n = 185; solid line) and for the data from the treatment dropouts where post dropout drinking data was set to missing (“Deleted Group” Treatment Dropouts Only – Deleted; dashed-dotted line) using missing data methods (standard error bars based on the data in Table 4). The dashed horizontal line represents “true” (i.e., “actual effect”) placebo-naltrexone difference based on the Treatment Completers and Dropouts – Complete sample.
Discussion
Treatment dropout is a considerable problem in alcohol clinical trials. Methods for handling missing data in the context of treatment dropout have been thoroughly evaluated in simulation studies (e.g., Hallgren and Witkiewitz, 2013), yet we are not aware of any studies that have examined the missing data effect of treatment dropout utilizing subjects who completed the research assessments after treatment dropout in an alcohol clinical trial. In the current study, we were able to examine the effect of different missing data methods in estimating the treatment effect among those who discontinued treatment by first estimating the observed effects of treatment among those who dropped out of treatment but who continued to participate in the research. We used six different methods to examine the effect of treatment on a commonly used continuous outcome, percent heavy drinking days, after manually deleting the data (set the data to be missing) for individuals who dropped out of treatment but continued to provide research data. Consistent with prior studies (Barnes et al., 2010; Hallgren and Witkiewitz, 2013; Hedden et al., 2009; Hedeker et al., 2007) and the recommendations of the National Research Council (2010), the results for the percent heavy drinking days outcome indicated that full information maximum likelihood (FIML) and multiple imputation (MI) methods most often produced estimates that were closest to the true observed estimates for individuals who dropped out of treatment but had all drinking data reported though the end of the study. Baseline observation carried forward (BOCF), last observation carried forward (LOCF), and missing=heavy drinking all underestimated the effect of treatment in the current analyses, while placebo mean imputation (PMI) overestimated the effect of treatment.
Both FIML and MI methods yielded estimates that were closer to the true effect for two sample sizes, the Treatment Completer and Dropout sample (n = 1146) and a reduced Treatment Dropout Only sample (n =185; including only treatment dropouts). Our prior simulation study (Hallgren & Witkiewitz, 2013) also found that the MI and FIML methods produced less biased estimates of alcohol treatment outcomes regardless of sample size and that a larger sample size does not protect against bias when using single imputation methods (e.g., LOCF; missing = heavy drinking). Importantly, we found both in the current study and in our prior work (Hallgren & Witkiewitz, 2013) that MI and FIML produced similar standard errors and seemed to perform equally well in recovering the truth, which is inconsistent with prior studies that have found MI to produce biased estimates when distributional assumptions are violated, particularly for smaller sample sizes (Demirtas et al., 2008; Yuan et al., 2012).
Although many previous studies have similarly shown MI and FIML to produce greater accuracy than the alternative methods tested here, a limitation of those studies is that they have typically used simulated data or real-world treatment data from individuals who have completed treatment, which may not account for the nuances or differences in outcomes that would be observed among participants who actually stop completing follow-up assessments or who drop out of treatment in clinical trials. Although it would be impossible to know the drinking outcomes of individuals who stopped providing follow-up assessment data in the COMBINE study, the drinking outcomes for those who stopped participating in treatment but contributed follow-up drinking data represented a group of participants that were likely to more closely approximate the individuals who drop out from alcohol clinical trials completely (i.e., drop out of treatment and stop providing follow-up data). While not the primary focus of this analysis, we did observe that certain pre-study variables influenced the chance of dropping out or being lost to follow-up that reflected the characteristics of individuals who are less likely to provide follow-up data in other alcohol clinical trials (Palmer et al., 2009). Those who dropped out were more likely to be Alaska Native or Hispanic, not married, less educated, and have a more severe alcohol problem. This is not unexpected since social stability and having economic and social resources are more likely to provide support for study participation. However, the baseline frequency of heavy drinking days itself did not differ in treatment completers or dropouts.
Limitations and Conclusions
The current study was unique in its focus on treatment dropouts; however, these individuals completed the research assessments and thus did not drop out completely from the alcohol clinical trial The number of individuals who were “lost to follow-up,” dropped out of treatment, and did not provide drinking data (i.e., research dropouts) from the COMBINE study was too small (n = 24) to conduct analyses, especially considering that most of the research dropout occurred in the first month, thus they provided very little data to estimate the effects of treatment in a mixed modeling framework. The lack of data in this group is expected (they were lost to follow-up) and also unfortunate because researchers may be most interested in examining the missing data methods among research dropouts who are lost to follow-up. Nonetheless, the treatment dropout group (which consisted of individuals who dropped out of treatment and provided complete drinking data) is our best proxy for the research dropout group (who were lost to follow-up). We did not find significant differences between the two groups of dropouts (treatment dropouts who provide complete data and research dropouts who provide no follow-up data) on demographic measures, other than age, and no differences existed on measures of alcohol dependence severity or PHDD at baseline.
In cases of research dropout it is impossible to know the individuals' reasons for dropout or their drinking behavior after they drop out. However, the results from the current study show that the treatment dropouts were drinking heavily on more days than the treatment completers, so by extrapolation, it may be that the research dropouts may have even worse outcomes. Yet it is important to note that this is an untestable assumption and automatically assuming research dropouts are treatment failures has been discouraged (Arndt, 2009).
Although the current study assessed six missing data methods, other approaches exist and may be of equal value. For example, pattern mixture models and weighted estimating equations have been recommended for use with missing data in clinical trials (National Research Council, 2010) and could have performed better than the methods used in the current study. We chose the six methods based on our observation that they are commonly used in applied research (Del Re et al., 2013). One of most commonly applied missing data approaches, assuming that missing days=heavy drinking days (i.e., the worst case scenario), performed the worst in the current study using percent heavy drinking days as an outcome and was also the most biased of all of the missing data approaches in our prior simulation study that used the same outcome (Hallgren and Witkiewitz, 2013). Importantly the current study (and our prior simulation study) focused solely on PHDD as a continuous outcome and it is unclear how the different missing data approaches will perform with a binary outcome (e.g., percent subjects with no heavy drinking days, Falk et al., 2010) and how the missing data approaches will perform with alternative continuous and binary outcomes (e.g., percent days abstinent, any drinking). However other research has consistently found similar problems with assuming missing = heavy drinking or last observation carried forward for binary outcomes in other contexts (Barnes et al., 2010; Hedeker et al., 2007)
The COMBINE Study included substantial efforts to minimize missing drinking data, even among those who dropped out of treatment (Anton et al., 2005, 2006) and differs from most alcohol clinical trials, in which participant attrition is more common and a greater amount of missing drinking data is encountered. Reported here and elsewhere, there are several methods for handling data that inevitably are missing and need to be accounted for in outcome analyses. Importantly, the FIML and MI methods are increasingly available in many popular software programs. While minimizing missing drinking data should be a primary objective in alcohol clinical trials, consistent with many prior reports (Little et al., 2012; Mallinckrodt et al., 2008; Schafer & Graham, 2002), we strongly urge researchers to consider implementing the missing data techniques found most effective in this report in analyses of treatment effects in alcohol clinical trials. Further, we encourage journal reviewers and editors to insist on the use of proper statistical techniques for handling missing data and to avoid publication of manuscripts that use inferior methods, including the single imputation methods discussed in this paper.
Acknowledgments
In addition to the authors, the following individuals are or were members of the ACTIVE Workgroup and provided intellectual input into this manuscript during attendance at workgroup meetings.
Karl Mann, M.D., Central Institute of Mental Health, Mannheim, Germany
David McCann, Ph.D., NIDA
Didier Meulien, MD, Lundbeck
Roger Meyer, M.D., Penn State Hershey Medical Center
Charles O'Brien, M.D., Ph.D., University of Pennsylvania
Thomas Permutt, Ph.D., FDA
Rebecca Robinson, M.S., Eli Lilly & Company
Lars Torup, Ph.D., Lundbeck
Celia Winchell, M.D., FDA
Conrad Wong, Ph.D., Eli Lilly & Company
Beatrice Rendenbach-Mueller, Ph.D., Abbvie
Bernard Silverman, M.D., Alkermes
Jennifer Hammond, M.D., Pfizer
Sarah Timm (ASCP Staff) has provided important administrative support to the ACTIVE workgroup.
This research was supported by a grant from the National Institute on Alcohol Abuse and Alcoholism (1R01 AA022328-01, Witkiewitz (PI)).
References
- Anton RF, Randall CL. Measurement and choice of drinking outcome variables in the COMBINE Study. Journal of Studies on Alcohol - Supplement. 2005;15:104–109. doi: 10.15288/jsas.2005.s15.104. [DOI] [PubMed] [Google Scholar]
- Anton RF, O'Malley SS, Ciraulo DA, Cisler RA, Couper D, Donovan DM, Gastfriend DR, Hosking JD, Johnson BA, LoCastro JS, Longabaugh R, Mason BJ, Mattson ME, Miller WR, Pettinati HM, Randall CL, Swift R, Weiss RD, Williams LD, Zweben A. Combined pharmacotherapies and behavioral interventions for alcohol dependence: the COMBINE study: a randomized controlled trial. JAMA. 2006;295:2003–2017. doi: 10.1001/jama.295.17.2003. [DOI] [PubMed] [Google Scholar]
- Arndt S. Stereotyping and the treatment of missing data for drug and alcohol clinical trials. Subst Abuse Treat Prev Policy. 2009;4:2. doi: 10.1186/1747-597X-4-2. [DOI] [PMC free article] [PubMed] [Google Scholar]
- Barnes SA, Larsen MD, Schroeder D, Hanson A, Decker PA. Missing data assumptions and methods in a smoking cessation study. Addiction. 2010;105:431–437. doi: 10.1111/j.1360-0443.2009.02809.x. [DOI] [PubMed] [Google Scholar]
- COMBINE Study Research Group. Testing combined pharmacotherapies and behavioral interventions in alcohol dependence: rationale and methods. Alcohol Clin Exp Res. 2003;27:1107–1122. doi: 10.1097/00000374-200307000-00011. [DOI] [PubMed] [Google Scholar]
- Demirtas H, Freels SA, Yucel RM. Plausibility of multivariate normality assumption when multiply imputing non-Gaussian continuous outcomes: A simulation assessment. J Stat Comput Simul. 2012;78:69–84. [Google Scholar]
- Del Re AC, Maisel NC, Blodgett JC, Finney JW. Intention to treat analyses and missing data approaches in pharmacotherapy trials for alcohol use disorders. BMJ Open. 2013;3(11):e003464. doi: 10.1136/bmjopen-2013-003464. [DOI] [PMC free article] [PubMed] [Google Scholar]
- Elbreder MF, de Souza e Silva R, Pillon SC, Laranjeira R. Alcohol dependence: Analysis of factors associated with retention of patients in outpatient treatment. Alcohol Alcohol. 2011;46:74–76. doi: 10.1093/alcalc/agq078. [DOI] [PubMed] [Google Scholar]
- Falk D, Wang XQ, Liu L, Fertig J, Mattson M, Ryan M, Johnson B, Stout R, Litten RZ. Percentage of subjects with no heavy drinking days: evaluation as an efficacy endpoint for alcohol clinical trials. Alcohol Clin Exp Res. 2010;34:2022–2034. doi: 10.1111/j.1530-0277.2010.01290.x. [DOI] [PubMed] [Google Scholar]
- Fertig J, Ryan ML, Falk DE, Litten RZ, Mattson ME, Ransom J, Rickman WJ, Scott C, Ciraulo D, Green AI, Tiouririne NA, Johnson B, Pettinati H, Strain EC, Devine E, Brunette MF, Kampman K, A Tompkins D, Stout R NCIG 002 Study Group. A double-blind placebo-controlled trial assessing the efficacy of levetiracetam extended-release in very heavy drinking alcohol-dependent patients. Alcohol Clin Exp Res. 2012;36:1421–1430. doi: 10.1111/j.1530-0277.2011.01716.x. [DOI] [PMC free article] [PubMed] [Google Scholar]
- FDA. Medical Review of Vivitrol. US Government; Rockville, Maryland: 2006. pp. 21–897. [Google Scholar]
- Gueorguieva R, Wu R, Krystal JH, Donovan DM, O'Malley SS. Temporal patterns of adherence to medications and behavioral treatment and their relationship to patient characteristics and treatment response. Addict Behav. 2013;38(5):2119–2127. doi: 10.1016/j.addbeh.2013.01.024. [DOI] [PMC free article] [PubMed] [Google Scholar]
- Hallgren KA, Witkiewitz K. Missing data in alcohol clinical trials: A comparison of methods. Alcohol Clin Exp Res. 2013;37:2152–2160. doi: 10.1111/acer.12205. [DOI] [PMC free article] [PubMed] [Google Scholar]
- Hedeker D, Mermelstein RJ, Demirtas H. Analysis of binary outcomes with missing data: missing = smoking, last observation carried forward, and a little multiple imputation. Addiction. 2007;102:1564–1573. doi: 10.1111/j.1360-0443.2007.01946.x. [DOI] [PubMed] [Google Scholar]
- Hedden SL, Woolson RF, Carter RE, Palesch Y, Upadhyaya HP, Malcolm RJ. The impact of loss to follow-up on hypothesis tests of the treatment effect for several statistical methods in substance abuse clinical trials. J Subst Abuse Treat. 2009;37:54–63. doi: 10.1016/j.jsat.2008.09.011. [DOI] [PMC free article] [PubMed] [Google Scholar]
- Litten RZ, Ryan ML, Fertig JB, Falk DE, Johnson B, Dunn KE, Green AI, Pettinati HM, Ciraulo DA, Sarid-Segal O, Kampman K, Brunette MF, Strain EC, Tiouririne NA, Ransom J, Scott C, Stout R NCIG Study Group. A double-blind, placebo-controlled trial assessing the efficacy of varenicline tartrate for alcohol dependence. J Addict Med. 2013;7:277–286. doi: 10.1097/ADM.0b013e31829623f4. [DOI] [PMC free article] [PubMed] [Google Scholar]
- Little RA, D'Agostino R, Cohen ML, Dickersin K, Emerson SS, Farrar JT, Frangakis C, Hogan JW, Molenberghs G, Murphy SA, Neaton JD, Rotnitzky A, Scharfstein D, Shih WJ, Siegel JP, Stern H. The prevention and treatment of missing data in clinical trials. N Engl J Med. 2012;367:1355–1360. doi: 10.1056/NEJMsr1203730. [DOI] [PMC free article] [PubMed] [Google Scholar]
- Little RA, Rubin DB. Statistical Analysis with Missing Data. 2nd. Wiley; New York: 2002. [Google Scholar]
- Mallinckrodt CH, Lane PW, Schnell D, Peng Y, Mancuso JP. Recommendations for the primary analysis of continuous endpoints in longitudinal clinical trials. Drug Inf J. 2008;42:303–319. [Google Scholar]
- McKellar J, Kelly J, Harris A, Moos R. Pretreatment and during treatment risk factors for dropout among patients with substance use disorders. Addic Behav. 2006;31:450–460. doi: 10.1016/j.addbeh.2005.05.024. [DOI] [PubMed] [Google Scholar]
- Miller WR, Del Boca FK. Measurement of drinking behavior using the Form 90 family of instruments. J Stud Alcohol Suppl. 1994;12:112–118. doi: 10.15288/jsas.1994.s12.112. [DOI] [PubMed] [Google Scholar]
- Muthén LK, Muthén B. Mplus Users Guide. 7th. Muthén & Muthén; Los Angeles, CA: 2012. [Google Scholar]
- National Research Council. Washington, DC: National Academies Press; 2010. The prevention and treatment of missing data in clinical trials. http://www.nap.edu/catalog.php?recordid-12955. [PubMed] [Google Scholar]
- Nich C, Carroll KM. Intention-to-treat meets missing data: Implications of alternate strategies for analyzing clinical trials data. Drug Alcohol Depend. 2002;68:121–130. doi: 10.1016/s0376-8716(02)00111-4. [DOI] [PMC free article] [PubMed] [Google Scholar]
- Palmer RS, Murphy MK, Piselli A, Ball SA. Substance user treatment dropout from client and clinician perspectives: A pilot study. Subst Use Misuse. 2009;44:1021–1038. doi: 10.1080/10826080802495237. [DOI] [PMC free article] [PubMed] [Google Scholar]
- Roy A, Bhaumik DK, Aryal S, Gibbons RD. Sample size determination for hierarchical longitudinal designs with differential attrition rates. Biometrics. 2007;63:699–707. doi: 10.1111/j.1541-0420.2007.00769.x. [DOI] [PubMed] [Google Scholar]
- Rubin DB. Inference and missing data. Biometrika. 1976;63:581–592. [Google Scholar]
- Schafer JL, Graham JW. Missing data: our view of the state of the art. Psychol Methods. 2002;7:147–177. [PubMed] [Google Scholar]
- Skinner HA, Horn JL. Alcohol Dependence Scale: Users Guide. Toronto, Canada: Addiction Research Foundation; 1984. [Google Scholar]
- Tull MT, Gratz KL. The impact of borderline personality disorder on residential substance abuse treatment dropout among men. Drug Alcohol Depend. 2012;121:97–102. doi: 10.1016/j.drugalcdep.2011.08.014. [DOI] [PMC free article] [PubMed] [Google Scholar]
- Yuan KH, Yang-Wallentin F, Bentler PM. ML versus MI for missing data with violation of distribution conditions. Sociol Methods Res. 2012;41:598–629. doi: 10.1177/0049124112460373. [DOI] [PMC free article] [PubMed] [Google Scholar]