

Abstract
Purpose
Demonstrate the applicability of natural D-glucose as a T2 MRI contrast agent.
Methods
D-glucose solutions were prepared at multiple concentrations and variable pH. The relaxation rate (R2 = 1/T2) was measured at 3, 7, and 11.7T. Additional experiments were performed on blood at 11.7 T. Also, a mouse was infused with D-glucose (3.0 mmol/kg) and dynamic T2 weighted images of the abdomen acquired.
Results
The transverse relaxation rate depended strongly on glucose concentration and solution pH. A maximum change in R2 was observed around physiological pH (pH 6.8-7.8). The transverse relaxivities at 22°C (pH 7.3) were 0.021, 0.060, and 0.077 s-1mM-1 at 3.0, 7.0, and 11.7T, respectively. These values showed good agreement with expected values from the Swift-Connick equation. There was no significant dependence on glucose concentration or pH for T1 and the diffusion coefficient for these solutions. The transverse relaxivity in blood at 11.7 T was 0.09 s-1mM-1. The dynamic in vivo experiment showed a 10% drop in signal intensity after glucose infusion followed by recovery of the signal intensity after about 50-100 s.
Conclusion
Glucose can be used as a T2 contrast agent for MRI at concentrations that are already approved for human use.
Keywords: MRI contrast agent, transverse relaxation, T2, glucose, T2-exchange
Introduction
MRI contrast agents are used to enhance the signal difference between a region of interest and the background. Most exogenous MRI contrast agents in clinical use are chelates of paramagnetic materials that, primarily via the magnetic dipolar interactions between the water protons and the paramagnetic center, enhance the relaxation (both longitudinal and transverse). The chemical exchange of protons (note that here and below we are referring to the hydrogen atoms) between solute molecules and the bulk water proton pool can also affect the transverse relaxation rate (R2 = 1/T2) of the large bulk water resonance [1,2]. This process stochastically transfers nuclear spins between magnetic environments with different chemical shifts. The different precession frequency in each magnetic environment results in a nuclear spin accumulating a different phase depending on which magnetic environment it is in. For individual spins, unpredictable jumps between magnetic environments result in an incoherent summation of phases over the whole spin-ensemble and thus enhanced transverse relaxation.
Independent of concentration, the magnitude of the transverse relaxation enhancement due to exchange (the relaxivity, r2ex) depends critically on whether the exchange process is slow, intermediate, or fast on the NMR time scale. Among these regimes, the enhancement is greatest when the rate of exchange (kex) is equal to the chemical shift difference between the two exchanging sites (Δω)
| (1) |
The magnitude of the relaxation enhancement reduces if the rate of exchange is slow (infrequent jumps between magnetic environments result in a less random distribution of phases) or fast (the spins have no time to accumulate a significant phase difference between jumps and only an average phase is measured).
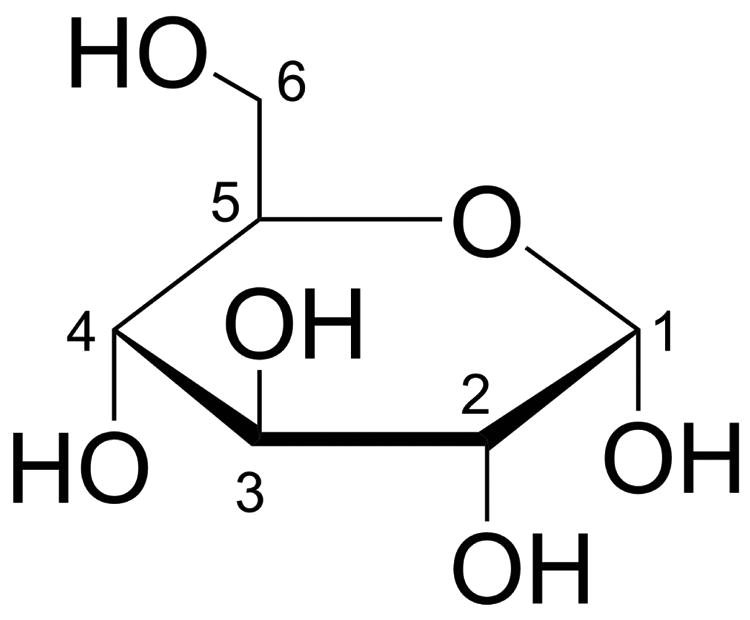
Previously, the exchangeable protons in paramagnetic [3,4] and select diamagnetic [5,6] substances have been shown to generate some additional MRI contrast. Here we show that simple natural D-glucose, with its 5 exchangeable hydroxyl protons (Figure 1), is an excellent T2 contrast agent that is ideally suited for use in the physiological pH range at human MRI field strengths.
Figure 1. Haworth projection of D-glucose.
Methods
In vitro experiments
D-glucose was dissolved in phosphate buffered saline (PBS) at concentrations of 1, 3, 5, 10, 20 mM and the pH adjusted to 7.3. In addition, a group of 10 mM glucose solutions were prepared with pH values of 6.3, 6.8, 7.8, and 8.3. Each solution was placed in a 5 mm NMR tube and imaged at 3 T and 7 T on human MRI scanners (Philips Healthcare, Best, The Netherlands) and at 11.7 T on a pre-clinical animal scanner (Bruker, Ettlingen, Germany) at 22°C. R2 measurements were made on these solutions using a Carr-Purcell-Meiboom-Gill (CPMG) preparation period followed by a fast spin-echo imaging (FSE) readout. The inter-echo time delay τCMPG was fixed at 20 ms while the number of pulses was varied between 4-24 to determine the relaxation rate from the echo time dependence of the signal intensity at constant inter-echo spacing. The single-shot FSE readouts at 3 T and 7 T consisted of 64 × 64 imaging matrices across a field of view (FOV) of 45 mm × 45 mm and a slice thickness of 5 mm. A multi-shot FSE readout was used at 11.7 T with an imaging matrix of 64 × 64 across a 50 mm × 40 mm FOV and 5 mm slice thickness. The echo train length (ETL) at 11.7 T was 16. The pre-scan delay before each preparation period was 15 s (>5 × T1). To check for changes in viscosity with increasing glucose concentration, which can also affect transverse relaxation, the longitudinal relaxation rate and translational diffusion coefficient were also measured using inversion recovery and diffusion-weighted Imaging (DWI) sequences respectively.
Additional transverse relaxation experiments were performed on fresh bovine blood samples obtained from a local abattoir. The anticoagulant trisodium citrate was added to give a final concentration of 25 mM. Erythrocytes were prepared by centrifuging the whole blood at 10,000g for 15 minutes and then recombining to a hematocrit fraction (Hct) of 0.42. To avoid sedimentation of erythrocytes, the blood was circulated in a perfusion apparatus at 30 mL/min. The temperature was controlled at 37°C using a water bath. The blood oxygenation was prepared at Y=1.0 with the blood being sampled right before and after each MR measurement for Hct, oxygenation, and glucose concentration using a blood gas analyzer (Radiometer ABL 700 series, Copenhagen, Denmark). Blood glucose concentrations were varied with the addition of 0.5 mL of D-glucose (0.5 M in saline) prior to each R2 measurement. Blood pCO2 values were also measured and were within the physiological range (32.7-34.8 mmHg). Blood experiments were performed on a 500 MHz Bruker Avance spectrometer equipped with a micro2.5 probe. Each R2 measurement was acquired using a CPMG pulse train (τCMPG = 5 ms) followed by a free induction decay (FID).
In vivo experiments
Experiments were performed in accordance with Institutional Animal Care and Use Committee guidelines. An adult female BALB/c mouse, approximately 8-10 weeks old, was anesthetized by isoflurane and kept warm with a heating pad. The tail vein was cannulated for administration of glucose. A home-built catheter was connected to a syringe pump for glucose infusion through PE-50 tubing. 0.15 mL of D-glucose (0.5 M in saline) was administered over a 10 s duration with a dose of (3.0 mmol/kg).
T2 weighted FSE images were acquired on a Bruker 11.7 T Bruker Biospec preclinical animal scanner equipped with a 23 mm diameter transceiver coil. The T2 preparation period consisted of a 16 element CPMG pulse train with tCPMG = 20 ms. The FSE readout parameters were TR/TE = 5000 / 6.6 ms, a 96 × 64 acquisition matrix with ETL = 8 across a FOV of 23 × 19 mm and slice thickness of 1 mm. The acquisition time for each T2-weighted image was 25 s.
Results
Figure 2 shows fast spin echo (FSE) images of glucose phantoms acquired after the CPMG preparation period for two different echo times. In these images, it is clear that there is less signal at the longer echo time and that the signal decay is greatest for the tubes with higher glucose concentration. The decrease in signal intensity ranged from 18% (0 mM) - 24% (20 mM) at 3 T, 15% (0 mM) - 42% (20 mM) at 7 T, and 14% (0 mM) - 48% (20 mM) at 11.7 T. The R2 was measured for each tube and the results (shown in Figure 3a) show a clear linear relationship between glucose concentration and R2. To compare the D-glucose relaxivity (r2ex,glc) between magnetic field strengths, we fitted the data in Figure 3a with:
Figure 2.
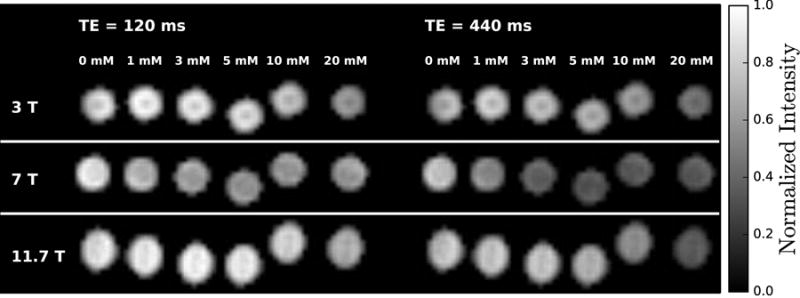
Fast spin-echo images of glucose solutions at 3, 7, and 11.7 T measured at 22°C. The images were acquired after a CPMG preparation period with two different echo times (TE). The scale reflects the signal intensity in each voxel normalized by the maximum intensity at each field.
Figure 3.
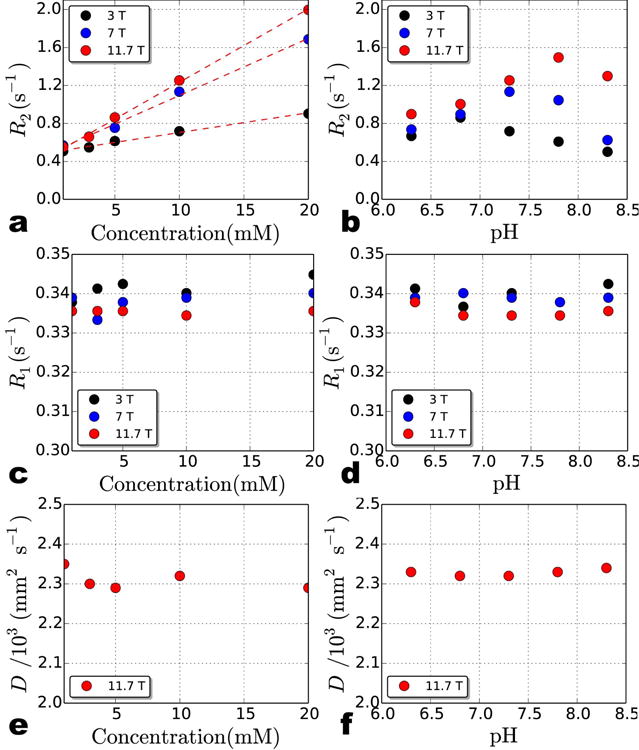
Transverse relaxation rate, R2 (a-b), longitudinal relaxation rate, R1 (c-d), and translational diffusion coefficient, D (e-f) for D-glucose solutions at 3 T, 7 T, and 11.7 T measured at 22°C. The concentration dependence of R2 over this low concentration (mM) range (and pH = 7.3) is linear (a) but the pH dependence of 10 mM glucose is not (b). Even though the highest R2 is observed around the physiological pH range (∼7.3), the maximum for each field strength occurs at a slightly different pH value. The results indicate that there is no obvious dependence between R1 and concentration (c) or pH (d) or D and concentration (e) or pH (f) over the range measured here. D for each solution was only measured at 11.7 T.
| (2) |
Here we assume the total relaxivity (r2tot) for glucose (a diamagnetic compound) at low concentrations can be approximated by r2ex,glc. The results, listed in Table 1, show that r2ex,glc is almost three times larger at 7 T compared to 3 T, while there is only a small increase (28%) from 7 T to 11.7 T. For the glucose solutions at different pH, the relationship between pH and R2 is more complicated. As shown in Figure 3b, at every field strength, R2 initially increases with pH until it reaches a peak and then begins to drop. The peak R2 occurs at higher pH for higher magnetic field strengths.
Table 1.
Transverse relaxivity of D-glucose (pH = 7.3) at different field strengths. The values at 22°C were experimentally measured while the values at 37°C were predicted using the Arrhenius and Swift-Connick equations. *r2ex,glc for blood at 37°C was experimentally measured.
| Field (T) | r2ex,glc (s-1 mM-1) | |
|---|---|---|
| 22°C | 37°C | |
| 3.0 | 0.021 ± 0.008 | 0.012 |
| 7.0 | 0.060 ± 0.002 | 0.053 |
| 11.7 (in PBS) | 0.077 ± 0.001 | 0.102 |
| 11.7 (in blood)* | 0.086 ± 0.001 | |
Increases in glucose concentration can change solution viscosity [7] and subsequently affect R2. Solution viscosity also manifests itself in measurements of the longitudinal relaxation rate R1 (= 1/T1) and the translational diffusion coefficient D. To investigate whether the glucose concentration dependence of the R2 relaxation rates seen in Figure 3a may be due to changes in solution viscosity, we measured R1 and D for each solution. In Figure 3c-f, there is no obvious relationship between R1 or D with either glucose concentration or pH over the ranges measured here.
To further understand the relationship between glucose concentration or pH and the exchange contribution to R2 (R2ex), we analyzed the transverse relaxation data using the Swift-Connick equation [8]:
| (3) |
where R2B is the transverse relaxation rate of the exchangeable solute proton and PB is the mole fraction of exchangeable protons. For the limiting case of Δω ≫ R2B, Eq. 3 reduces to:
| (4) |
Finally, by using a 1 mM concentration of glucose (PB = 5 mM exchangeable solute protons/110 M water protons), Eq. 4 can be expressed in terms of the transverse relaxivity (r2ex):
| (5) |
In Figure 4, we use Eq. 5 to generate three curves corresponding to 3, 7, and 11.7 T for a range of relevant exchange rates for –OH protons. Also, we fit the relaxivity values in Table 1 (closed circles in Fig. 4) with Eq. 5 to obtain the weighted average chemical shift and exchange rate for the five -OH protons in glucose. From the fitted data, we obtained kex = 2200 s-1 (1/kex = 4.5×10⁻⁴ s) and Δω = 1.44 ppm. To predict the relaxivity of glucose at 37°C, we estimated kex at 37°C using the Arrhenius equation :
Figure 4.

Transverse relaxivity (s-1 mM-1) as a function of the average bound lifetime (1/kex) of glucose protons at 3.0, 7.0, and 11.7 T. The curves are relaxivity values predicted by the Swift-Connick equation (Eq. 5) while the markers are the measured experimental transverse relaxivity at each field and 22°C. The position of the markers along the x-axis was adjusted to obtain the best fit for the experimental values with the predicted curves. The fitted values are kex = 2200 s-1 (1/kex = 4.5×10⁻⁴ s) and Δω = 1.44 ppm. The dashed line is the estimated exchange rate at 37°C calculated from the Arrhenius equation.
| (6) |
where Z is the frequency factor, Ea is the activation energy, R is the gas constant (8.314×10⁻³ kJ mol-1 K-1), and T is the temperature. Z was set to 2×10¹⁰ s-1 based on previously published data [9] and assumed to be constant over the range of temperatures discussed here. Ea was calculated to be 39.3 kJ mol-1 based on kex = 2200 s-1 at 22°C (295 K). Finally, at 37°C (310 K), kex was estimated to be 4600 s-1 (1/kex = 2.2×10⁻⁴ s). Using Eq. (5) and this kex value yields transverse relaxivities at physiological temperature of 0.01, 0.05, and 0.10 s-1 mM-1 at 3.0, 7.0, and 11.7 T respectively (see dashed line in Figure 4).
R2 measurements in blood at 37°C show a strong glucose concentration dependence (Figure 5). The transverse relaxivity in blood was 0.09 s-1 mM-1, which is close to our predicted value of 0.10 s-1 mM-1 above.
Figure 5.

Transverse relaxation measurements in blood as a function of glucose concentration at 11.7 T and 37°C. The transverse relaxivity measured for glucose in blood was 0.09 s-1 mM-1.
Figure 6 shows in vivo data from a dynamic contrast measurement on a mouse infused with 0.15 mL of 0.5 M glucose (3.0 mmol/kg). The T2-weighted signal intensity maps show a drop in signal intensity in the kidneys of about 10% following the bolus infusion. It takes approximately 50-100 s for the signal intensity to recover in the kidneys. Note that the images in Figure 6A are complete maps over an axial slice through the kidneys while the maps in Figure 6B were masked to show only the signal change over the kidneys.
Figure 6.
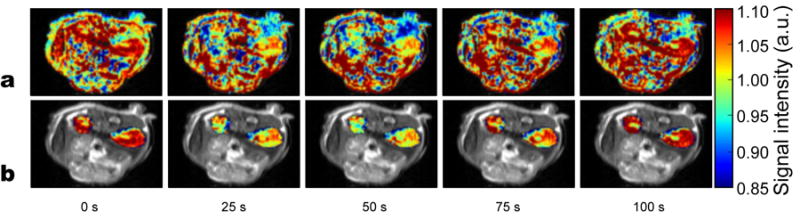
Transverse relaxation data from a dynamic in vivo glucose infusion experiment on a mouse. T2 weighted images of mouse kidneys from the time of a glucose bolus infusion are displayed (time indicated below each image). A) Effects in all regions displayed. B) Only kidney signal displayed in color on grayscale image to highlight effects. After infusion, the signal in the kidneys drops by about 10% and then recovers over the course of 50-100 seconds.
Discussion
The data in Figure 3a-b clearly demonstrate a strong concentration, pH, and magnetic field strength dependence for the water transverse relaxation rate (R2) of glucose solutions. The magnitude of the transverse relaxivity ranges from 0.021 s-1 mM-1 at 3 T to 0.077 s-1 mM-1 at 11.7 T (Table 1). Since there is no significant dependence between longitudinal relaxation rate and pH or concentration (Figure 3c-d) as well as between the translational diffusion coefficient and pH or concentration (Figure 3e-f), the changes in the transverse relaxation rate with concentration or pH are attributed to the exchangeable hydroxyl protons in glucose [1,2].
The experimental relaxivities correspond well with predicted values from the Swift-Connick equation (Eq. 5). From Figure 4, we can see that the relatively high r2ex,glc at 7 T is due to kex being ideally placed for maximum relaxivity at this field strength (i.e., in the intermediate exchange regime). The experiments here were performed at room temperature. In vivo, the temperature is approximately 37 °C and exchange rates will increase [10,11]. Using the Arrhenius equation, we estimated the exchange rate at 37 °C to be 4600 s-1 (1/kex = 2.2×10⁻⁴ s) which, via the relaxivity curves in Figure 4, yields a lower relaxivity at 3 T (from 0.02 to 0.01 s-1 mM-1), similar relaxivity at 7 T (from 0.06 to 0.05 s-1 mM-1), and higher relaxivity at 11.7 T (from 0.08 to 0.10 s-1 mM-1). The predicted relaxivity at 11.7 T (0.10 s-1 mM-1) is very close to the transverse relaxivity we measured in blood (0.09 s-1 mM-1). Figure 4 also explains the pH dependence of R2 in Figure 3b. Changes in pH result in different exchange rates for the exchangeable hydroxyl protons [11] and may also shift the resonance offset from water. Different exchange rates have different relaxivities that peak at higher kex with higher fields. Therefore variable kex and Δω, as described by Eq. 5, are responsible for the pH dependence of R2 seen in Figure 3b.
The results from the dynamic contrast in vivo experiment on a mouse show that it is possible to use glucose as a T2 MRI contrast agent. After the bolus, the signal intensity dropped by about 10% in the mouse kidneys after which it recovers.
The magnitude of the glucose transverse relaxivity at 7.0 T (0.06 s-1 mM-1) is similar to the transverse relaxivity created by the diamagnetic compound Iopamidol at 7.0 T (0.07 s-1 mM-1). Note, however that caution is required when comparing these two relaxivity values since our experiments were performed at room temperature and the previous Iopamidol study was carried out at 37°C [6]. The transverse relaxivity of glucose is much lower than some other types of exogeneous agents (e.g., ∼200 s-1 mM-1 for some superparamagnetic iron oxide nanoparticles [12]) but only a factor of 2-5 smaller in magnitude than some Eu3+ paramagnetic agents [3], the relaxivities of which range from 0.216 – 0.527 s-1 mM-1 at 9.4 T.
In addition to decreasing the bulk water signal through r2ex, it was recently shown that the exchangeable –OH protons in glucose can also be used to generate MRI contrast via the chemical exchange saturation transfer (CEST) effect [13,14]. This has great potential, for instance, to use this biodegradable agent for the study of cancer physiology. For CEST data analysis, the results presented here are important since they show that the transverse relaxivity needs to be normalized out from glucose CEST experiments to obtain the pure CEST effect [15]. Once this is accomplished, the CEST contrast will be different from the R2ex contrast since CEST contrast is frequency specific (depending on which –OH protons are being saturated) whereas T2 contrast is an average from all –OH protons in glucose. Additionally, CEST contrast does not always scale linearly with concentration (especially at higher concentrations due to back exchange). Consequently, both CEST and T2 images may provide different and complementary information depending on the study.
One caveat that is often mentioned for the use of sugar as a contrast agent is that it is rapidly metabolized. However, we see this biodegradable property as a great safety advantage compared to other contrast agents. In addition, the metabolism of glucose is sufficiently slow to allow its use for MRI contrast for MRI experiments on a typical clinical timescale. For instance, transport into the brain is on a timescale of about 10 minutes [16,17], while subsequent metabolism is even slower [18-21].
It should be possible to use the R2ex relaxation agent glucose for many of the purposes of the CEST agent glucose. In addition, similar to CEST, these relaxation principles can be extended to the use of sugar polymers such as glycogen and dextran as relaxation agents or combined relaxation/CEST agents. Recently, Li et al. [22] demonstrated the use of different sizes of dextran CEST agents for assessing tumor permeability. A similar application should be possible for relaxation too. On the other hand, from a purely clinical standpoint, the additional effect of relaxation may enhance the sensitivity of exchange-based agents and thus giving a better contrast. Thus we would like to speculate that sugars have a bright future as combined CEST/relaxation agents for human application.
Conclusion
The relaxation properties of D-glucose shown in this study indicate that it has potential for use as an exogenous T2 contrast agent for MRI at physiological pH. The five exchangeable hydroxyl protons of glucose are able to cause measurable changes in the transverse relaxation of water, even at the relatively low concentration of 10 mM, which is already allowed for human use for other purposes, such as the glucose tolerance test for diabetes. This work is a first step towards the use of sugars as biodegradable relaxation agents for MRI. We expect extension of these principles to the use of sugar polymers such as glycogen and dextran as relaxation agents.
Acknowledgments
Grant support from NIH: R01EB015032 (PvZ), R01EB012590 (MM), P50CA103175, P41EB015909, K25 HL121192 (QQ), and S10RR028955.
References
- 1.Jen J. Chemical Exchange and NMR-T2 Relaxation. Adv Mol Relax Int Pr. 1974;6:171–183. [Google Scholar]
- 2.Jen J. Chemical Exchange and NMR T2 Relaxation - Multisite Case. J Magn Reson. 1978;30:111–128. [Google Scholar]
- 3.Soesbe TC, Merritt ME, Green KN, Rojas-Quijano FA, Sherry AD. T2 exchange agents: A new class of paramagnetic MRI contrast agent that shortens water T2 by chemical exchange rather than relaxation. Magn Reson Med. 2011;66:1697–1703. doi: 10.1002/mrm.22938. [DOI] [PMC free article] [PubMed] [Google Scholar]
- 4.Soesbe TC, Ratnakar SJ, Milne M, Zhang S, Do QN, Kovacs Z, Sherry AD. Maximizing T2-exchange in Dy3+DOTA-(amide)X chelates: Fine-tuning the water molecule exchange rate for enhanced T2 contrast in MRI. Magn Reson Med. 2014 doi: 10.1002/mrm.25091. In Press. [DOI] [PMC free article] [PubMed] [Google Scholar]
- 5.Aime S, Nano R, Grandi M. A new class of contrast agents for magnetic resonance imaging based on selective reduction of water-T2 by chemical exchange. Invest Radiol. 1988;23(Suppl 1):S267–270. doi: 10.1097/00004424-198809001-00058. [DOI] [PubMed] [Google Scholar]
- 6.Aime S, Calabi L, Biondi L, De Miranda M, Ghelli S, Paleari L, Rebaudengo C, Terreno E. Iopamidol: Exploring the potential use of a well-established x-ray contrast agent for MRI. Magn Reson Med. 2005;53:830–834. doi: 10.1002/mrm.20441. [DOI] [PubMed] [Google Scholar]
- 7.Jamnongwong M, Loubiere K, Dietrich N, Hebrard G. Experimental study of oxygen diffusion coefficients in clean water containing salt, glucose or surfactant: Consequences on the liquid-side mass transfer coefficients. Chem Eng J. 2010;165:758–768. [Google Scholar]
- 8.Swift TJ, Connick RE. Nmr-Relaxation Mechanisms of 017 in Aqueous Solutions of Paramagnetic Cations and Lifetime of Water Molecules in First Coordination Sphere. J Chem Phys. 1962;37:307–320. [Google Scholar]
- 9.Bociek S, Franks F. Proton exchange in aqueous solutions of glucose. Hydration of carbohydrates. J Chem Soc, Faraday Trans. 1979;75:262–270. [Google Scholar]
- 10.Wüthrich K. NMR of proteins and nucleic acids. New York: Wiley; 1986. [Google Scholar]
- 11.Liepinsh E, Otting G, Wuthrich K. NMR spectroscopy of hydroxyl protons in aqueous solutions of peptides and proteins. J Biomol NMR. 1992;2:447–465. doi: 10.1007/BF02192808. [DOI] [PubMed] [Google Scholar]
- 12.Tsai ZT, Wang JF, Kuo HY, Shen CR, Wang JJ, Yen TC. In situ preparation of high relaxivity iron oxide nanoparticles by coating with chitosan: A potential MRI contrast agent useful for cell tracking. J Magn Magn Mater. 2010;322:208–213. [Google Scholar]
- 13.Chan KWY, McMahon MT, Kato Y, Liu G, Bulte JWM, Bhujwalla ZM, Artemov D, van Zijl PCM. Natural D-glucose as a biodegradable MRI contrast agent for detecting cancer. Magn Reson Med. 2012;68:1764–1773. doi: 10.1002/mrm.24520. [DOI] [PMC free article] [PubMed] [Google Scholar]
- 14.Walker-Samuel S, Ramasawmy R, Torrealdea F, Rega M, Rajkumar V, Johnson SP, Richardson S, Goncalves M, Parkes HG, Arstad E, Thomas DL, Pedley RB, Lythgoe MF, Golay X. In vivo imaging of glucose uptake and metabolism in tumors. Nat Med. 2013;19:1067–1072. doi: 10.1038/nm.3252. [DOI] [PMC free article] [PubMed] [Google Scholar]
- 15.Soesbe TC, Togao O, Takahashi M, Sherry AD. SWIFT-CEST: a new MRI method to overcome T(2) shortening caused by PARACEST contrast agents. Magn Reson Med. 2012;68:816–821. doi: 10.1002/mrm.23302. [DOI] [PMC free article] [PubMed] [Google Scholar]
- 16.van Zijl PC, Davis D, Eleff SM, Moonen CT, Parker RJ, Strong JM. Determination of cerebral glucose transport and metabolic kinetics by dynamic MR spectroscopy. Am J Physiol. 1997;273:E1216–1227. doi: 10.1152/ajpendo.1997.273.6.E1216. [DOI] [PubMed] [Google Scholar]
- 17.Gruetter R, Ugurbil K, Seaquist ER. Steady-state cerebral glucose concentrations and transport in the human brain. J Neurochem. 1998;70:397–408. doi: 10.1046/j.1471-4159.1998.70010397.x. [DOI] [PubMed] [Google Scholar]
- 18.van Zijl PC, Rothman D. NMR studies of brain 13C-glucose uptake and metabolism: present status. Magn Reson Imaging. 1995;13:1213–1221. doi: 10.1016/0730-725x(95)02034-q. [DOI] [PubMed] [Google Scholar]
- 19.Gruetter R. In vivo 13C NMR studies of compartmentalized cerebral carbohydrate metabolism. Neurochem Int. 2002;41:143–154. doi: 10.1016/s0197-0186(02)00034-7. [DOI] [PubMed] [Google Scholar]
- 20.de Graaf RA, Mason GF, Patel AB, Behar KL, Rothman DL. In vivo 1H-[13C]-NMR spectroscopy of cerebral metabolism. NMR Biomed. 2003;16:339–357. doi: 10.1002/nbm.847. [DOI] [PubMed] [Google Scholar]
- 21.Shulman RG, Rothman DL. 13C NMR of intermediary metabolism: implications for systemic physiology. Annu Rev Physiol. 2001;63:15–48. doi: 10.1146/annurev.physiol.63.1.15. [DOI] [PubMed] [Google Scholar]
- 22.Li Y, Chan KWY, Xu J, Qiao Y, Bulte JW, McMahon MT, Zhou S, van Zijl PCM, Liu G. Assessment of the size window of tumor vascular permeability using dextran-based CEST MRI. In Proceedings of the 22nd Annual Meeting of the ISMRM; Milan, Italy. 2014. [Google Scholar]