Abstract
AMP-activated protein kinase (AMPK) is an important energy sensor that may be critical in regulating renal lipid accumulation. To evaluate the role of AMPK in mediating renal lipid accumulation, C57BL/6J mice were randomized to a standard diet, a high-fat diet, or a high-fat diet plus AICAR (an AMPK activator) for 14 weeks. Renal functional and structural studies along with electron microscopy were performed. Mice given the high-fat diet had proximal tubule injury with the presence of enlarged clear vacuoles, and multilaminar inclusions concurrent with an increase of tissue lipid and overloading of the lysosomal system. The margins of the clear vacuoles were positive for the endolysosomal marker, LAMP1, suggesting lysosome accumulation. Characterization of vesicles by special stains (Oil Red O, Nile Red, Luxol Fast Blue) and by electron microscopy showed they contained onion skin-like accumulations consistent with phospholipids. Moreover, cholesteryl esters and phosphatidylcholine-containing phospholipids were significantly increased in the kidneys of mice on a high-fat diet. AMPK activation with chronic AICAR treatment prevented the clinical and structural effects of high-fat diet. Thus, high-fat diet contributes to a dysfunction of the lysosomal system and altered lipid metabolism characterized by cholesterol and phospholipid accumulation in the kidney. AMPK activation normalizes the changes in renal lipid content despite chronic exposure to lipid challenge.
Keywords: AMPK, chronic kidney disease, lipid accumulation, lysosomal dysfunction, obesity
The growing epidemic of obesity particularly in the western world is considered a serious health and economic burden. Central obesity is a major risk factor for diabetes and hypertension that together account for ~ 70% of all cases of end-stage renal disease1 that will lead to expensive renal replacement therapy. Obesity-related kidney disease is related to caloric excess promoting deleterious cellular responses in targeted organs. However, a full understanding of the mechanisms involved in progressive renal disease is still absent. Obesity- and diabetes-related kidney disease are associated with renal hemodynamic abnormalities, endothelial and podocyte dysfunction, glomerular basement membrane thickening and mesangial expansion, tubular atrophy, interstitial fibrosis, and a progressive decrease in renal function (increased albuminuria and decreased glomerular filtration rate) leading to end-stage renal disease.2–5 There are marked lipid vacuoles present in human and experimental obesity-associated kidney disease; however, the composition and pathways related to their formation is unclear.
In a recent study, our group highlighted the appearance of many of these features in high-fat diet (HFD)–induced obesity-related kidney disease model.6 There was a beneficial effect of the specific central energy sensor AMP-activated protein kinase (AMPK) in regulating the initial inflammatory response in the kidney (1 week), characterized by increased monocyte chemoattractant protein-1 (MCP-1) and urine hydrogen peroxide (H2O2).6 AMPK is a ubiquitous heterotrimeric kinase consisting of a catalytic α subunit and regulatory β and γ subunits, and is abundantly expressed in the kidney7,8 As a cellular energy and redox sensor, its activity is highly linked to the change in the cellular energy state and, consequently, metabolic stress conditions such as obesity.9 Although our previous study demonstrated the role of AMPK activation in the early phase of HFD-induced kidney disease, the role of chronic AMPK activation in obesity-induced kidney disease and how AMPK activation may affect lipid metabolism with chronic high-fat exposure remains unknown. To determine the potential role of AMPK in relation to altered lipid metabolism we utilized a HFD-induced obesity model and tested the hypothesis that AMPK is a central player in chronic renal inflammation, and a key regulator of intracellular lipid storage.
RESULTS
Chronic AMPK activation prevents obesity, hyperglycemia, insulin resistance, kidney hypertrophy, and albuminuria
Metabolic data of mice fed a normal, standard chow (STD) or HFD with or without 5-aminoimidazole-4-carboxamide-1-β-d-ribofuranoside (AICAR) treatment for 14 weeks are shown in Table 1. The body weight (45.30±0.81 g) and kidney weight (0.353±0.006 g) of HFD mice were significantly higher than that of STD mice (28.50±0.64 and 0.306±0.007 g, respectively). Changes in body weight gain and kidney hypertrophy were attenuated in HFD mice treated with AICAR. The level of plasma glucose and insulin was significantly higher in HFD mice, and AICAR treatment also prevented these increases. In contrast, the circulating adiponectin level was similar with STD and HFD but significantly higher in AICAR-treated HFD mice.
Table 1.
Metabolic data of mice fed standard diet (STD), high-fat diet (HFD), or HFD + AICAR
| STD | HFD | HFD + AICAR | |
|---|---|---|---|
| Body weight, g | 28.50 ± 0.64 | 45.30 ± 0.81* | 34.00 ± 1.23# |
| Plasma glucose level, Mg/dl |
145.2 ± 5.1 | 187.0 ± 8.2* | 148.3 ± 10.2# |
| Kidney weight, g | 0.306 ± 0.007 | 0.353 ± 0.006* | 0.318 ± 0.012# |
| Kidney weight, g/mm of tibia length |
0.0154 ± 0.0007 | 0.0174 ± 0.0003* | 0.0159 ± 0.0004 |
| Adiponectin, µg/ml | 14.6 ± 2.9 | 18.2 ± 2.3 | 25.7 ± 2.1*# |
| Plasma insulin, ng/ml | 0.50 ± 0.01 | 1.07 ± 0.20* | 0.52 ± 0.03# |
| UACR, µg/mg | 5.99 ± 1.40 | 79.80 ± 14.06* | 21.66 ± 4.46# |
Abbreviations: AICAR, 5-aminoimidazole-4-carboxamide-1-β-d-ribofuranoside; UACR, urine albumin/creatinine ratio.
Statistical analyses were performed by one-way analysis of variance (ANOVA) followed by Newman–Keuls,
P ≤ 0.05 versus mice on STD and
P ≤ 0.05 versus mice on HFD.
Values are means ± s.e.m; n = 6 in each group.
We also investigated whether chronic AMPK activation affected progressive albuminuria.6 HFD induced a significant elevation of albuminuria (79.80±14.06 vs. 5.99±1.40 µg per mg Cre) that was significantly improved by AICAR treatment (21.66±4.46 µg per mg Cre).
Effect of AMPK activation on glomerular expansion and renal gene expression
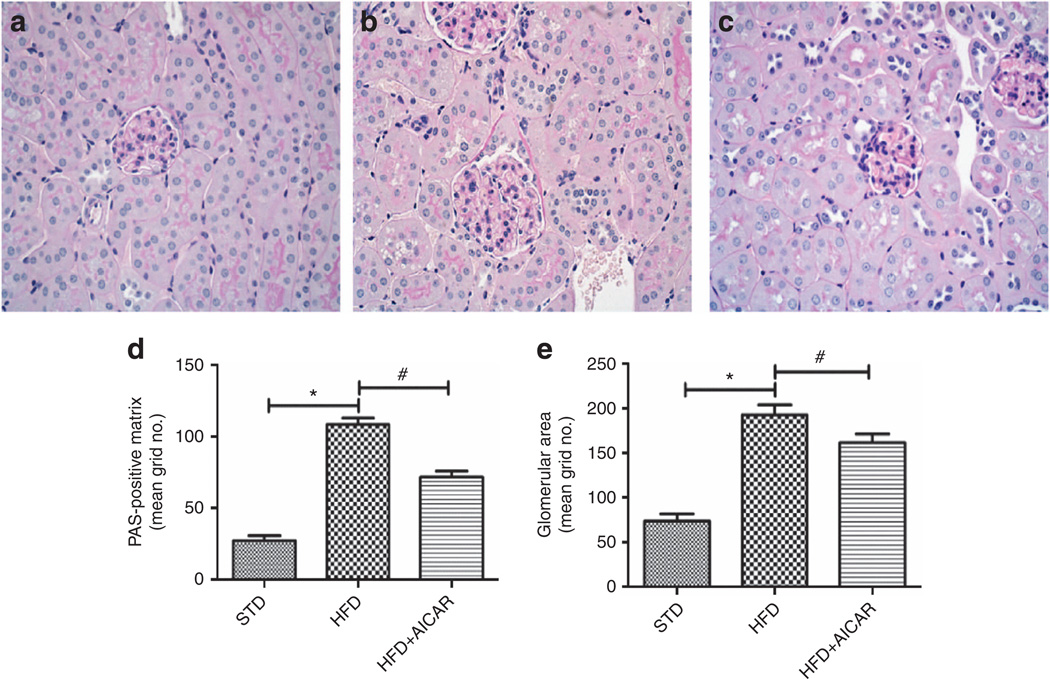
To better characterize the effect of a long-term AMPK activation on histological characteristics of kidney disease, morphologic and gene expression analysis was performed. The morphological analysis of the renal tissue revealed that mice fed a HFD developed a significant increase of glomerular area and glomerular matrix (Figure 1a–e) at week 14, whereas AICAR treatment attenuated the increase. Profibrotic and proinflammatory candidate genes were measured by real-time PCR. As observed in Table 2, renal mRNA levels of the profibrotic and proinflammatory markers (transforming growth factor-β (TGF-β1), tumor necrosis factor-α, and MCP-1) were significantly increased with HFD and prevented by AICAR.
Figure 1. Effects of AMP-activated protein kinase (AMPK) activation on glomerular expansion from mice on standard diet (STD), high-fat diet (HFD), and HFD + AICAR.
Representative photomicrographs (original magnification ×400) illustrating glomerular pathological features with periodic acid–Schiff (PAS) staining in (a) STD, (b) HFD, and (c) HFD + AICAR mice. Quantitative analysis of (d) glomerular surface area and (e) glomerular matrix at week 14. Values are means ±s.e.m. N = 6 in each group. Statistical analyses were performed by one-way analysis of variance (ANOVA) followed by Newman–Keuls, *P ≤ 0.05 versus mice on STD and #P ≤ 0.05 versus mice on HFD. AICAR, 5-aminoimidazole-4-carboxamide-1-β-d-ribofuranoside.
Table 2.
Effect of AMPK activation on renal gene expression in mice fed STD, HFD, or HFD + AICAR
| STD | HFD | HFD + AICAR | |
|---|---|---|---|
| Profibrotic markers | |||
| TGF-β1 | 1.00 ± 0.11 | 1.67 ± 0.12* | 0.52 ± 0.28# |
| Collagen type 1 | 1.00 ± 0.11 | 1.45 ± 0.19 | 0.64 ± 0.24# |
| Collagen type IV | 1.00 ± 0.16 | 1.34 ± 0.09 | 0.45 ± 0.29# |
| Proinflammatory markers | |||
| MCP-1 | 1.00 ± 0.14 | 2.10 ± 0.28* | 0.72 ± 0.34# |
| TNF-α | 1.00 ± 0.20 | 2.28 ± 0.43* | 0.97 ± 0.29# |
Abbreviations: AICAR, 5-aminoimidazole-4-carboxamide-1-β-d-ribofuranoside; HFD, high-fat diet; MCP-1, monocyte chemoattractant protein-1; STD, standard diet; TGF-β1, transforming growth factor-β1; TNF-α, tumor necrosis factor-α.
Quantitative real-time PCR was performed on renal tissue in mice fed a STD, a HFD, or HFD + AICAR, each sample was normalized against β-actin.
Statistical analyses were performed by one-way analysis of variance (ANOVA) followed by Newman–Keuls,
P ≤ 0.05 versus mice on STD and
P ≤ 0.05 versus mice on HFD.
Values are means ±s.e.m. n = 6 in each group.
Effect of AMPK activation on tubulointerstitial injury
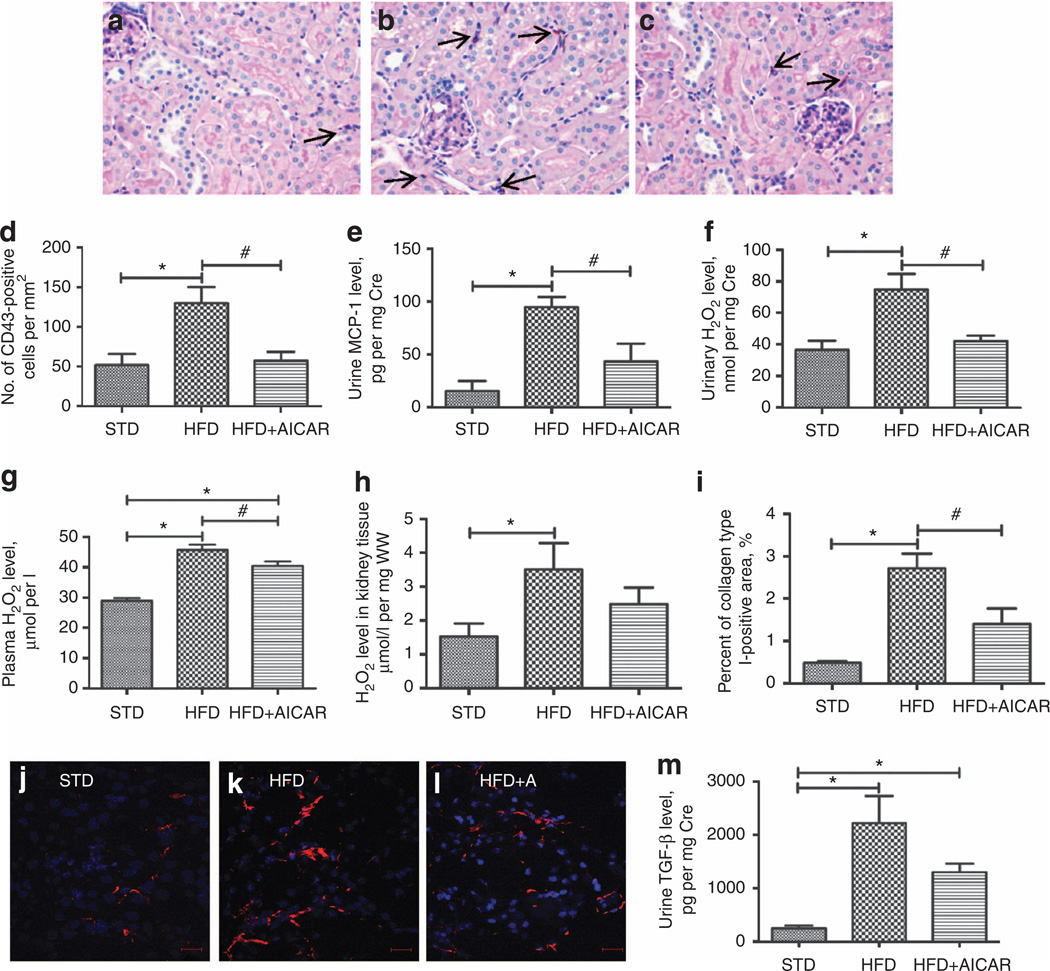
To determine the role of AMPK in renal inflammation and fibrosis, macrophage infiltration, urine H2O2 and MCP-1 levels, as well as collagen deposition and urine TGF-β level were investigated.
As illustrated in Figure 2a–d, the increased macrophage infiltration observed in HFD group was prevented by AMPK activation. Similarly, the significant increase of urine MCP-1 level in mice fed a HFD was prevented by the AICAR treatment (Figure 2e). In addition, the urinary H2O2 level, a marker of renal inflammation, was significantly higher after HFD and was reduced with AMPK activation (Figure 2f), similar to what was found with short-term AICAR treatment.6 There was a significant rise in H2O2 in the kidney tissue extracts with a HFD, which was not found with AICAR (Figure 2g). In plasma, the increase of H2O2 in the HFD group was significantly attenuated in the AICAR-treated group (Figure 2h). Therefore, the rise in urine H2O2 is likely contributed by both systemic and renal production of H2O2 that is regulated at least in part by AMPK.
Figure 2. Effect of AMP-activated protein kinase (AMPK) activation on tubulointerstitial injury.
Representative photomicrographs (original magnification ×400) of macrophage staining (CD43-positive cells, arrow) in (a) standard diet (STD), (b) high-fat diet (HFD), and (c) HFD + AICAR mice, (d) Quantitative analysis of number of CD43-positive cells per mm2 in mice on STD, HFD, or HFD + AICAR at 14 weeks, (e) Quantitative urine monocyte chemoattractant protein-1 (MCP-1) level in mice on STD, HFD, or HFD + AICAR. (f) Quantitative urine hydrogen peroxide (H2O2)/creatinine level in mice on STD, HFD, or HFD + AICAR. (g) Quantitative plasma H2O2 level in mice on STD, HFD, or HFD + AICAR. (h) Quantitative kidney tissue H2O2 per mg of wet kidney tissue level (WW) in mice on STD, HFD, or HFD + AICAR. (i) Quantitative analysis of percent of collagen type I–positive area in mice on STD, HFD, or HFD + AICAR at 14 weeks. Immunofluorescence microscopy of tubulointerstitial area sections illustrating collagen type I deposits in (j) STD, (k) HFD, and (I) HFD + AICAR mice, (m) Quantitative urine transforming growth factor-β (TGF-β) level in mice on STD, HFD, or HFD + AICAR. Values are means ±s.e.m. N = 6 in each group. Statistical analyses were performed by one-way analysis of variance (ANOVA) followed by Newman-Keuls, *P ≤ 0.05 versus mice on STD and #P ≤ 0.05 versus mice on HFD. AICAR, 5-aminoimidazole-4-carboxamide-1-β-d-ribofuranoside.
Regarding the fibrotic markers, there was a significant increase in collagen type I deposit (Figure 2i–l) that was prevented with AICAR treatment. Mice fed a HFD also showed a significant increase in urine TGF-β level (Figure 2m) that was reduced with AMPK activation.
Effect of AMPK activation on tubular histology
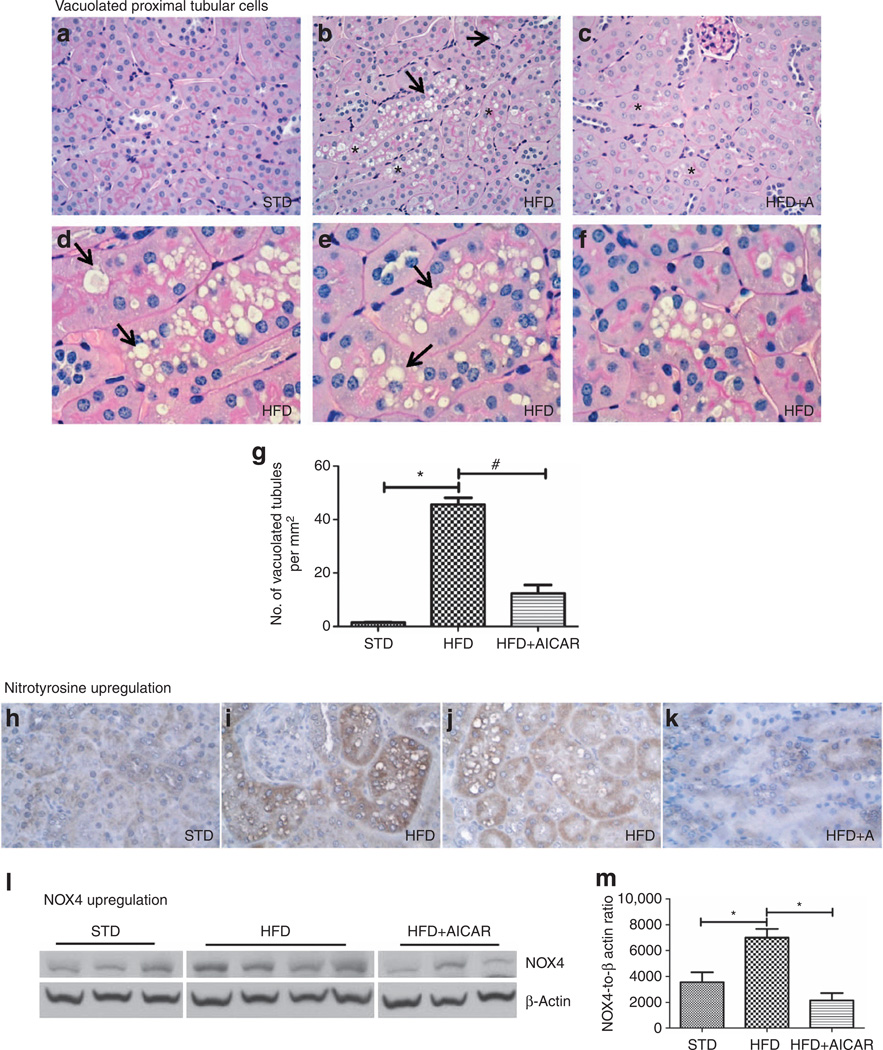
Interestingly, we detected an overall increase in vacuolated tubular cells (Figure 3a–c) in the HFD mice. These vacuolated tubular cells were located in the cortex, specifically in the S1 and S2 segments of the proximal tubule. However, the S3 segments, characterized by a very dense brush border (heavy periodic acid–Schiff staining) and located in the outer stripe of the outer medulla, do not show any sign of these vacuoles. The vacuoles present in the S1 and S2 segments were as large as the nucleus or sometimes even larger. In addition, as illustrated in Figure 3d–f, many proximal tubular cells appeared to be completely filled with these vacuoles. Signs of loss of brush border were also observed in these vacuolated tubular cells (Figure 3d–f). Chronic AMPK activation almost completely suppressed the development of vacuolated tubular cells (Figure 3g). Although loss of brush border is considered as a sign of tubular damage, we further demonstrated the cellular dysfunction and partially restored brush borders. Nitrotyrosine and NADPH oxidase 4 (NOX4), two markers of oxidative stress, were investigated. There was a significant rise in nitrotyrosine immunostaining in the kidney tissue with a HFD (Figure 3h–k). In parallel, NOX4 expression was also upregulated with a HFD (Figure 3l–m). The upregulation of nitrotyrosine and NOX4 expression were both prevented by AICAR.
Figure 3. Effects of AMP-activated protein kinase (AMPK) activation on tubular histology from mice on standard diet (STD), high-fat diet (HFD), and HFD + AICAR.
Representative photomicrographs (original magnification ×400) illustrating vacuolated proximal convoluted tubular cells (*) and loss of brush border (arrow) in (a) STD, (b) HFD, and (c) HFD + AICAR mice. Representative photomicrographs (original magnification ×1000) illustrating vacuolated proximal convoluted tubular cells (*) and impaired brush border (arrow) in (d–f) HFD mice. (g) Quantitative analysis of number of vacuolated tubules per mm2. Representative photomicrographs (original magnification ×400) illustrating nitrotyrosine staining in tubular epithelial cells in (h) STD, (i, j) HFD, and (k) HFD + AICAR. (I) Western blot analysis of the effect of HFD on NADPH oxidase 4 (NOX4) expression in STD-, HFD-, and HFD +AlCAR-treated mice, (m) Relative densitometry of the immunoblot shows that NOX4 was upregulated with HFD, whereas the AMPK activation prevented this rise. Values are means ±s.e.m. N = 6 in each group. Statistical analyses were performed by one-way analysis of variance (ANOVA) followed by Newman–Keuls, *P ≤ 0.05 versus mice on STD and #P ≤ 0.05 versus mice on HFD. AICAR, 5-aminoimidazole-4-carboxamide-1-β-d-ribofuranoside.
Effect of AICAR on AMPK activation in renal tubular cells
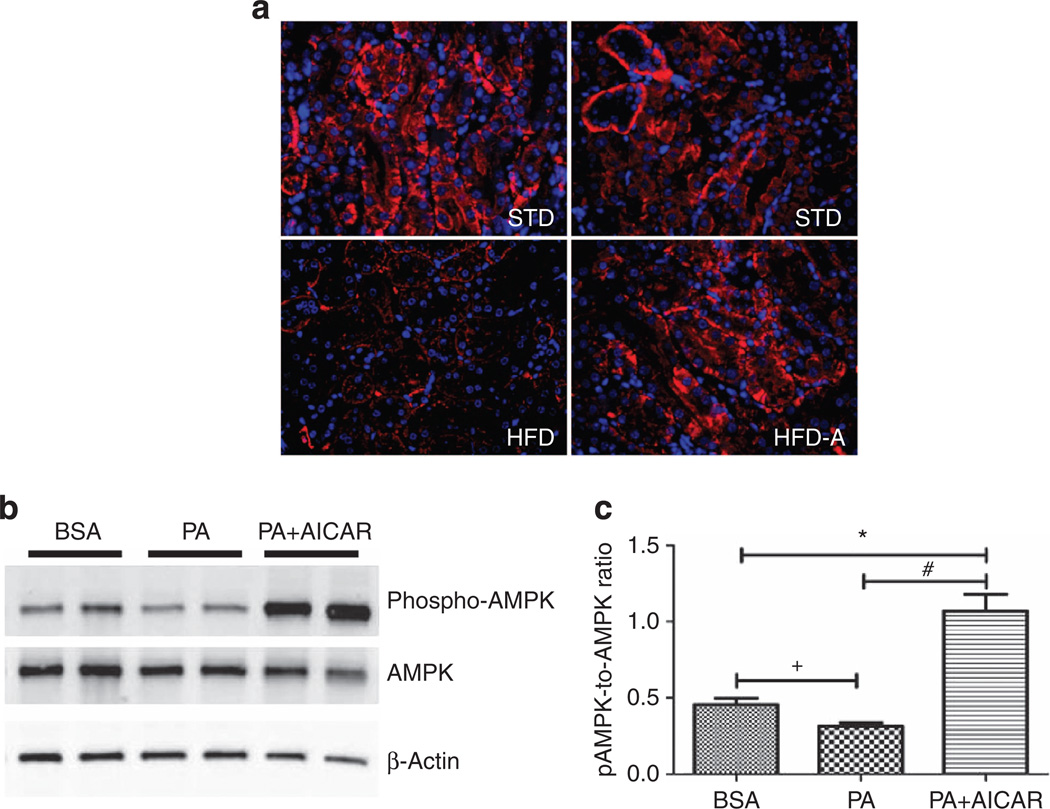
We first investigated phosphorylated AMPK localization by immunofluorescence. As illustrated in Figure 4a–d, pAMPK was prominent in cortical tubular epithelial cells in mice fed a STD. In contrast, mice fed a HFD exhibited a significant decrease in AMPK activation, whereas AICAR treatment prevented this reduction (Figure 4d).
Figure 4. Effect of AICAR on AMP-activated kinase activation in renal tubular cells.
Representative immunofluorescence photomicrographs (original magnification ×400) illustrating phosphorylated AMP-activated protein kinase (AMPK) staining in kidney tissue in (a) standard diet (STD), high-fat diet (HFD), and HFD +AICAR. (b) Western blot analysis of phospho-AMPK and AMPK in human renal proximal tubular epithelial cells (HRPTEpiC) treated respectively with bovine serum albumin (BSA), palmitic acid (PA), or PA + AICAR in order to mimic the HFD model. (c) Relative densitometry of the immunoblot shows that phospho-AMPK was downregulated with PA in a proximal epithelial cell model, whereas the AICAR treatment significantly upregulated phospho-AMPK. Values are means ±s.e.m. N = 5 in each group. Statistical analyses were performed by one-way analysis of variance (ANOVA) followed by Newman–Keuls, *P ≤ 0.05 versus BSA group and #P ≤ 0.05 versus PA group or by unpaired f-test + P ≤ 0.05 versus BSA group. AICAR, 5-aminoimidazole-4-carboxamide-1-β-d-ribofuranoside.
To further determine whether AICAR could directly activate AMPK in proximal tubular epithelial cells, human renal proximal tubular epithelial cells in culture were stimulated with palmitic acid (PA) with or without AICAR. AMPK activation was measured by western blot analysis at 24 h after stimulation. Similar to the in vivo condition, there was a reduction of activated AMPK with PA exposure and a significant increase in AMPK activation with AICAR (Figure 4e and f).
Effect of AMPK activation on lipid oxidation and mitochondrial function
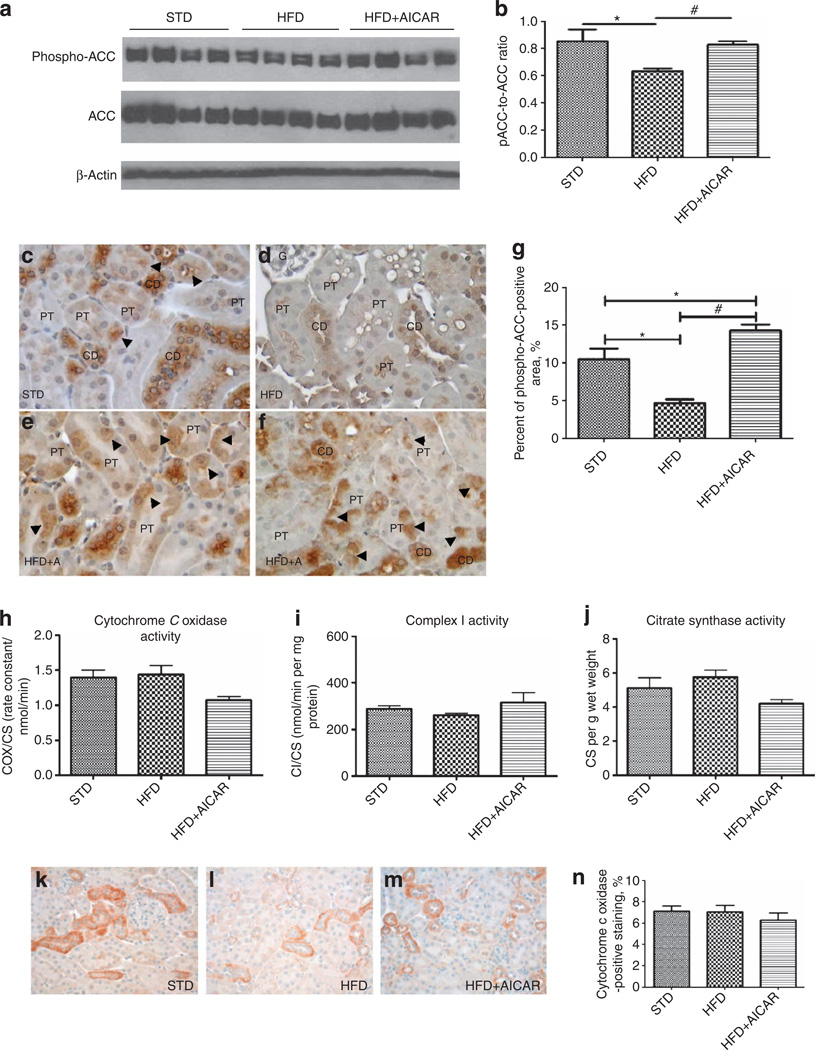
As vacuolization was almost completely resolved with chronic AMPK activation, we evaluated whether AMPK regulated acetyl-CoA carboxylase (ACC) and mitochondrial function.
Reduced phosphorylation of ACC would lead to impaired oxidation of lipids via the mitochondria. Indeed, HFD led to a marked reduction in phospho-ACC, and AMPK activation prevented reduced phosphorylation of ACC (Figure 5a and b).
Figure 5. Effects of AMP-activated protein kinase (AMPK) activation on lipid oxidation and mitochondrial function from mice on standard diet (STD), high-fat diet (HFD), and HFD + AICAR.
(a) Western blot analysis of the effect of HFD on phosphorylated acetyl-CoA carboxylase (ACQ in STD-, HFD-, and HFD +AlCAR-treated mice, (b) Relative densitometry of the immunoblot shows that phospho-ACC was reduced with HFD, whereas the AMPK activation prevented this inhibition. All figures were normalized with p-actin. Representative photomicrographs (original magnification ×400) illustrating phospho-ACC immunostaining in tubular epithelial cells in (c) STD, (d, e) HFD, and (f) HFD + AICAR. CD, collecting duct; G, glomerulus; PT, proximal tubule, (g) Quantitative analysis percent of phospho-ACC-positive staining area in mice on STD, HFD, or HFD + AICAR at 14 weeks. Values are means ± s.e.m. N = 6 in each group. Statistical analyses were performed by one-way analysis of variance (ANOVA) followed by Newman–Keuls, *P ≤0.05 versus mice on STD and #P ≤ 0.05 versus mice on HFD. (h–j) Cytochrome c oxidase (COX) activity, complex I activity, and citrate synthase measured in the kidney (respectively) in STD, HFD, and HFD + AICAR mice. Representative photomicrographs (original magnification ×400) illustrating COX staining in renal tissue of mice treated with (k) STD, (I) HFD, or (m) HFD + AIACAR. (n) Quantitative analysis of COX-positive staining. AICAR, 5-aminoimidazole-4-carboxamide-1-β-d-ribofuranoside.
The localization of phosphorylated ACC (pACC) was then determined by immunochemistry. Representative photographs of pACC in the renal cortex in STD, HFD, and HFD + AICAR are illustrated Figure 5c–g.
In control (STD) mice, pACC was mostly located in collecting ducts and distal tubules and was present but less pronounced in the proximal tubules (Figure 5c, arrowhead). In HFD mice, the immunostaining of pACC in proximal tubules, collecting ducts, and distal tubules was reduced as compared with STD mice (Figure 5d and g). In AICAR-treated mice, the immunolocalization of pACC was similar to the STD mice (Figure 5e and f).
In order to determine whether impaired mitochondria may play a role in lipid accumulation, we measured mitochondrial activity. Citrate synthase and complex I and complex IV activity were all unchanged in the kidney with HFD (Figure 5h and i). Cytochrome c oxidase (COX) by immunochemistry did not show a change in the kidney with HFD (Figure 5k–n). COX localization was mostly detected in the mitochondria of the distal tubules and the collecting ducts. These results indicate that reduced ACC may contribute to lipid vacuolization; however, altered mitochondrial function in the kidney does not appear to play a major role.
Effect of AMPK activation on renal lysosomal dysfunction
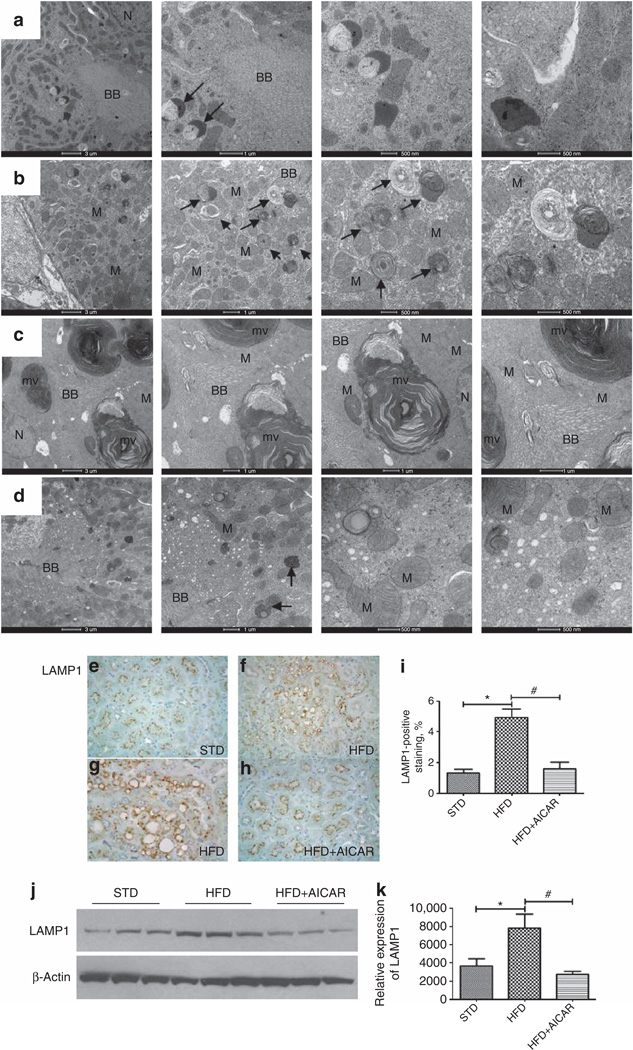
As aberrant phospholipid storage can be associated with altered intracellular trafficking in the lysosomal system, we further investigated the increase of intracellular vacuoles.
As illustrated in Figure 6b and c, electron microscopy analysis revealed an increase in number and size of lysosomes (arrow) in mice fed a HFD. These lysosomes typically had a heterogeneous content which often consisted of multilamellar, whorl-like structures characteristic of phospholipid accumulations (Figure 6c), suggesting overloading of the lysosomal system with HFD, while the tubular cells exhibiting AICAR reduced this change (Figure 6d).
Figure 6. Effects of AMP-activated protein kinase (AMPK) activation on renal lysosomal dysfunction.
Electron microscopy evaluation of intracellular vacuoles in proximal tubules in mice treated with (a) a standard diet (STD), (b, c) a high-fat diet (HFD), or (d) HFD + AICAR. The photographs highlight an increase of intracellular vacuoles (arrow) with (b, c) HFD in addition of (c) enlarged multilaminar inclusion. BB, brush border; N, nucleus; M, mitochondria; mv, multilaminar vacuole. Representative photomicrograph (original magnification ×40) showing lysosomal-associated membrane protein 1 (LAMPI)–positive staining on intracellular vacuoles in mice fed a (e) STD, (f, g) a HFD (higher original magnification ×1000), and a (h) HFD + AICAR. (i) Quantitative analysis of LAMP1-positive staining, (j) Western blot analysis of LAMP1 in STD-, HFD-, and HFD +AlCAR-treated mice. Relative densitometry of the immunoblot shows that LAMP1 was significantly increased with HFD, whereas the AMPK activation prevented this rise, (k) All figures were normalized to β-actin. Values are means ±s.e.m. N = 6 in each group. Statistical analyses were performed by one-way analysis of variance (ANOVA) followed by Newman–Keuls, *P ≤ 0.05 versus mice on STD and #P ≤ 0.05 versus mice on HFD. AICAR, 5-aminoimidazole-4-carboxamide-1-β-d-ribofuranoside.
In addition, we demonstrated by immunochemistry that the margins of the vacuoles were positive for the lysosomal-associated membrane protein 1 ( LAMP1), a specific marker of lysosomes, suggesting lysosome accumulation (Figure 7e–i). In addition, increased LAMP1 protein was also confirmed by western blotting (Figure 6j). In AICAR-treated mice, LAMP1 protein level was significantly reduced (Figure 6k).
Figure 7. Lipid storage in tubular cells in mice fed a high-fat diet (HFD).
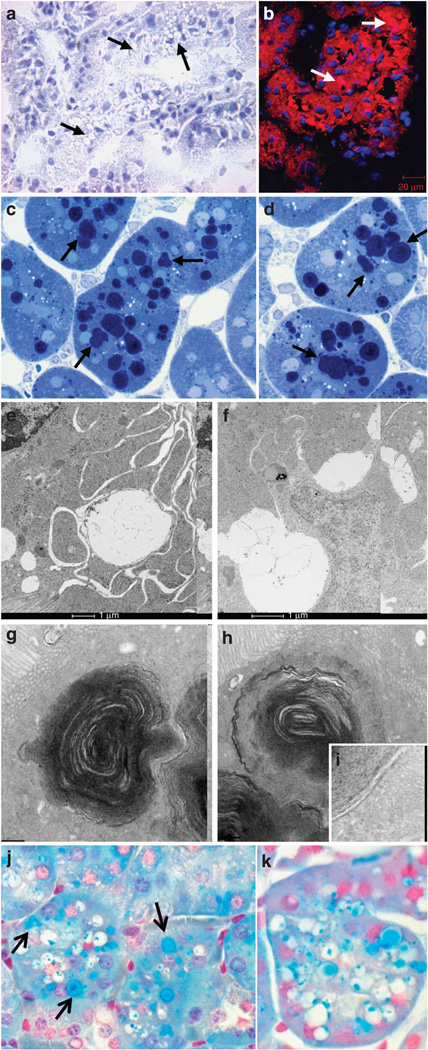
(a) Representative photomicrograph (original magnification ×40) showing that the vacuoles (arrow) are negative for Oil Red O Staining, (b) Representative photomicrograph illustrating cholesteryl esters with fluorescent dye Nile red staining in HFD (arrows), (c, d) Representative photomicrographs (original magnification ×1000) of semi-thin sections (original magnification ×1000) illustrating Toluidine Blue–positive dark blue vacuoles (arrow). Electron microscopy evaluation of ultrastructure of vacuoles in proximal tubules in mice treated with a HFD: presence of (e, f) enlarged clear vacuoles and (g, h) multilaminar inclusions (i: higher magnification), (j, k) Representative photomicrographs (original magnification ×1000) illustrating phospholipid accumulation in vacuolated tubule with Luxol Fast Blue in HFD (arrow, vacuoles stained in blue).
Lipid storage in renal tubular cells
In order to better characterize the constituents of the vacuoles observed in the tubular cells, we performed further morphological analysis. To demonstrate whether the vacuoles contained neutral triglycerides, Oil Red O staining was performed and we found that there were very few Oil Red O–positive vacuoles (Figure 7a). However, almost all the vacuoles stained positive with Nile red (Figure 7b). Nile red can stain all neutral lipids including neutral cholesteryl esters and triglycerides. However, the data suggested that the vacuoles were mostly composed of cholesteryl esters as triglycerides were not increased in the kidney (Figure 8).
Figure 8. Effects of AMP-activated protein kinase (AMPK) activation in lipid accumulation in kidney and liver.
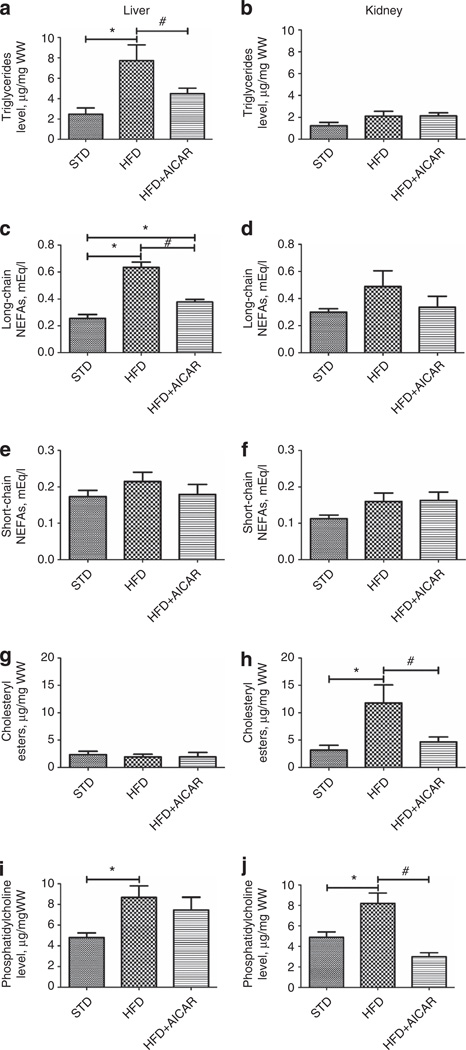
Quantitative analysis of triglycerides, long-chain nonesterified fatty acid (NEFA), short-chain NEFA, cholesteryl esters, and phosphatidylcholine levels in liver (a, c, e, g, i, respectively) and in the kidney (b, d, f, h, j, respectively) in mice fed a standard diet (STD), a high-fat diet (HFD), or HFD + AICAR. Values are means ± s.e.m. N = 6 in each group. Statistical analyses were performed by one-way analysis of variance (ANOVA) followed by Newman-Keuls, *P ≤ 0.05 versus mice on STD and #P ≤ 0.05 versus mice on HFD. AICAR, 5-aminoimidazole-4-carboxamide-1-β-d-ribofuranoside.
To further evaluate the composition of the vacuoles, semi-thin sections were stained with Toluidine Blue for the possibility of phospholipids. Indeed, the majority of the vacuoles demonstrated Toluidine Blue–positive dark blue bodies (Figure 7c and d). Electron microscopy revealed the presence of enlarged clear vacuoles (Figure 7e and f) as well as lysosomes with multilamellar, onion skin-like accumulations indicative of phospholipids (Figure 7g, h, and i; i indicates higher magnification).10,11 To confirm that vacuoles contained phospholipids, Luxol Fast Blue (LFB) staining was performed on paraffin-embedded kidney sections. LFB is usually used to stain the myelin including phospholipids. The majority of the vacuoles were positively stained by the LFB method (Figure 7j and k).
The kidney is a key target for lipid accumulation in HFD model: effect of AMPK activation
To determine whether specific lipid classes were altered in the kidney with HFD, we specifically measured triglycerides, fatty acids, cholesteryl ester, and phospholipids in the kidney. Liver lipid content was also evaluated to determine whether there would be a differential regulation in the two organs (Figure 8). As expected, there was a significant rise in the triglyceride level with HFD in the liver and this rise was significantly attenuated by AICAR (Figure 8a). In contrast, and surprisingly, the triglyceride levels in the kidney were unchanged between groups (Figure 8b). There was a significant rise of liver long-chain nonesterified fatty acids (NEFA) and attenuation with AICAR; however, kidney levels of NEFA were not significantly increased with HFD (Figure 8c and d). The levels of short-chain NEFA were unchanged between groups in both the liver and the kidney (Figure 8e and f). Interestingly, there was a significant rise of cholesteryl esters in the kidneys but not in the livers of HFD-fed mice. Chronic AMPK activation reduced cholesteryl esters formation in the kidney (Figure 8g and h). Finally, phospholipids were increased in both kidneys and livers to a similar extent; however, chronic AMPK activation completely lowered phospholipid accumulation in the kidney but not in the liver (Figure 8i and j). These results demonstrate that lipid accumulation in the kidney may primarily be because of cholesteryl esters and phospholipids and is under the control of AMPK. Furthermore, there are dramatic differences in renal and liver patterns of lipid accumulation with HFD feeding.
Cholesterol metabolism in kidney tissue in HFD model
As lipid accumulation in the kidney seems to be notably because of cholesteryl esters, we investigated the expression of 3-hydroxy-3-methylglutaryl-CoA reductase (HMGCR), a key enzyme in cholesterol synthesis. Figure 9 illustrates representative photomicrographs demonstrating the HMGCR immunostaining in kidney tissue in STD (Figure 9a), HFD (Figure 9b), and HFD + AICAR (Figure 9c). As observed, in control condition (STD), HMGCR was strongly expressed in collecting ducts but only slightly in proximal tubular epithelial cells. Its expression in the HFD mice was greatly increased mostly in the proximal tubular epithelial cells, whereas AMPK activation prevented its upregulation in these cells.
Figure 9. Localization of 3-hydroxy-3-methylglutaryl-CoA reductase (HMGCoA) in renal tissue.
Representative photomicrographs (original magnification ×400) illustrating 3-hydroxy-3-methylglutaryl-CoA reductase (HMGCoA) immunostaining in tubular epithelial cells in (a) standard diet (STD), (b) high-fat diet (HFD), and (c) HFD + AICAR. AICAR, 5-aminoimidazole-4-carboxamide-1-β-d-ribofuranoside; CD, collecting duct; PT, proximal tubule.
DISCUSSION
The growing epidemic of obesity throughout the world is a serious health and economic burden. Obesity results in lipid accumulation in both adipose and nonadipose tissues. Excess lipid accumulation may lead to lipotoxicity and may be the major driver of cellular dysfunction with HFD. Lipid homeostasis is regulated by the influx, the synthesis, catabolism, and efflux of lipids. In this study, we demonstrate that chronic effects of lipid accumulation and associated renal functional and structural alterations are largely mediated by AMPK.
AMPK is a ubiquitous heterotrimeric kinase consisting of a catalytic α subunit and regulatory β and γ subunits, and is abundantly expressed in the kidney.7,8 As a cellular energy sensor, its activity is highly linked to the change in the intracellular AMP/adenosine triphosphate ratio but may also be regulated by several other pathways including CaMKK, Sirt1, LKB, and reactive oxygen species.12 AMPK activation results in an increase of efficient energy utilization during energy-deficient states in order to restore energy balance.13 Metabolic stress conditions such as diabetes or obesity reduces the activity of AMPK by providing an overabundance of carbon molecules for energy.13,14 There is a central role for AMPK in HFD-induced kidney disease as albuminuria, urine H2O2, and glomerular matrix and renal gene expression of profibrotic and proinflammatory molecules were all increased by HFD and significantly reduced by AMPK activation.
A prominent feature of HFD-induced kidney disease is the accumulation of lipid vacuoles. Our results revealed an overall increase in vacuolated proximal tubular cells primarily in the S1 and S2 segments along with impaired brush border and increased nitrotyrosine and NOX4 levels, suggesting tubular dysfunction. According to the detailed work by Maunsbach et al.,15–17 the S1 and S2 segments present specific features that might explain why these segments are the predicted targets of injury. Indeed, the S1 segment has a prominent endocytic system and abundant mitochondria; and the S2 segment has large secondary lysosomes. In contrast, the S3 segment has fewer endocytic vacuoles and smaller numbers of mitochondria. Whereas several studies highlighted an increase of neutral lipid as determined by increase of Oil Red O staining in the kidney after a HFD,18–20 our present findings demonstrate that the majority of vacuoles are Oil Red O negative but positive for phospholipids and cholesteryl esters. Characterization of the multilamellar inclusions by electron microscopy showed that these contained onion skinlike accumulations that are a sign of phospholipids. Similar ultrastructural abnormalities were observed in proximal tubular cells of animals and humans exposed to aminoglycosides such as gentamicin.10,11,21 Few studies demonstrated that these inclusions resulted from an intralysosomal accumulation of phospholipids.10,11,21–25 However, in kidney with HFD, the exact composition of the intralysosomal lipid species has not been clearly demonstrated. In this study, we performed two specific stains, LFB and Nile Red, to demonstrate that the vacuoles contained phospholipids and neutral cholesteryl esters. Importantly, we assessed a significant increase of phosphatidylcholine and cholesterol in kidney tissue in mice fed a HFD, an increase that was prevented by AICAR treatment. However, the pattern and regulation of lipid accumulation in the liver differs from the kidney, suggesting the lipid vacuole accumulation is regulated by different metabolic pathways in the liver and kidney.
To further characterize the basis for lipid vacuole formation, we evaluated lysosomal function. Indeed, it is known that overloaded lysosomes are usually excluded from the normal pathway of lysosome–endocytosis fusion and autophagy.26 Electron microscopy analysis revealed an increase of intracellular vacuoles with HFD. Moreover, the specific lysosome marker, LAMP1, was expressed on the margins of the lipid vacuoles, suggesting lysosome dysfunction such as in lysosomal storage disorders.27,28 Indeed, it has been shown that with lysosomal inhibition, LAMP1 is colocalized with the lipid droplets.27 The change of lysosome accumulation reflects an overloading of the lysosomal system that may reflect a change of autophagy activity.29 Autophagy is known as a protective process against cellular injury and has been showed to protect tubular cells against kidney injury30,31 but is impaired in liver and adipose tissue with HFD.27,32–34 The role of autophagy and lipophagy will need to be characterized in the HFD model.
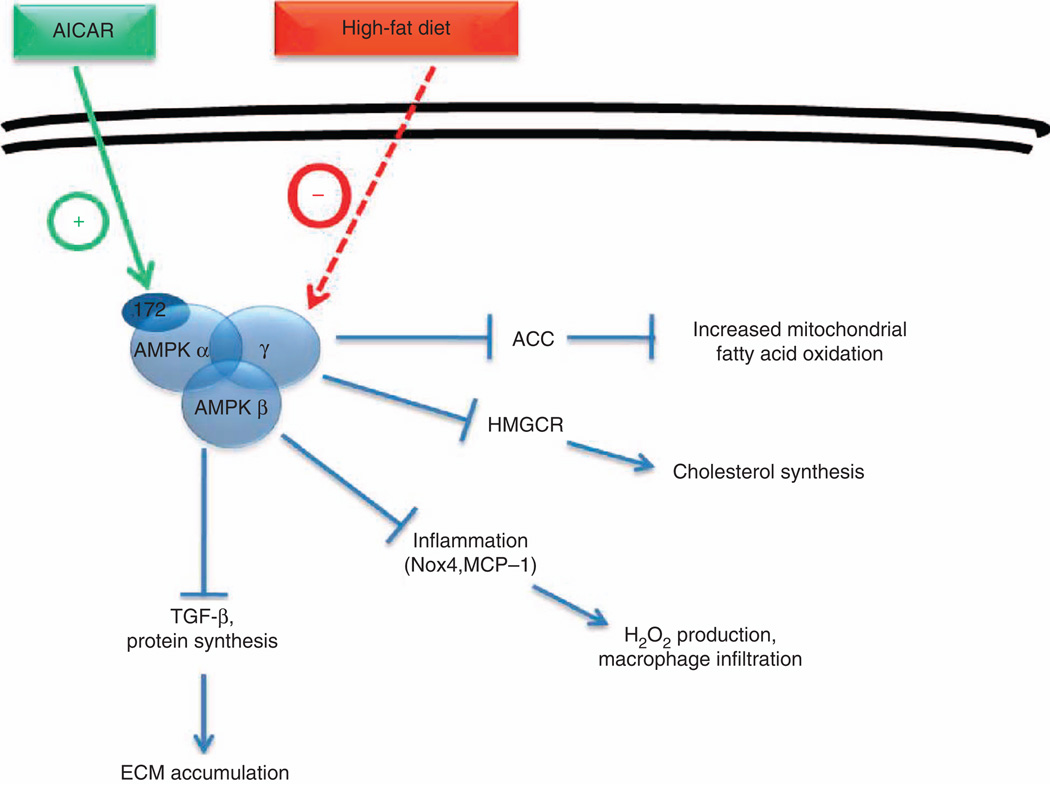
It is noteworthy that with our experimental conditions, altered lipid metabolism seemed not to affect mitochondrial structure and function. Indeed, in the kidney, mitochondrial function as shown by the COX activity and localization as well as complex activity was not changed in mice fed a HFD. Our observations are similar to those published by Ruggiero et al.35 who did not detect a reduction in mitochondrial respiratory function and biogenesis in the kidney. However, they demonstrated a significant increase of H2O2 emission in the mitochondria that may suggest an impairment of the redox balance. The production of mitochondrial H2O2 may explain the significant increase of H2O2 level that we detected in renal tissue from mice fed a HFD. The pathways connecting lipid accumulation in the kidney with markers of inflammation and fibrosis are unclear but are likely regulated by key metabolic steps that are tissue specific (Figure 10).
Figure 10. Representation of AMPK in kidney tissue in response to high-fat diet.
ACC, acetyl CoA carboxylase; AICAR, 5-aminoimidazole-4-carboxamide-1-β-d-furanosyl 5'-monophosphate; AMPK, AMP-activated protein kinase; ECM, extracellular matrix; HMGCR, 3-hydroxy-3-methylglutaryl-CoA reductase; H2O2, hydrogen peroxide; MCP-1, monocyte chemoattractant protein-1; Nox4, NADPH oxidase 4; ROS, reactive oxygen species; TGF-β, transforming growth factor-β.
In conclusion, our present data demonstrate that lipid accumulation occurs in the kidney after a high-fat caloric exposure, leading to impairment of tubular cell structure and associated inflammation and fibrosis. The central energy sensor, AMPK, appears to play a beneficial role. Indeed, upon activation AMPK reduces extracellular matrix expansion and suppresses inflammation. AMPK prevents lipid accumulation by inhibiting fatty acid synthesis (inhibition of ACC by phosphorylation). AMPK also modifies HMGCR activity, thereby regulating cholesterol synthesis. Intracellular lipid accumulation is then ameliorated with AMPK activation by decreased synthesis and the stimulation of increased utilization of fatty acids for energy metabolism rather than for storage.
MATERIALS AND METHODS
Animals
C57BL/6 mice were purchased from Jackson Laboratory (Bar Harbor, ME). All animal procedures were approved by the institutional animal care and use committee of the University of California, San Diego. The 6-week-old mice were fed a STD (5% fat, 24.5% protein, and 40% carbohydrate) or a HFD (60% of total calories from fat (90% lard + 10% soybean oil), 20% protein, and 20% carbohydrate; D12492, Research Diets, New Brunswick, NJ) treated or not with AICAR (Toronto Chemicals, North York, ON) with a dose of 0.5mg/g body weight per day intraperitoneally for 5 days a week for 14 weeks. AICAR administration began concomitantly to the HFD initiation. AICAR acts as an AMP-activated protein kinase agonist by mimicking the action of AMP, after it is metabolized to ZMP (5-aminoimidazole-4-carboxamide-l-β-d-furanosyl 5’-monophosphate), an AMP analog. AICAR actions are specific to increasing AMPK activation in the cell.36 The dose was chosen based on our previous study,6 demonstrating the beneficial effects of AMPK activity using AICAR treatment at 0.5mg per g body weight.
Mice were placed in metabolic cages for 24-h urine collection at baseline and after week 14, and the body weight and the blood glucose were also measured at these time points. Mice were killed after 14 weeks on diet. Blood samples were collected and portions of kidneys were snap-frozen in liquid nitrogen for further analysis. An additional portion was frozen in optimal cutting temperature (OCT) or fixed in 4% paraformaldehyde for immunostaining. The other kidney was placed in ice-cold Biops (K-MES 50 mmol/l, pH 7.1, Taurine 20 mmol/l, Imidazole 20 mmol/l, ATP 5.8 mmol/l, MgCl2 6.6 mmol/l, Na2-Phosphocreatine 15 mmol/l, DTT 0.5 mmol/l, K2-EGTA 10 mmol/l, and CaCO3 2.8 mmol/l; adjusted to pH 7.1) for mitochondrial tissue isolation and electron transport chain activity measurement.
Cell culture design
Human renal proximal tubular epithelial cells and media were purchased from ScienCell Research Laboratories (Carlsbad, CA). They were grown in Epithelial Cell Medium (EpiCM) containing fetal bovine serum, epithelial cell growth supplement (EpiCGS), and penicillin/streptomycin solution (ScienCell Research Laboratories). At 1 day before treatment with AICAR (2 mmol/l), bovine serum albumin (BSA; 300 µmol/l), or PA (300 µmol/l), cells were plated in Epithelial Cell Medium-basal. PA and endotoxin-free BSA (5.5 g; Sigma, no. A8806, St Louis, MO) were added to 50 ml of Krebs Ringer bicarbonate buffer. Palmitate (10 mmol/l final, Sigma) was prepared in 1ml of ethanol and then added to the BSA under nitrogen. Samples were filter sterilized and concentrations were assayed using the NEFA-HR kit (Wako Diagnostics, Richmond, VA). In the same manner, the BSA control was prepared with ethanol. The next day, cells were treated with AICAR, BSA, or PA.
Urine and plasma data
The urine albumin and creatinine were measured with a mouse Albuwell ELISA kit and a Creatinine Companion kit (Exocell, Philadelphia, PA). As an index of oxidative stress, urine samples were also analyzed for H2O2 by Amplex red assay (Invitrogen, Grand Island, NY) following the manufacturer’s protocol. The levels of MCP-1 and TGF-β were measured with ELISA kits (BD OptEIA Mouse MCP-1 and BD OptiEIA human TGF-β1 ELISA Set, respectively, BD Biosciences, San Diego, CA) following the manufacturer’s protocol. Plasma insulin and adiponectin levels were determined by ELISA kits (Millipore, Billerica, MA).
Morphologic analysis
Morphometry of sections of kidneys was carried out as previously reported.6 Briefly, 35 randomly selected glomeruli in the outer cortex of each kidney section were evaluated in a blinded manner. An image of each glomerulus was overlaid with grids. Each grid intersection was determined for the following features: capillary lumen, periodic acid–Schiff–positive mesangial area, and nuclear number. The accumulation of all the grid intersections was calculated for overall glomerular area. In addition, the frequency of tubules containing vacuolated cells was evaluated by a semiquantitative basis by adapting a single-blind analysis. To standardize the evaluation procedure, an additional lens engrave with a square grid was inserted in one of microscope eyepieces. For each paraffin section, 10 square fields (0.084mm2/field) were observed at ×400 magnification.
Characterization of tubular vacuole accumulation was evaluated on paraffin-embedded sections using the LFB, and frozen kidney sections were stained with Nile Red (Sigma).
Electron microscopy
Kidneys were flushed with cold Hanks’ balanced salt solution and cut into small blocks (1mm3), and then processed in order to be embedded in epoxy resin as previously described.37 Ultrathin sections were cut on Reichert ultramicrotome (Depew, NY) using diamond knife and transferred to Formvar/carbon-coated copper grids and contrasted in 2% uranyl acetate and lead nitrate. Sections were then examined using Jeol JEM 1200EX II transmission electron microscope (JEOL, Peabody, MA), and photographed using a Gatan Orius 600 digital camera (Pleasanton, CA).
Immunohistochemistry
Immunostaining of COX (Thermo Scientific, Waltham, MA), CD43 (macrophage, BD Biosciences, San Diego, CA), pACC (Cell Signaling, Danvers, MA), HMGCoA reductase (Santa Cruz, Dallas, TX), nitrotyrosine (Cell Signaling), and LAMP1 (Abcam, Cambridge, MA) was performed on paraffin-embedded kidney section.38 Briefly, after dewaxing and rehydration, a microwave pretreatment in citrate buffer (pH 6.2) was performed to unmask antigens present in the renal tissue. Tissue sections were then incubated for 1 h with different primary antibodies. After rinsing in phosphate-buffered saline, slides were exposed for 30 min to the appropriate secondary antibody. Kidney sections were finally incubated with ABC complex (Vector Laboratories, Burlingame, CA) for 30 min and bound peroxidase activity was detected with the 3, 3′-diaminobenzidine kit. ImageJ software (Bethesda, MD) was finally used to quantify the percentage of positive area. A total of 20 fields randomly taken at ×200 (COX) or ×400 (CD43, pACC, and LAMP1) magnification in the renal tissue were analyzed from 6 mice per group.
Immunofluorescence
Immunofluorescence was performed either on frozen kidney sections or paraffin kidney sections with a goat anti-type I collagen (SouhernBiotech, Birmingham, AL) or rabbit anti-pAMPK (Cell Signaling) primary antibodies, respectively. Slides were observed with a confocal LSM 510 microscope (Zeiss, Thornwood, NY), and representative photographic images were performed at a magnification of ×63 in the renal tissue from six mice per group.
Immunoblot
The proteins extracted from total kidney or cellular lysates were run on NuPAGE bis-Tris gels (Life Technologies, Grand Island, NY) and transferred onto nitrocellulose membrane (Life Technologies). The following antibodies were used: phospho-ACC and ACC (Cell Signaling), phosphor-AMP and AMPK (Cell Signaling), NOX4 (Novus Biologicals, Littleton, CO), LAMP1 (Abcam), and actin (Sigma). Detection was performed with ECL Plus detection reagents (GE Healthcare, Pittsburgh, PA).
Isolation of tissue mitochondria
Fresh tissue was transferred in cold Biops, then rinsed with ice-cold MSM (225 mmol/l mannitol, 75 mmol/l sucrose, 5 mmol/l MOPS, pH 7.4, and 2 mmol/l K-EGTA) and minced. The tissue was placed in a Potter-Elvehjem Teflon/glass homogenizer driven by an electric drill and 9 volumes of MSM at 4 °C were added. The supernatant was centrifuged at 7000 g for 10 min at 4°C. The mitochondrial pellet was resuspended in 10 volumes of ice-cold MSM and centrifuged at 7000 g for 10 min at 4°C. This was repeated with Sucrose Buffer (250 mmol/l sucrose, 0.1 mmol/l K-EGTA). The washed mitochondrial pellet was stored in 0.2 ml per g of tissue wet weight of Sucrose Buffer.
Respiratory chain enzymology
The enzymatic activity of mitochondrial complex I was measured as NADH:CoQ1 oxidoreductase activity by the method of Hatefi.39 Complex IV was measured as COX activity by the method of Wharton and Tzagoloff40 and expressed as an apparent first-order rate constant. Citrate synthase activity was used as a marker of mitochondrial mass and was measured by the method of Shepherd and Garland.41 Rates were expressed as the ratio of respiratory chain enzyme activity to citrate synthase activity.
Snap-frozen tissue triphasic extraction method for proteomics and metabolomics
Snap-frozen tissue (30–90 mg) was homogenized in glass/glass homogenizer (Tenbroeck, Kimble/Kontes Glass, Vineland, NJ) kept chilled on ice with 0.7 ml of nitrogen-sparged acid methanol:(0.2N HCl/0.2M NaCl) (4:1 mix). Then, 310 µl of nitrogen-sparged chloroform was added for the first-phase extraction, followed by a 30-s vortex to mix, extract, and denature all the proteins. The second-phase extraction took place with another 250 µl of chloroform and 300 µl of water. The samples were centrifuged at 16,000 g for 10 min at 4 °C to separate the phases. The upper methanol phase was stored in eppendorf tubes at −80 °C, and used for H2O2 (Amplex Red, Invitrogen) and short-chain NEFA measurements. The lower chloroform phase was stored in amber glass vials at −80 °C, and used for measurement of lipid peroxides (Cayman Chemicals, Ann Harbor, MI), total glyceryl lipids (Wako, Richmond, VA), long-chain NEFA (Wako), phosphatidylcholine (Wako), and cholesteryl–lipids (Calbiochem, San Diego, CA) according to the manufacturer’s protocols.
Statistical analysis
Results are presented as mean values±s.e.m. The level for statistical significance was defined as P < 0.05. Analyses were carried out using GraphPad Prism Software version 4.03 (San Diego, CA). Differences between data groups were evaluated for significance using independent t-test of data or one-way analysis of variance and Newman–Keuls post hoc tests for multiple comparisons.
ACKNOWLEDGMENTS
This study was supported by grants from a VA MERIT Award (5101BX000277) (KS) and NIDDK (U01 DK060995, DP3 DK094352-01, and DK083142 awards) to KS as well as grants from Erasme Foundation (Erasme Hospital, Brussels, Belgium) to JLN. A-ED was a research fellow supported by the Belgian fund 'Wallonie-Bruxelles International'. We thank Dr G Laurent of UMons and Pr N Caron of UNamur (Belgium) for their helpful comments regarding the intratubular vacuoles as well as T Meerloo for his wonderful technical help in the EM study.
Footnotes
DISCLOSURE
All the authors declared no competing interests.
REFERENCES
- 1.Collins AJ, Foley RN, Herzog C, et al. US Renal Data System 2010 Annual Data Report. American journal of kidney diseases: the official journal of the National Kidney Foundation. 2011;57(1 Suppl 1):A8, e1–e526. doi: 10.1053/j.ajkd.2010.10.007. [DOI] [PubMed] [Google Scholar]
- 2.Marcussen N. Atubular glomeruli and the structural basis for chronic renal failure. Lab Invest. 1992;66:265–284. [PubMed] [Google Scholar]
- 3.Taft JL, Nolan CJ, Yeung SP, et al. Clinical and histological correlations of decline in renal function in diabetic patients with proteinuria. Diabetes. 1994;43:1046–1051. doi: 10.2337/diab.43.8.1046. [DOI] [PubMed] [Google Scholar]
- 4.Gilbert RE, Cooper ME. The tubulointerstitium in progressive diabetic kidney disease: more than an aftermath of glomerular injury? Kidney Int. 1999;56:1627–1637. doi: 10.1046/j.1523-1755.1999.00721.x. [DOI] [PubMed] [Google Scholar]
- 5.Chagnac A, Weinstein T, Korzets A, et al. Glomerular hemodynamics in severe obesity. Am J Physiol Renal Physiol. 2000;278:F817–F822. doi: 10.1152/ajprenal.2000.278.5.F817. [DOI] [PubMed] [Google Scholar]
- 6.Decleves AE, Mathew AV, Cunard R, et al. AMPK mediates the initiation of kidney disease induced by a high-fat diet. J Am Soc Nephrol. 2011;22:1846–1855. doi: 10.1681/ASN.2011010026. [DOI] [PMC free article] [PubMed] [Google Scholar]
- 7.Stapleton D, Mitchelhill KI, Gao G, et al. Mammalian AMP-activated protein kinase subfamily. J Biol Chem. 1996;271:611–614. doi: 10.1074/jbc.271.2.611. [DOI] [PubMed] [Google Scholar]
- 8.Yamauchi T, Kamon J, Ito Y, et al. Cloning of adiponectin receptors that mediate antidiabetic metabolic effects. Nature. 2003;423:762–769. doi: 10.1038/nature01705. [DOI] [PubMed] [Google Scholar]
- 9.Steinberg GR, Kemp BE. AMPK in health and disease. Physiol Rev. 2009;89:1025–1078. doi: 10.1152/physrev.00011.2008. [DOI] [PubMed] [Google Scholar]
- 10.Laurent G, Carlier MB, Rollman B, et al. Mechanism of aminoglycoside-induced lysosomal phospholipidosis: in vitro and in vivo studies with gentamicin and amikacin. Biochem Pharmacol. 1982;31:3861–3870. doi: 10.1016/0006-2952(82)90303-3. [DOI] [PubMed] [Google Scholar]
- 11.De Broe ME, Paulus GJ, Verpooten GA, et al. Early effects of gentamicin, tobramycin, and amikacin on the human kidney. Kidney Int. 1984;25:643–652. doi: 10.1038/ki.1984.69. [DOI] [PubMed] [Google Scholar]
- 12.Carling D. The AMP-activated protein kinase cascade-a unifying system for energy control. Trends Biochem Sci. 2004;29:18–24. doi: 10.1016/j.tibs.2003.11.005. [DOI] [PubMed] [Google Scholar]
- 13.Hardie DG, Hawley SA, Scott JW. AMP-activated protein kinase-development of the energy sensor concept. J Physiol. 2006;574(Pt 1):7–15. doi: 10.1113/jphysiol.2006.108944. [DOI] [PMC free article] [PubMed] [Google Scholar]
- 14.Woods A, Dickerson K, Heath R, et al. Ca2 + /calmodulin-dependent protein kinase kinase-beta acts upstream of AMP-activated protein kinase in mammalian cells. Cell Metabol. 2005;2:21–33. doi: 10.1016/j.cmet.2005.06.005. [DOI] [PubMed] [Google Scholar]
- 15.Maunsbach AB. The influence of different fixatives and fixation methods on the ultrastructure of rat kidney proximal tubule cells. I. Comparison of different perfusion fixation methods and of glutaraldehyde, formaldehyde and osmium tetroxide fixatives. J Ultrastruct Res. 1966;15:242–282. doi: 10.1016/s0022-5320(66)80109-0. [DOI] [PubMed] [Google Scholar]
- 16.Maunsbach AB. The influence of different fixatives and fixation methods on the ultrastructure of rat kidney proximal tubule cells. II. Effects of varying osmolality, ionic strength, buffer system and fixative concentration of glutaraldehyde solutions. J Ultrastruct Res. 1966;15:283–309. doi: 10.1016/s0022-5320(66)80110-7. [DOI] [PubMed] [Google Scholar]
- 17.Maunsbach AB. Observations on the segmentation of the proximal tubule in the rat kidney. Comparison of results from phase contrast, fluorescence and electron microscopy. J Ultrastruct Res. 1966;16:239–258. doi: 10.1016/s0022-5320(66)80060-6. [DOI] [PubMed] [Google Scholar]
- 18.Jiang T, Liebman SE, Lucia MS, et al. Role of altered renal lipid metabolism and the sterol regulatory element binding proteins in the pathogenesis of age-related renal disease. Kidney Int. 2005;68:2608–2620. doi: 10.1111/j.1523-1755.2005.00733.x. [DOI] [PubMed] [Google Scholar]
- 19.Deji N, Kume S, Araki S, et al. Structural and functional changes in the kidneys of high-fat diet-induced obese mice. Am J Physiol Renal Physiol. 2009;296:F118–F126. doi: 10.1152/ajprenal.00110.2008. [DOI] [PubMed] [Google Scholar]
- 20.Kume S, Uzu T, Araki S, et al. Role of altered renal lipid metabolism in the development of renal injury induced by a high-fat diet. J Am Soc Nephrol. 2007;18:2715–2723. doi: 10.1681/ASN.2007010089. [DOI] [PubMed] [Google Scholar]
- 21.Beauchamp D, Laurent G, Maldague P, et al. Protection against gentamicin-induced early renal alterations (phospholipidosis and increased DNA synthesis) by coadministration of poly-L-aspartic acid. J Pharmacol Exp Ther. 1990;255:858–866. [PubMed] [Google Scholar]
- 22.Aubert-Tulkens G, Van Hoof F, Tulkens P. Gentamicin-induced lysosomal phospholipidosis in cultured rat fibroblasts. Quantitative ultrastructural and biochemical study. Lab Invest. 1979;40:481–491. [PubMed] [Google Scholar]
- 23.Fillastre JP, Hemet J, Tulkens P, et al. Comparative nephrotoxicity of four aminoglycosides: biochemical and ultrastructural modifications of lysosomes. Adv Nephrol Necker Hosp. 1983;12:253–275. [PubMed] [Google Scholar]
- 24.Houghton DC, Lee D, Gilbert DN, et al. Chronic gentamicin nephrotoxicity Continued tubular injury with preserved glomerular filtration function. Am J Pathol. 1986;123:183–194. [PMC free article] [PubMed] [Google Scholar]
- 25.Giuliano RA, Paulus GJ, Verpooten GA, et al. Recovery of cortical phospholipidosis and necrosis after acute gentamicin loading in rats. Kidney Int. 1984;26:838–847. doi: 10.1038/ki.1984.226. [DOI] [PubMed] [Google Scholar]
- 26.Giurgea-Marion L, Toubeau G, Laurent G, et al. Impairment of lysosome-pinocytic vesicle fusion in rat kidney proximal tubules after treatment with gentamicin at low doses. Toxicol Appl Pharmacol. 1986;86:271–285. doi: 10.1016/0041-008x(86)90058-x. [DOI] [PubMed] [Google Scholar]
- 27.Singh R, Kaushik S, Wang Y, et al. Autophagy regulates lipid metabolism. Nature. 2009;458:1131–1135. doi: 10.1038/nature07976. [DOI] [PMC free article] [PubMed] [Google Scholar]
- 28.Hulkova H, Elleder M. Distinctive histopathological features that support a diagnosis of cholesterol ester storage disease in liver biopsy specimens. Histopathology. 2012;60:1107–1113. doi: 10.1111/j.1365-2559.2011.04164.x. [DOI] [PubMed] [Google Scholar]
- 29.Wu G, Liu L, Huang J, et al. Alterations of autophagic-lysosomal system in the peripheral leukocytes of patients with myocardial infarction. Clin Chim Acta. 2011;412:1567–1571. doi: 10.1016/j.cca.2011.05.002. [DOI] [PubMed] [Google Scholar]
- 30.Jiang M, Wei Q, Dong G, et al. Autophagy in proximal tubules protects against acute kidney injury. Kidney Int. 2012;82:1271–1283. doi: 10.1038/ki.2012.261. [DOI] [PMC free article] [PubMed] [Google Scholar]
- 31.Kaushal GP. Autophagy protects proximal tubular cells from injury and apoptosis. Kidney Int. 2012;82:1250–1253. doi: 10.1038/ki.2012.337. [DOI] [PMC free article] [PubMed] [Google Scholar]
- 32.Papackova Z, Dankova H, Palenickova E, et al. Effect of short- and long-term high-fat feeding on autophagy flux and lysosomal activity in rat liver. Physiol Res. 2012;61(Suppl 2):S67–S76. doi: 10.33549/physiolres.932394. [DOI] [PubMed] [Google Scholar]
- 33.Koga H, Kaushik S, Cuervo AM. Altered lipid content inhibits autophagic vesicular fusion. FASEB J. 2010;24:3052–3065. doi: 10.1096/fj.09-144519. [DOI] [PMC free article] [PubMed] [Google Scholar]
- 34.Mei S, Ni HM, Manley S, et al. Differential roles of unsaturated and saturated fatty acids on autophagy and apoptosis in hepatocytes. J Pharmacol Exp Ther. 2011;339:487–498. doi: 10.1124/jpet.111.184341. [DOI] [PMC free article] [PubMed] [Google Scholar]
- 35.Ruggiero C, Ehrenshaft M, Cleland E, et al. High-fat diet induces an initial adaptation of mitochondrial bioenergetics in the kidney despite evident oxidative stress and mitochondrial ROS production. Am J Physiol Endocrinol Metabol. 2011;300:E1047–E1058. doi: 10.1152/ajpendo.00666.2010. [DOI] [PMC free article] [PubMed] [Google Scholar]
- 36.Corton JM, Gillespie JG, Hawley SA, et al. 5-aminoimidazole-4-carboxamide ribonucleoside. A specific method for activating AMP-activated protein kinase in intact cells? Eur J Biochem. 1995;229:558–565. doi: 10.1111/j.1432-1033.1995.tb20498.x. [DOI] [PubMed] [Google Scholar]
- 37.Takeda T, McQuistan T, Orlando RA, et al. Loss of glomerular foot processes is associated with uncoupling of podocalyxin from the actin cytoskeleton. J Clin Invest. 2001;108:289–301. doi: 10.1172/JCI12539. [DOI] [PMC free article] [PubMed] [Google Scholar]
- 38.Decleves AE, Caron N, Nonclercq D, et al. Dynamics of hyaluronan, CD44, and inflammatory cells in the rat kidney after ischemia/reperfusion injury. Int J Mol Med. 2006;18:83–94. [PubMed] [Google Scholar]
- 39.Hatefi Y. Reconstitution of the electron-transport system of bovine heart mitochondria. Methods Enzymol. 1978;53:48–54. doi: 10.1016/s0076-6879(78)53012-7. [DOI] [PubMed] [Google Scholar]
- 40.Wharton DC, Tzagoloff A. Cytochrome oxidase from beef heart. Methods Enzymol. 1967;10:245–250. [Google Scholar]
- 41.Shepherd D, Garland PB. Citrate synthase from rat liver. Methods Enzymol. 1969;13:11–16. doi: 10.1042/bj1140597. [DOI] [PMC free article] [PubMed] [Google Scholar]


