Abstract
Plants adjust their sink‐organ growth rates, development and distribution of dry matter in response to whole‐plant photosynthate status. To advance understanding of these processes, potato (Solanum tuberosum L.) plants were subjected to CO2 and light flux treatments, and early tuber growth was assessed. Atmospheric CO2 (700 or 350 µmol mol–1) and light flux (shade and control illumination) treatments were imposed at two growth stages: tuber initiation (TI) and tuber bulking (TB). Elevated CO2 increased accumulation of total net biomass when imposed at both stages, and increased tuber growth rate by about 36 %, but did not increase the number of tubers. Elevated CO2 increased the number of cells in tubers at both TI and TB stages, whereas shade substantially decreased the number of cells at both stages. Generally, treatments did not affect cell volume or the proportion of nuclei endoreduplicating (repeated nuclear DNA replication in the absence of cell division), but the shade treatment led to a decrease in cell volume at TB and a decrease in endoreduplication at TI. Elevated CO2 increased, and shade decreased, glucose concentration and soluble invertase activity in the cambial zones at both TI and TB, whereas sucrose concentration and activities of glucokinase, fructokinase, cell‐wall‐bound invertase and thymidine kinase were unaffected. Modulation of tuber cell division was responsible for much of the growth response to whole‐plant photosynthate status, and treatments affected cambial‐zone glucose and soluble invertase in a pattern suggesting involvement of a glucose signalling pathway.
Key words: Solanum tuberosum L., potato tuber, elevated atmospheric CO2, cell division, cell proliferation, sugar regulation, sink capacity, partitioning.
INTRODUCTION
A sustained stimulation of net photosynthesis and growth in response to elevated atmospheric CO2 requires increased sink organ development to utilize and store additional photosynthate (Stitt, 1991; Bowes, 1993). Without this increased sink capacity, photosynthate can feed back and lead to compensatory downward regulation of biochemical activity of leaves, such that source activity is brought back into balance with sink activity (Paul and Foyer, 2001). Thus, the relative activity of sources and sinks is important to plant growth and crop yield.
According to the sink‐limitation hypothesis (Paul and Foyer, 2001; Woodward, 2002), the inability of a plant to develop new sinks restricts the extent to which elevated CO2 and other photosynthesis‐promoting factors may increase plant biomass accumulation and crop yield. In general, plants are able to adjust the development of sink organs in response to altered whole‐plant photosynthetic rates (Scheidegger and Nosberger, 1984; Fonseca et al., 1996; Farrar et al., 2000), but the processes involved in such responses differ depending on the growth stage. During reproduction, elevated CO2 can increase the number and size of organs initiated, decrease the extent of organ abortion or increase the amount of storage‐material accumulated. However, little is known about the factors that limit the extent to which a plant can increase its reproductive sink‐organ development, or the regulatory mechanisms responsible.
Initiation and early development of potato tubers increase in response to elevated sugar concentration when tubers are grown in liquid culture (Dodds et al., 1992; Simko, 1994; Vreugdenhil et al., 1998), and single‐node cuttings (Cournac et al., 1991; Fujiwara et al., 1992; Xu et al., 1998). Tuber volume is a function of cell division and expansion (Liu and Xie, 2001; Sattelmacher and Laidig, 1991), both of which may be regulated by sugar supply. Cell division and expression of the cyclin D2 and D3 transcripts, which encode S‐phase regulatory proteins, are induced by sucrose (De Veylder et al., 1999; Riou‐Khamlichi et al., 2000). Furthermore, cell volume may be affected by endoreduplication—repetition of the S‐phase of the cell cycle in the absence of mitosis (Ranulu and Dijkhuis, 1986)—which is closely correlated with cell size in many plant systems (Larkins et al., 2001). Since elevated CO2 increases photosynthetic rates, and thus increases the supply of carbon for growth, analysis of mechanisms by which modulation of the supply of carbon alters sink‐organ development is needed.
Shading can also provide information regarding the mechanisms by which photosynthesis affects tuber development. Cloudy days and/or high plant density are common in the field and may limit growth. Thus, the interaction between CO2 and light on potato tuber production provides a greater range of conditions over which the impact of assimilate supply on tuber growth must be evaluated.
The objective of the present study was to evaluate the effect of altered whole‐plant photosynthate status on potato tuber growth, cell division and size. Elevated CO2 and shade treatments were used to obtain a range of whole‐plant photosynthate conditions, and tuber cell division, endoreduplication and cell expansion were compared with sugar concentrations and enzyme activities in the affected tissues. To investigate possible growth regulation by photosynthate fluxes, glucose and sucrose concentrations were measured in cambial zones where cell proliferation and expansion are most active and where phloem vasculature is abundant. This work shows that alteration of tuber cell division is responsible for much of the growth response to whole‐plant photosynthate status and that treatments affected cambial‐zone glucose and invertase in a pattern suggesting involvement of a glucose signalling pathway.
MATERIALS AND METHODS
Plant material
Potato plants (Solanum tuberosum L. ‘Katathdin’) were grown in a glasshouse where they received 14 h of supplementary light, providing a total irradiance of 30 mol photons (400–700 nm) m–2 d–1. Plants were watered automatically each day at 2‐h intervals during the light period with 1 l nutrient solution (1·08 g l–1 Peter’s 15‐16‐17 fertilizer; W.R. Grace and Co., Fogelsville, PA, USA). Watering was sufficient to leach excess nutrient salts. After 2 weeks, young plants were trimmed to one shoot and transplanted to 12 l pots. They were then grown in the glasshouse for an additional 4 weeks, before being moved to four matched growth chambers, two plants per chamber, where short days (10 h) were imposed to initiate tuber formation.
The controlled‐environment chambers (Model CEL‐63‐ 10; Sherer Inc., Marschall, MI, USA) were maintained at a temperature of 25/18 °C (day/night) and fluorescent/ incandescent lamps supplied 600 µmol photons (400–600 nm) m–2 s–1 at the top of the canopy. CO2 treatments were 700 (elevated) or 350 (ambient) µmol CO2 mol–1 air. Chamber CO2 concentration was monitored using a calibrated infrared gas analyser (Nova 421P; Nova Analytical Systems, Inc., Niagara Falls, NY, USA) which sampled each of the chambers alternately using computer‐controlled valves. The gas analyser output was interfaced to a computer data acquisition and control system (EnviroMac; Remote Measurement Systems, Inc., Seattle, WA, USA) that supplied CO2 to both the 350 and 700 µmol mol–1 chambers from a compressed CO2 cylinder as required to maintain the CO2 concentration within ±30 µmol mol–1 of the set point. Nutrient solution and watering were as in the glasshouse.
Shade and CO2 control
The elevated CO2 treatment was applied to plants at one of two stages: tuber initiation (TI), from 0 to 2 weeks after the start of the short‐day treatment; and tuber bulking (TB), from 2 to 4 weeks after the start of the short‐day treatment. Shade was imposed for 2 weeks either at the start of TI stage or at the start of TB stage. In each chamber, a double layer of black plastic mesh fabric, which reduced photon flux to 150 µmol photons (400–600 nm wavelength) m–2 s–1 (measured at the top of the canopy), was installed about 10 cm below the lamps to shield half of the plants in the chamber; the rest of the plants were left unshaded.
At the end of the treatments, tubers were dug out of the soil and weighed. Tubers from each plant were ranked by fresh mass and divided by tuber size into three groups, such that each category contained about one‐third of the tuber fresh biomass in the entire plant. Within each category, two or three tubers were chosen at random for determination of sugars and enzyme activity. For flow cytometry, two cores, longitudinal and transverse, were immediately withdrawn using a borer (0·5 cm diameter) and fixed in ethanol : acetic acid (3 : 1 v/v). A transverse slice (0·5 cm thick) was then cut from the apical‐bud end (rose end) of the tuber, 0·5 cm from the apex. This was frozen in liquid nitrogen and stored at –20 °C until required for determination of sugars and enzyme activity. The remaining tubers, leaves and stems were dried at 60 °C and dry biomass determined.
Flow cytometry
Slices were incubated with 0·5 % (w/v) pectinase (EC 3.2.1.15, Cat. no. 102588; ICN Biochemicals, Ohio, USA) for 18 h, without shaking, at 37 °C, then cooled overnight in a 4 °C refrigerator. Cell walls were mechanically disrupted to release nuclei into the medium by shaking for approx. 18 h (150 rpm) at 37 °C. Samples were stored at 4 °C, then filtered through nylon‐mesh fabric with 100 µm pores (Nitex; Teco Inc., Briarcliff Manor, NY, USA). The DNA‐binding fluorochrome, propidium iodide, was added to the filtrate to a final concentration of 90 µmol l–1 in a 10 mmol l–1 Tris‐HCl buffer (pH 7·4). A 100‐µl aliquot of filtrate was subjected to flow cytometry using either a FACScan analyser (Becton Dickinson, Mountain View, CA, USA), or an Epic Profile (Coulter Electronics, Hialeah, FL, USA) with an argon–neon laser (488 nm). Histograms of nuclear counts in each channel of fluorescence intensity were produced, as illustrated in Fig. 1, and nuclear counts of each DNA‐content size‐class were summed.
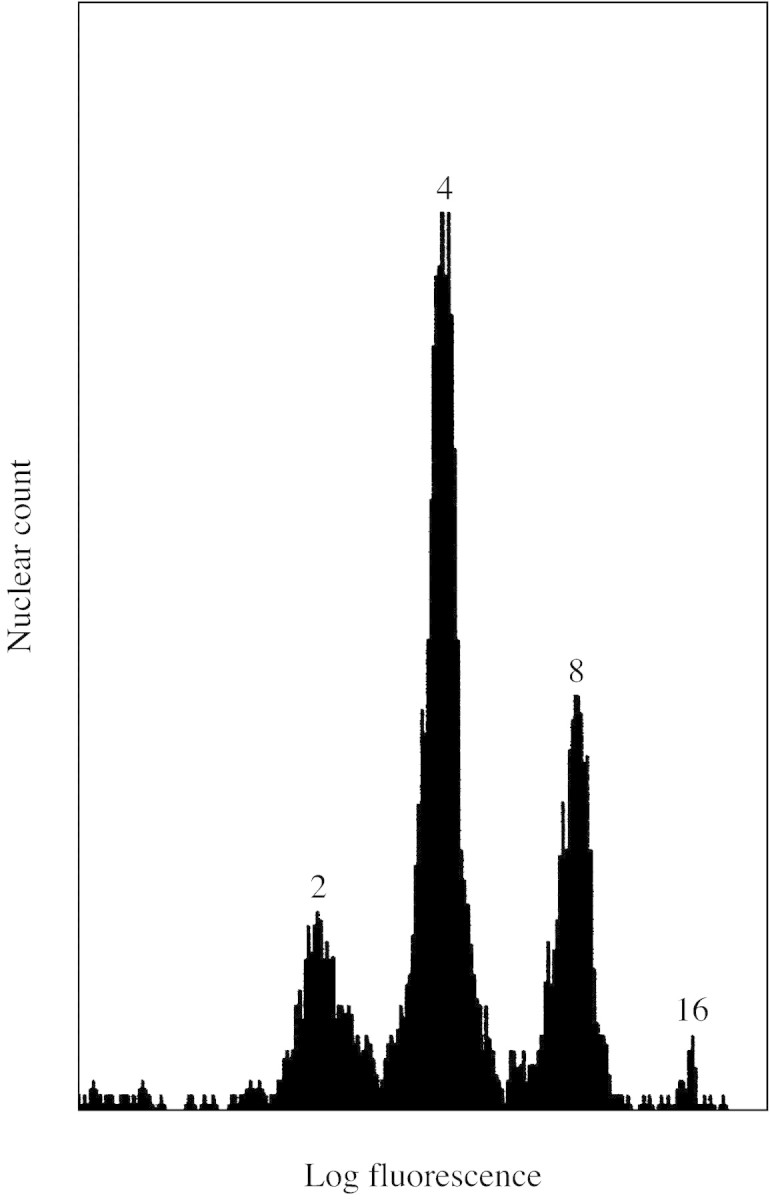
Fig. 1. Example histogram from flow cytometry analysis of the distribution of nuclei into DNA‐content size‐classes. Nuclei were treated with the fluorochrome propidium iodide. Each peak is labelled with its DNA copy number, where 1C is the haploid DNA content.
Sugars and enzyme activities
For determination of sugars and enzymes, cambial‐zone tissues were obtained from transverse slices of tubers using a 0·5 cm borer. These were homogenized with 50 mmol l–1 Hepes‐KOH (pH 7·4) buffer [tissue : buffer 1 : 2 (w/v)] containing 5 mmol l–1 MgCl2, 1 mmol l–1 EGTA, 1 mmol l–1 EDTA, 40 % (v/v) glycerol, 0·1 % (w/v) bovine serum albumin (BSA), 0·5 mmol l–1 dithiotheritol and 2 % (w/v) insoluble polyvinylpyrrolidone, and stored at –20 °C. Aliquots of supernatants (10 µl) were mixed with 90 µl ethanol and stored for sugar assay. Concentrations of glucose, fructose and sucrose were determined using an enzyme‐coupled assay based on hexokinase (EC 2.7.1.1, 0·14 unit) and glucose‐6‐phosphate dehydrogenase (EC 1.1.1.49, 0·07 unit), with phosphoglucoisomerase (EC 5.3.1.9, 0·2 unit) and invertase (EC 3.2.1.26, 80 units) interconverting fructose and sucrose (Cairns, 1987).
Activities of glucokinase (EC 2.7.1.2) and fructokinase (EC 2.7.1.4) were determined by assaying the glucose‐6‐phosphate (Gic‐6‐P) or fructose‐6‐phosphate (Fru‐6‐P) reaction products with glucose‐6‐phosphate dehydrogenase‐coupled assay (Cairns, 1987), without the addition of hexokinase. The enzyme extract (100 µl) was centrifuged at 16 000 g for 5 min, and the supernatant desalted on a Sephadex G‐25M column (Pharmacia, Inc., Piscataway, NJ, USA). The desalted enzyme extract (100 µl for glucokinase; 20 µl for fructokinase) was added to a reaction mix containing 4 mmol l–1 ATP, 10 mmol l–1 MgCl2, 8 mmol l–1 sodium nicotinamide adenine dinucleotide, 2 mmol l–1 thiazolyl blue, 6 mmol l–1 phenazine methylsulfate, 200 mmol l–1 imadazole‐HCl (pH, 6·8), 0·2 % (w/v) BSA, 0·07 unit of glucose‐6‐phosphate dehydrogenase, 0·2 unit of phosphoglucoisomerase and 0·8 mmol l–1 glucose (for glucokinase assay) or 0·8 mmol l–1 fructose (for fructokinase assay), to a final volume of 175 µl. After 45 min incubation at 24 °C, Glc‐6‐P was determined (Cairns, 1987).
To prepare soluble acid invertase extracts, 0·5 ml crude buffer‐extract was centrifuged at 16 000 g and desalted on a Sephadex G‐25M column. For cell‐wall‐bound (CWB) acid invertase, the pellet was resuspended in 1 ml 1 mol l–1 NaCl at 4 °C for at least 12 h, centrifuged at 16 000 g, and the supernatant was desalted on a Sephadex G‐25M column. Invertase inhibitor was disrupted by rapid up–down pipetting about five times. This led to a 10 to 20 % increase in measured activities (data not shown). Both soluble and CWB acid invertase activities were determined by mixing enzyme extract (150 µl) with 50 µl 1 mol l–1 sucrose to start the enzyme reaction, incubating for 75 min at 24 °C, and assaying for glucose (Cairns, 1987).
Thymidine kinase (EC 2.7.1.21) activity was determined by the rate of phosphorylation of 14C‐thymidine. Buffer‐extract suspensions (100 µl) were centrifuged at 16 000 g, desalted on a Sephadex G‐25M column and added to 50 µl of assay mixture containing 200 mmol l–1 Tris‐HCl (pH 7·5), 15 mmol l–1 ATP, 15 mmol l–1 MgCl2, 0·1 % (w/v) BSA, 5 mmol l–1 thymidine and 7·3 MBq l–1 [U‐14C]‐thymidine (2·2 MBq µmol–1; Amersham Biosciences, Piscataway, NJ, USA). Reactions were incubated at 30 °C for 1 h, and stopped by heating for 1 min at 100 °C. To recover the phosphorylated thymidine product, a 100 µl aliquot of diethyl‐amino‐ethyl (DEAE)‐cellulose was added to bind the negatively charged phosphorylated thymidine. The DEAE‐cellulose was washed four times with 200 mmol l–1 Tris‐HCl buffer (pH 7·5), then phosphorylated [14C]thymidine was eluted with 1 ml liquid scintillation cocktail (Liquiscint, no. FA16; National Diagnostics, Manville, NJ, USA) and counted using liquid scintillation spectrometry. Protein in enzyme extracts was quantified using the Bradford dye‐binding protein assay (Bio‐Rad Laboratories, Hercules, CA, USA) with BSA as a standard (0–100 µg). All enzyme assays were linear with time and amount of enzyme extract added.
Data analysis
Experiments were replicated with sequential batches (blocks) of same‐aged plants and there were two replicate plants within each treatment combination per batch. Two batches of plants were used in the experiments in which treatments were imposed at the TI stage, and three when treatments were imposed at the TB stage. Each batch (block) contained a complete set of light and CO2 treatments, which were randomly assigned to chambers. For biomass, tuber number and flow cytometry data, two‐way ANOVA was used to partition the total sums of squares into the following sources of variation: blocks, treatments, interaction of blocks and treatments, and error. The block × treatment interactions were not significant (P < 0·05). For cambial‐zone sugars and enzyme activities, data were analysed at each stage by ANOVA, with treatments, blocks and tuber size‐class as main effects, and two‐way interactions. Comparison of means was performed using the Duncan’s multiple range test with P < 0·05.
RESULTS
Effects of CO2 and light treatment on potato plant growth
Elevated CO2 (700 µmol CO2 mol–1) increased whole‐plant net biomass accumulation relative to that of control (350 µmol CO2 mol–1) plants when treatment was imposed at both tuber initiation and tuber bulking stages (Fig. 2). The additional biomass from elevated CO2 treatment was in the shoot (leaf plus stem) at the TI stage, whereas at the TB stage it was in the tubers. Conversely, at both the TI and TB stages, shade severely inhibited net biomass accumulation, such that plants grew very little (Fig. 2). When shade was imposed during the TI stage, more biomass accumulated in shoots. In contrast, tubers accumulated a large proportion of biomass when shade was imposed at the TB stage, to the extent that leaves and stems had a net loss of biomass. Thus, the TI and TB stages represented distinctly different phases of sink‐organ development. Treatment at these stages permitted a comparison of tuber growth response in plants spanning a wide range of tuber : shoot ratios.
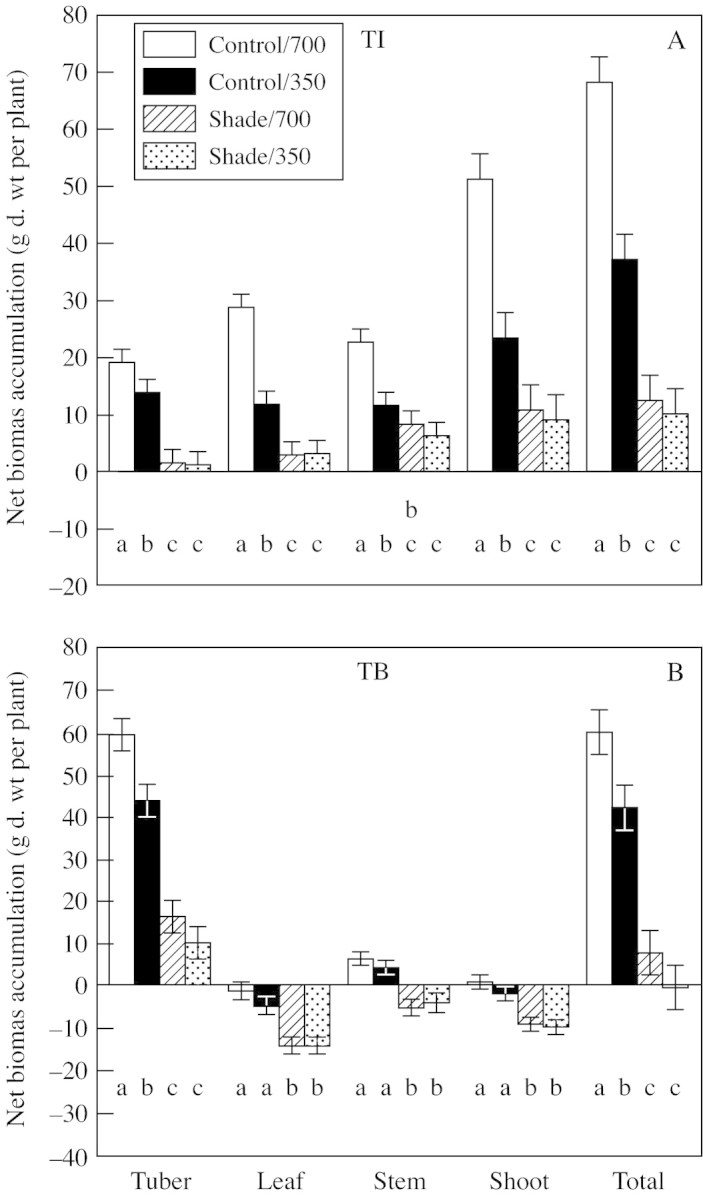
Fig. 2. Tuber, leaf, stem, shoot (leaf + stem) and total plant net biomass accumulation during light (shade or control illumination) and CO2 (350 or 700 µmol mol–1) treatments at tuber initiation (TI) and tuber bulking (TB) stages. Plants were harvested 2 (TI) or 4 weeks (TB) after transfer to short days, with exposure to treatments for 2 weeks prior to harvest in each case. Bars represent 5 % confidence intervals; means labelled with different letters differ significantly (P < 0·05).
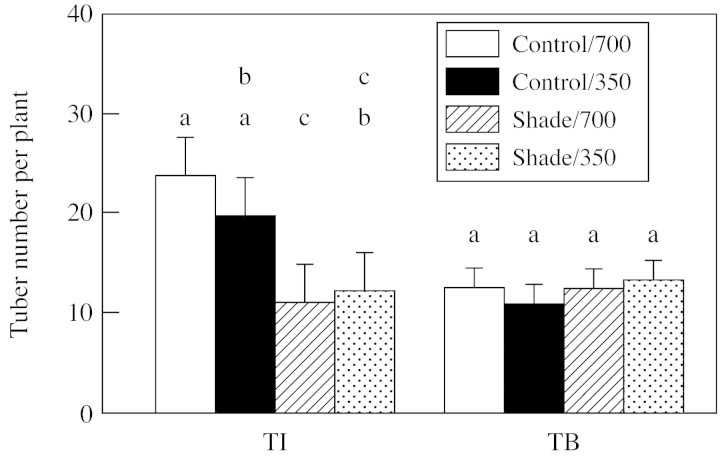
Tuber differentiation and growth were rapid during the 2 weeks following exposure to short days. Nevertheless, at the TI stage, elevated CO2 did not significantly (P ≤ 0·05) affect the number of tubers initiated during TI. Shade at the TI stage led to a 50 % decrease in tuber number compared with that in the unshaded control (Fig. 3).
Fig. 3. Tuber production in response to light (shade or control illumination) and CO2 (350 or 700 µmol mol–1) treatments at tuber initiation (TI) and tuber bulking (TB). Plants were harvested 2 (TI) or 4 weeks (TB) after transfer to short days, with exposure to treatments for 2 weeks prior to harvest in each case. Bars represent 5 % confidence intervals; means labelled with different letters differ significantly (P < 0·05).
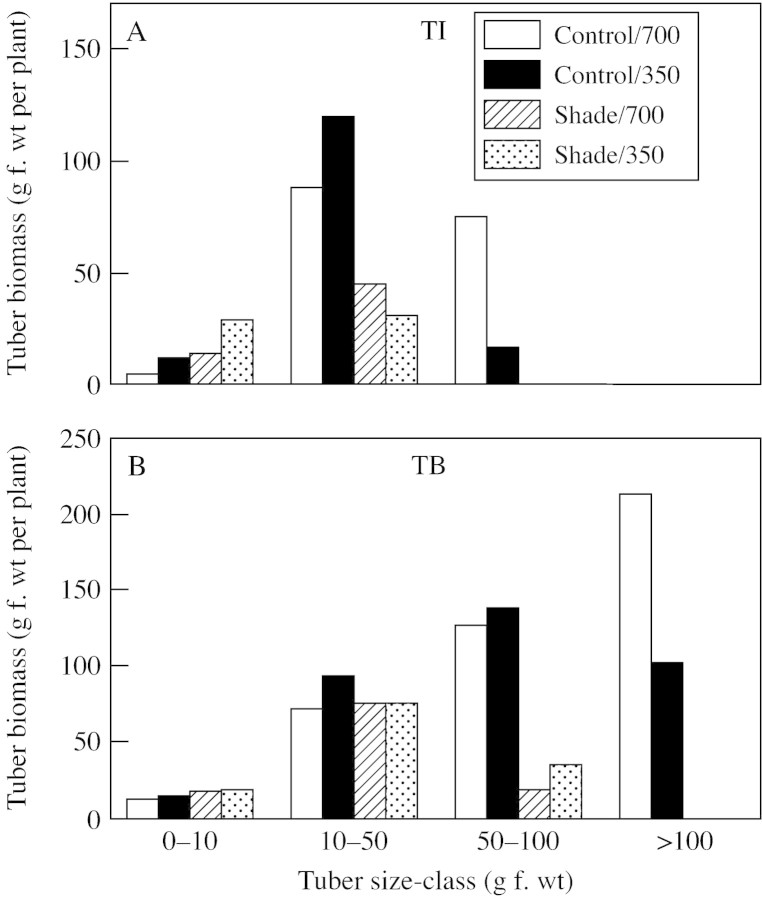
Plants exposed to treatments at the TB stage had been grown in the 350 µmol CO2 mol–1 (control) environment during their TI stage. During the TB stage, some of the tubers stopped growing or were resorbed, such that the number of tubers set in unshaded controls decreased by about 50 % from the number initiated at TI (Fig. 3). Elevated CO2 and shade did not affect the number of tubers set at TB. However, the distribution of tubers among various size‐classes was substantially affected at both TI and TB stages (Fig. 4). Control light and elevated CO2 increased the proportion of biomass in large tubers, whereas shade increased the proportion in small tubers. These observations show that at both TI and TB stages, the effect of elevated CO2 and shade on tuber development was mainly on tuber size, not tuber number.
Fig. 4. Distribution of tubers among individual tuber size‐classes in plants exposed to light (shade or control illumination) and CO2 (350 or 700 µmol mol–1) treatments at tuber initiation (TI) and tuber bulking (TB). Plants were harvested 2 (TI) or 4 weeks after transfer to short days (TB), with exposure to treatments for 2 weeks prior to harvest in each case.
Effect of CO2 and light treatment on potato tuber cell number and volume
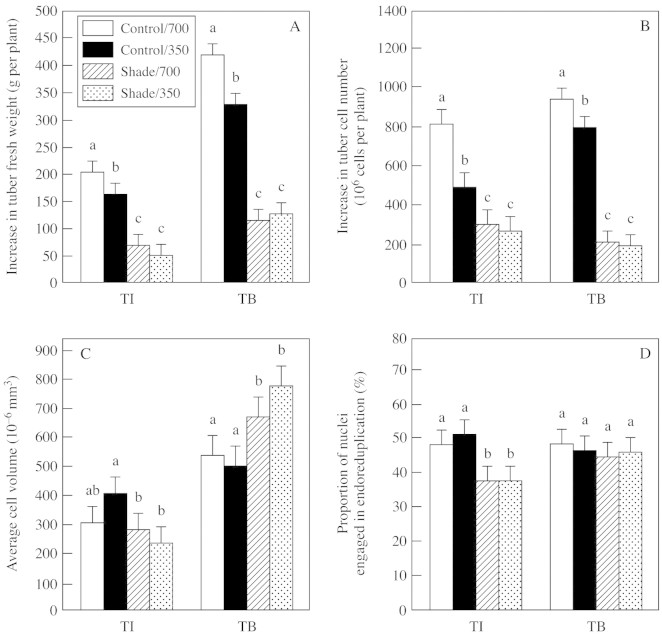
Compared with those in control plants, elevated CO2 increased cell numbers by 67 and 18 % at TI and TB stages, respectively. In contrast, cell volume and endoreduplication (nuclei with ≥8C DNA content, where 1C is the haploid DNA content) were not significantly (P ≤ 0·05) affected by elevated CO2 at either stage. Shade at the TI stage led to a 40 % decrease in the total number of tuber cells per plant, a 30 % decrease in average cell volume and a 25 % decrease in the proportion of nuclei in endoreduplicaton. At the TB stage, the predominate effect of shade was on cell proliferation: total tuber cell number per plant decreased by 75 %, average cell volume increased by 34–55 %, and the proportion of nuclei in endoreduplication was unchanged as a result of the shade treatment. Amongst the endoreduplicating nuclei, 8C nuclei predominated, and treatments did not affect the ratio of 8C to 16C nuclei (data not shown).
Effect of CO2 and light treatment on sugar concentration
Elevated CO2 increased glucose concentrations in cambial‐zone tissues at both both TI and TB compared with those in unshaded controls at normal CO2 (Fig. 6). In contrast, elevated CO2 did not affect sucrose concentrations. Shade treatment substantially decreased glucose in cambial‐zone tissues at both TI and TB. Sucrose was also substantially decreased by shade treatment at TB, but not at TI. Thus, glucose in cambial‐zone tissues was consistently related with tuber growth across all treatments and growth stages, whereas sucrose had a weak or no relationship with growth.
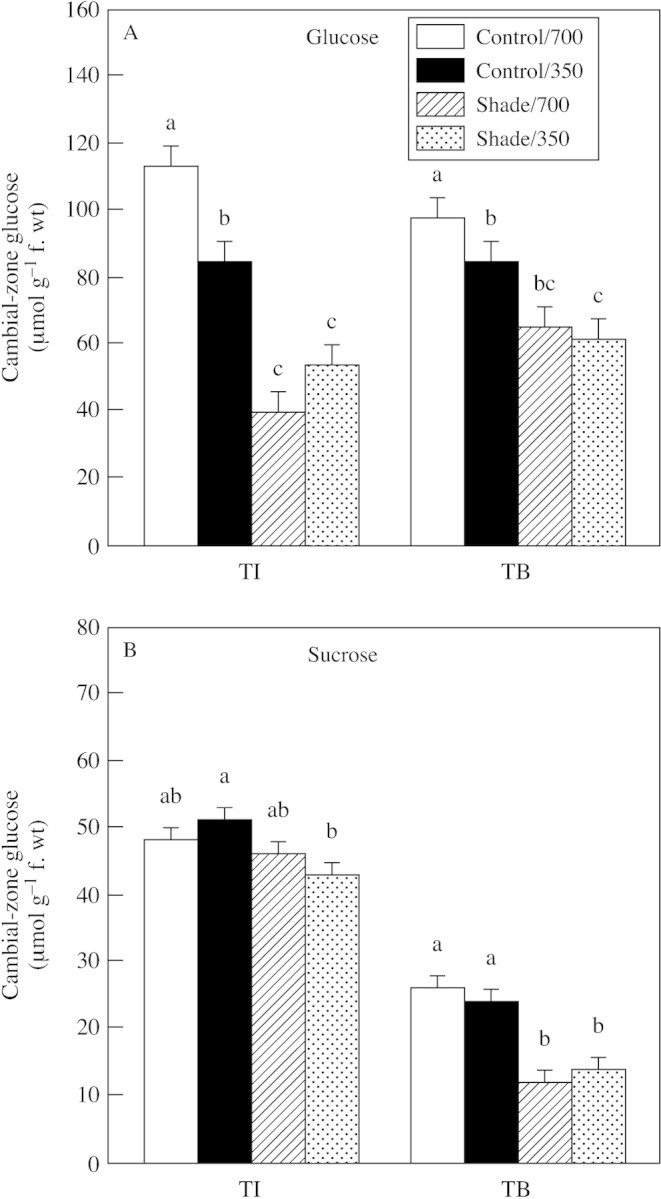
Fig. 6. Glucose (A) and sucrose (B) concentrations in cambial zones of tubers produced in plants exposed to light (shade or control illumination) and CO2 (350 or 700 µmol mol–1) treatments at tuber initiation (TI) and tuber bulking (TB). Plants were harvested 2 (TI) or 4 weeks (TB) after transfer to short days, with exposure to treatments for 2 weeks prior to harvest in each case. Bars represent the s.e.m. Means labelled with different letters differ significantly (P ≤ 0·05).
Effect of CO2 and light on acid invertase activity
At the TI stage, and in the absence of shade, elevated CO2 increased both soluble and CWB acid invertase activities in the cambial zone (Fig. 7). Conversely, shade at the TI stage decreased soluble invertase activity in the 350 µmol mol–1 CO2 treatment. Thus, at the TI stage, the treatments altered cambial‐zone invertase activities corresponding to their effects on tuber growth. At the TB stage, however, treatments generally had little or no impact on invertase activity. The only treatment effect on invertase at the TB stage was a decrease of soluble activity by shade.
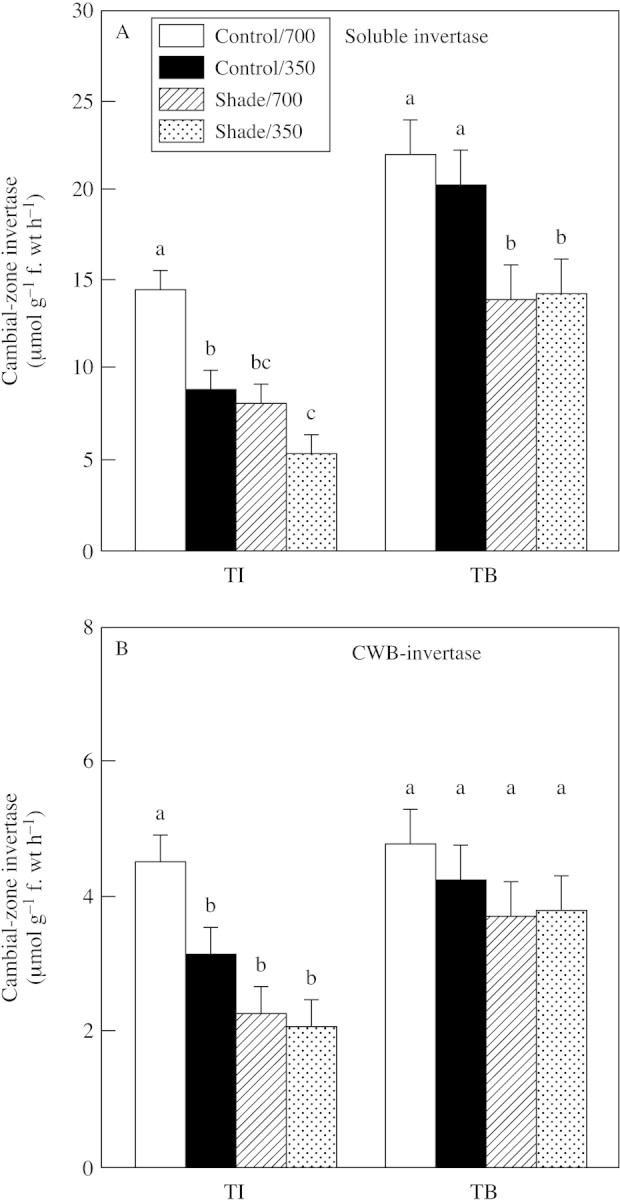
Fig. 7. Soluble acid invertase (A) and cell‐wall‐bound acid invertase (CWB‐invertase; B) activity in cambial zones of tubers produced in plants exposed to light (shade or control illumination) and CO2 (350 or 700 µmol mol–1) treatments at tuber initiation (TI) and tuber bulking (TB). Plants were harvested 2 (TI) or 4 weeks (TB) after transfer to short days, with exposure to treatments for 2 weeks prior to harvest in each case. Bars represent s.e.m. Means labelled with different letters differ significantly (P ≤ 0·05).
Effect of CO2 and light treatment on glucokinase, fructokinase and thymidine kinase activity
Activities of glucokinase, fructokinase and thymidine kinase were not affected by elevated CO2 (Fig. 8). Fructokinase activities were four‐ to five‐fold higher than those of glucokinase. Shade did not affect glucokinase, fructokinase or thymidine kinase activity in either CO2 treatment at the TI or TB stages. Only the activity of glucokinase decreased slightly in both the 350 and 700 µmol mol–1 CO2 treatments during TI.
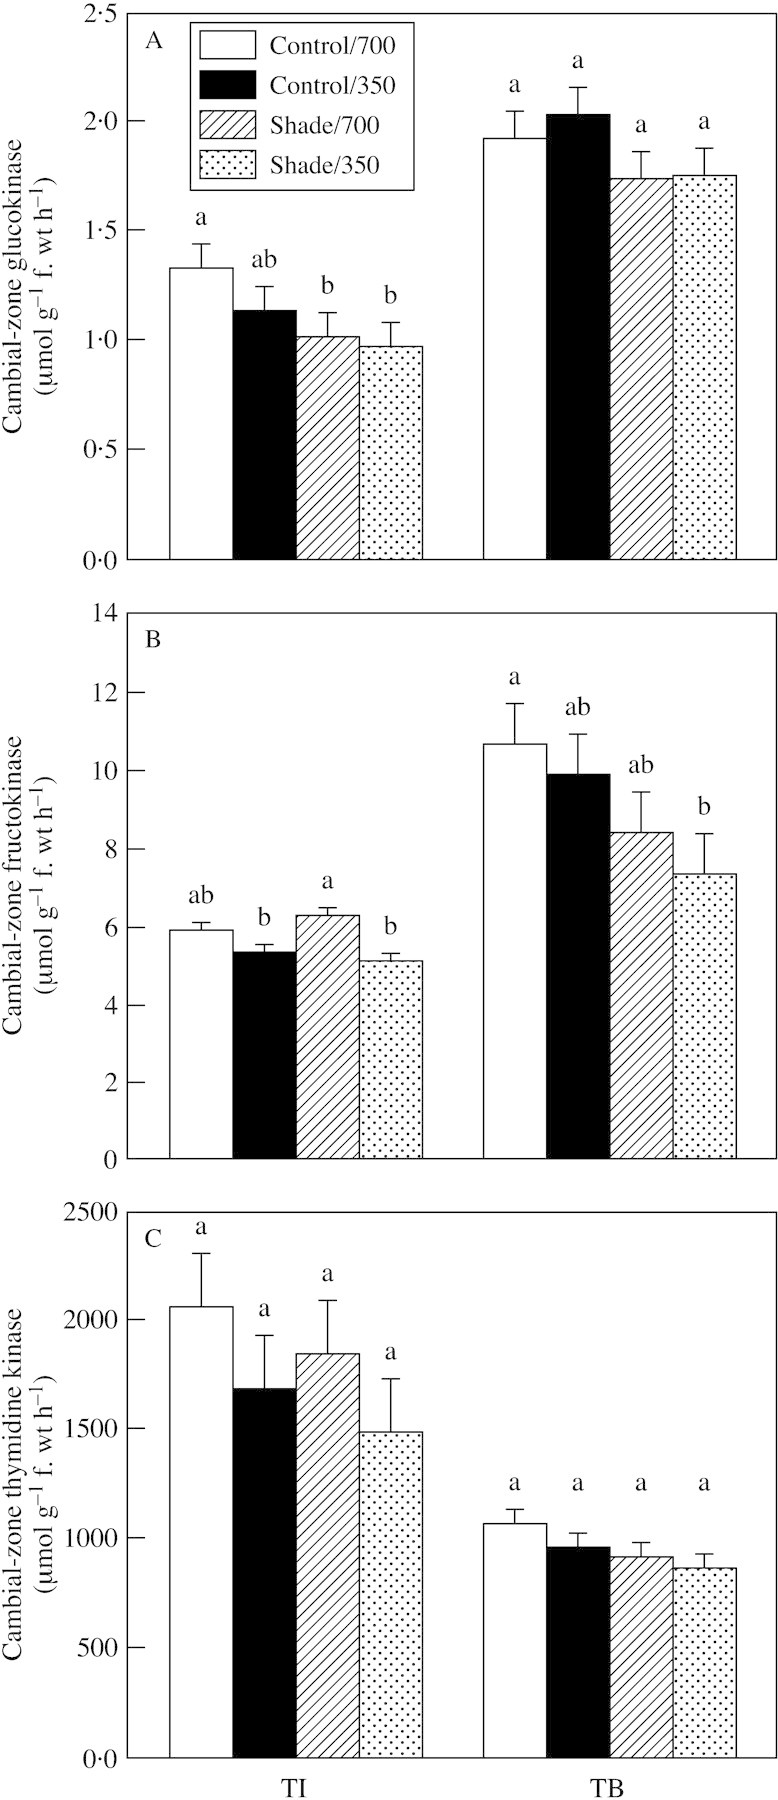
Fig. 8. Glucokinase (A), fructokinase (B) and thymidine kinase (C) activity in cambial zones of tubers produced in plants exposed to light (shade or control illumination) and CO2 (350 or 700 µmol mol–1) treatments at the tuber initiation (TI) and tuber bulking (TB). Plants were harvested 2 (TI) or 4 weeks (TB) after transfer to short days, with exposure to treatments for 2 weeks prior to harvest in each case. Bars represent s.e.m. Means labelled with different letters differ significantly (P ≤ 0·05).
DISCUSSION
Growth responses
At both the tuber initiation and tuber bulking stages of growth, the rate of dry mass accumulation, a measure of whole‐plant photoassimilation in excess of respiration, increased in response to elevated CO2 in unshaded conditions, but decreased in response to shade at both CO2 concentrations (Fig. 2). Thus, the experimental system provided a wide range of whole‐plant photosynthetic rates that were used to assess mechanisms by which photosynthate supply modulates the development of sink capacity.
In the shaded treatments, elevated CO2 did not further affect plant dry mass accumulation. Although elevated CO2 is expected to increase radiation use efficiency by decreasing Rubisco‐catalysed oxygenase flux (Stitt, 1991), the magnitude of such effects are limited in low light and are difficult to detect by measurements of whole‐plant dry mass (Wheeler et al., 1991).
There was a striking difference in the accumulation of biomass between shoots and tubers at the TI vs. TB stages. At TI, partitioning was mostly to leaves and stems, and elevated CO2 had little effect on tuber biomass accumulation, whereas at TB partitioning was solely to tubers. When photosynthesis was drastically decreased by shading at the TB stage, partitioning to tubers took priority, to the extent that leaves and stems were induced to senesce and remobilize plant reserves to the tubers. Such a shift in priority towards tuber growth at TB agrees with studies by Sale (1976), in which shading after tuber initiation was found to favour tuber growth over leaf and stem growth, whereas shading before tuber initiation did not favour partitioning to tubers. Thus, the growth of tubers in response to elevated CO2 and shade depended on the developmental stages of tubers and on competition with shoot development. Such modulation of tuber growth at different stages was due mainly to alterations in growth rates of initiated tubers rather than to increased number of tubers (Figs 3 and 4).
Cell division and expansion
Growth can be separated into its components: cell proliferation and cell expansion. Cell proliferation was assessed by determining the number of nuclei using flow cytometry. Cell expansion was assessed based on average cell volume, which is a dynamic function of the relative rates of new cell production by cell division, and post‐mitotic cell expansion. Results (Fig. 5) indicate that in unshaded plants at both TI and TB, elevated CO2 increased the number of cells in tubers, whereas cell expansion was not significantly affected (P < 0·05). Shade consistently decreased the proliferation of tuber cells at both stages, but average cell volume responded differently at the two stages. At TI, average cell volume decreased in response to shade, thus contributing to the decrease in fresh weight. But at TB, when shade decreased the proliferation of cells by 60 %, average cell volume increased, which is counter to the substantial decrease in fresh weight. Thus, cell proliferation appeared to respond in accord with whole‐plant photosynthate status and with treatment effects on tuber growth, whereas the extent of cell expansion was not consistently related to growth.
Fig. 5. Response of tuber growth and development to light (shade or control illumination) and CO2 (350 or 700 µmol mol–1) treatment at the tuber initiation (TI) and tuber bulking (TB) stages. Plants were harvested 2 (TI) or 4 weeks (TB) after transfer to short days, with exposure to treatments for 2 weeks prior to harvest in each case. The increase in tuber fresh weight (f. wt) (A) and total number of tuber cells per plant (B) during the treatment periods are shown. Average cell volume (C) was calculated from tuber volumes and the number of nuclei per tuber. The proportion of cells engaged in endoreduplication (D) represents the number of nuclei with a nuclear DNA content ≥8C (where 1C is the haploid nuclear DNA content), relative to the total number of nuclei in tubers. Bars represent 5 % confidence interval; means labelled with different letters differ significantly (P < 0·05).
Endoreduplication
Endoreduplication is common in plant tissues that have a storage function, and the extent of endoreduplication is usually closely correlated with the extent of cell expansion, organelle proliferation and post‐mitotic processes associated with development of sink capacity (Larkins et al., 2001). In this study, endoreduplication was unaffected by elevated CO2 or shade during TB (Fig. 5). Only shade at TI decreased endoreduplication. Thus, although both the mitotic cell cycle and post‐mitotic endoreduplication involve many of the same cell‐cycle regulatory systems, the two processes were affected differently by variation in plant photosynthate status. A similar conclusion was reached in maize endosperm, where endoreduplication was less responsive to treatments than was cell division (Setter and Flannigan, 2001, and references cited therein).
Response of cell proliferation to photosynthate
The finding that cell proliferation is highly responsive to plant photosynthate status is in agreement with results of other studies. In wheat, elevated CO2 increased the number of leaf meristem cells engaged in cell division, and increased the cell cycle rate, and it was through this effect that leaf growth rate and final size increased (Masle, 2000, and references cited therein). Similar effects occurred in maize and sunflower subjected to a range of light fluxes (Tardieu, 1999). Furthermore, studies have indicated that potato tuber cell division and development respond to sugar concentration, when applied exogenously (Dodds et al., 1992; Simko, 1994; Vreugdenhil et al., 1998; Xu et al., 1998). Expression of the cell cycle regulators, cyclin‐D2 and D3, were up‐regulated by exogenously applied sugar (De Veylder et al., 1999; Riou‐Khamlichi et al., 2000). Thus, sugar concentrations in tuber meristematic regions provide a potential mechanistic link between plant photosynthate status and the effects of elevated CO2 and shade on tuber cell proliferation.
Sugar concentrations in the cambial zone and sugar signalling
Plant development responds to photosynthate (sugar) status via signal transduction systems (reviewed by Roitsch, 1999; Sheen et al., 1999; Farrar et al., 2000). We provide evidence that glucose concentration in the cambial zones is a potential signal involved in modulating tuber cell proliferation in response to plant photosynthate status. Elevated CO2 increased the glucose concentration at both stages of tuber development, while sucrose concentration and enzyme activities other than that of invertase were unaffected (Fig. 6). Conversely, shade treatment decreased glucose in cambial zones at both TI and TB stages. Shade only affected sucrose at the TB stage, perhaps due to the high sugar demand for starch synthesis.
Invertase
In developing seeds, high rates of cell division are found in those regions with high glucose concentrations (Borisjuk et al., 1998), which are controlled by the activity of seed coat invertase (Weber et al., 1996). Invertase may also play a role in potato tubers. Some invertase genes are specifically expressed in phloem tissue (Hedley et al., 2000), and serial sectioning revealed that amounts of soluble invertase in tubers are greatest in the sub‐apical zone and decrease in tissues that have advanced to the starch‐accumulation stage of development (Viola et al. 2001).
Elevated CO2 increased soluble and CWB invertase activity in cambial zones of tubers at the TI stage (Fig. 7). Conversely, shade decreased invertase activity at both TI and TB stages. It is possible that such changes in invertase activity occurred in response to corresponding changes in tissue glucose concentration. In maize, expression of the invertase Ivr2 is enhanced in many importing sink organs by abundant sugar supply (Xu et al., 1996). In addition to soluble invertase, Cheng and Chourey (1999) showed that a CWB invertase, INCW1, is induced by metabolizable sugars, with regulation of both transcription and post‐transcription. Such sugar‐responsive expression may be involved in amplifying the strength of a signal created by a hexose‐sensing system. Regulation by sugar may also interact with other factors. For example, the optimal sugar concentration for Ivr2 expression is reduced when tissue is treated with exogenous cytokinin (Koch et al., 2000), meaning its greatest impact is on regions where cells are proliferating.
In summary, at both growth stages accumulation of tuber dry mass responded to elevated CO2 and shade in accord with their effects on net carbon assimilation by the plant. Assessment of changes in cell numbers and cell volume indicated that a considerable proportion of treatment effects on tuber growth could be attributed to changes in cell proliferation, whereas changes in average cell volume were limited and sometimes in a direction counter to the overall growth response. We provide evidence that glucose concentration in the cambial zones is a potential signal involved in modulating tuber cell proliferation in response to plant photosynthate status. Glucose concentration in the cambial zones was increased by elevated CO2 and decreased by shade at both stages of tuber development. Soluble invertase activity in the cambial zones also responded to the treatments, suggesting a possible role in amplifying the extent of hexose accumulation in cambial zones when photosynthate supply is relatively abundant.
ACKNOWLEDGEMENTS
This project was supported by a grant from the Agricultural Ecosystems Programme at Cornell University, with funding from the United States Department of Agriculture.
Supplementary Material
Received: 27 June 2002; Returned for revision: 12 September 2002; Accepted: 15 November 2002 Published electronically: 8 January 2003
References
- BorisjukL, Walenta S, Weber H, Mueller‐Klieser W, Wobus U.1998. High‐resolution histographical mapping of glucose concentrations in developing cotyledons of Vicia faba in relation to mitotic activity and storage processes: glucose as a possible developmental trigger. Plant Journal 15: 583–591. [Google Scholar]
- BowesG.1993. Facing the inevitable: plants and increasing atmospheric CO2 Annual Review of Plant Physiology and Plant Molecular Biology 44: 309–332. [Google Scholar]
- CairnsAJ.1987. Colorimetric microtiter plate assay of glucose and fructose by enzyme‐linked formazan production applicability to the measurement of fructosyltransferase activity in higher plants. Analytical Biochemistry 167: 270–278. [DOI] [PubMed] [Google Scholar]
- ChengWH, Chourey PS.1999. Genetic evidence that invertase‐mediated release of hexoses is critical for appropriate carbon partitioning and normal seed development in maize. Theoretical and Applied Genetics 98: 485–495. [Google Scholar]
- CournacL, Dimon B, Carrier P, Lohou A, Chagvardieff P.1991. Growth and photosynthetic characteristics of Solanum tuberosum plantlets cultivated in‐vitro in different conditions of aeration sucrose supply and carbon dioxide enrichment. Plant Physiology 97: 112–117. [DOI] [PMC free article] [PubMed] [Google Scholar]
- De VeylderLD, Engler JDA, Burssens S, Manevski A, Lescure B, Van Montagu M, Engler G, Inzé.1999. A new D‐type cyclin of Arabidopsis thaliana expressed during lateral root primordia formation. Planta 208: 453–462. [DOI] [PubMed] [Google Scholar]
- DoddsHJ, Silva‐Rodriguez D, Tovap P.1992. Micropropagation of potato (Solanum tuberosum L.). In: Bajaj YP, ed. Biotechnology in agriculture and forestry, vol. 19 Berlin, Heidelberg: Spring‐Verlag, 91–106 [Google Scholar]
- FarrarJ, Pollock C, Gallagher J.2000. Sucrose and the integration of metabolism in vascular plants. Plant Science 154: 1–11. [DOI] [PubMed] [Google Scholar]
- FonsecaF, Den HJ, Stulen I.1996. The response of Plantago major ssp. pleiosperma to elevated CO2 is modulated by the formation of secondary shoots. New Phytologist 133: 627–635. [Google Scholar]
- FujiwaraK, Kira S, Kozai T.1992. Time course of carbon dioxide exchange of potato cultures in‐vitro with different sucrose concentrations in the culture medium. Journal of Agricultural Meteorology 48: 49–56. [Google Scholar]
- HedleyPE, Maddison AL, Davidson D, Machray GC.2000. Differential expression of invertase genes in internal and external phloem tissues of potato (Solanum tuberosum L.). Journal of Experimental Botany 51: 817–821. [PubMed] [Google Scholar]
- KochKE, Zeng Y, Wu Y, Avigne WT.2000. Multiple paths of sugar‐sensing and a sugar/oxygen overlap for genes of sucrose and ethanol metabolism. Journal of Experimental Botany 47: 1179–1185. [DOI] [PubMed] [Google Scholar]
- LarkinsBA, Dilkes BP, Dante RA, Coelho CM, Woo Y‐M, Liu Y.2001. Investigating the hows and whys of DNA endoreduplication. Journal of Experimental Botany 52: 183–192. [PubMed] [Google Scholar]
- LiuJ, Xie C.2001. Correlation of cell division and cell expansion to potato microtuber growth in vitro Plant Cell, Tissue and Organ Culture 67: 159–164. [Google Scholar]
- MasleJ.2000. The effects of elevated CO2 concentrations on cell division rates, growth patterns, and blade anatomy in young wheat plants are modulated by factors related to leaf position, vernalization, and genotype. Plant Physiology 122: 1399–1415. [DOI] [PMC free article] [PubMed] [Google Scholar]
- PaulMJ, Foyer CH.2001. Sink regulation of photosynthesis. Journal of Experimental Botany 52: 1383–1400. [DOI] [PubMed] [Google Scholar]
- RanuluKS, Dijkhuis P.1986. Flow cytometric analysis of polysomaty and in vitro genetic instability in potato. Plant Cell Reports 3: 234–237 [DOI] [PubMed] [Google Scholar]
- Riou‐Khamlichi , Menges M, Healey JMS, Murray JAH.2000. Sugar control of the plant cell cycle: differential regulation of Arabidopsis D‐type cyclin gene expression. Molecular and Cellular Biology 20: 4513–4521. [DOI] [PMC free article] [PubMed] [Google Scholar]
- RoitschT.1999. Source‐sink regulation by sugar and stress. Current Opinion in Plant Biology 2: 198–206. [DOI] [PubMed] [Google Scholar]
- SalePJM.1976. Effect of shading at different times on the growth and yield of the potato. Australian Journal of Agricultural Research 27: 557–566. [Google Scholar]
- SattelmacherB, Laidig R.1991. Interrelation between growth rate of individual potato (Solanum tuberosum L.) tubers and their cell number. Annals of Botany 68: 41–45. [Google Scholar]
- ScheideggerUC, Nosberger J.1984. Influence of carbon dioxide concentration on growth carbohydrate content translocation and photosynthesis of white clover (Trifolium repens) Annals of Botany 54: 735–742. [Google Scholar]
- SetterTL, Flannigan BA.2001. Water deficit inhibits cell division and expression of transcripts involved in cell proliferation and endoreduplication in maize endosperm. Journal of Experimental Botany 52: 1401–1408. [DOI] [PubMed] [Google Scholar]
- SheenJ, Zhou L, Jang J‐C.1999. Sugars as signaling molecules. Current Opinion in Plant Biology 2: 410–418. [DOI] [PubMed] [Google Scholar]
- SimkoI.1994. Sucrose application causes hormonal changes associated with potato tuber induction. Journal of Plant Growth Regulation 13: 73–77. [Google Scholar]
- StittM.1991. Rising carbon dioxide levels and their potential significance for carbon flow in photosynthetic cells. Plant Cell and Environment 14: 741–762. [Google Scholar]
- TardieuF.1999. Research review. Modelling leaf expansion in a fluctuating environment: are changes in specific leaf area a consequence of changes in expansion rate? New Phytologist 143: 33–43. [Google Scholar]
- ViolaR, Roberts AG, Haupt S, Gazzani S, Hancock RD, Marmiroli N, Machray GC, Oparka KJ.2001. Tuberization in potato involves a switch from apoplastic to symplastic phloem unloading. Plant Cell 13: 385–398. [DOI] [PMC free article] [PubMed] [Google Scholar]
- VreugdenhilD, Boogaard Y, Visser RGF, De Bruijn SM.1998. Comparison of tuber and shoot formation from in vitro cultured potato explants. Plant, Cell, Tissue and Organ Culture 53: 197–204. [Google Scholar]
- WeberH, Borisjuk L, Wobus U.1996. Controlling seed development and seed size in Vicia faba: a role for seed coat‐associated invertases and carbohydrate state. Plant Journal 10: 823–834. [Google Scholar]
- WheelerRM, Tibbitts TW, Fitzpatrick AH.1991. Carbon dioxide effects on potato growth under different photoperiods and irradiance. Crop Science 31: 1209–1213. [DOI] [PubMed] [Google Scholar]
- WoodwardFI.2002. Potential impacts of global elevated CO2 concentrations on plants. Current Opinion in Plant Biology 5: 207–211. [DOI] [PubMed] [Google Scholar]
- XuJ, Avigne WT, McCarty DR, Koch KE.1996. A similar dichotomy of sugar modulation and developmental expression affects both paths of sucrose metabolism: Evidence from a maize invertase gene family. Plant Cell 8: 1209–1220. [DOI] [PMC free article] [PubMed] [Google Scholar]
- XuX, Lammeren AM, Vermeer E, Vreugdenhil D.1998. The role of gibberellin, abscisic acid, and sucrose in the regulation of potato tuber formation in vitro. Plant Physiology 117: 575–584. [DOI] [PMC free article] [PubMed] [Google Scholar]
Associated Data
This section collects any data citations, data availability statements, or supplementary materials included in this article.


