Abstract
Background
The peripheral olfactory sensory system arises from morphologically identifiable structures called placodes. Placodes are relatively late developing structures, evident only well after the initiation of somitogenesis. Placodes are generally described as being induced from the ectoderm suggesting that their development is separate from the coordinated cell movements generating the central nervous system.
Results
With the advent of modern techniques it is possible to follow the development of the neurectoderm giving rise to the anterior neural tube, including the olfactory placodes. The cell movements giving rise to the optic cup are coordinated with those generating the olfactory placodes and adjacent telencephalon. The formation of the basal lamina separating the placode from the neural tube is coincident with the anterior migration of cranial neural crest.
Conclusions
Olfactory placodes are transient morphological structures arising from a continuous sheet of neurectoderm that gives rise to the peripheral and central nervous system. This field of cells is specified at the end of gastrulation and not secondarily induced from ectoderm. The separation of olfactory placodes and telencephalon occurs through complex cell movements within the developing neural plate similar to that observed for the developing optic cup.
Keywords: neural crest, olfactory bulb, olfactory placode, dlx3, sox10, emx1, time-lapse
Introduction
The peripheral nervous system arises from sensory, or cranial, placodes and neural crest cells. Sensory placodes have been reported to generate a variety of structures including sensory neurons, secretory neurons, glia, and crystalline containing cells (for review see: Schlosser, 2006), although a placodal origin for neurosecretory cells and glia is open to debate (Whitlock and Westerfield, 2000; Whitlock et al., 2005; Forni et al., 2011; Onuma et al., 2011). The current model is that sensory placodes are induced from the ectoderm after the formation of the neurectoderm giving rise to the neural tube. Specific genes expressed in an arc along the anterior border of the neural plate (Eya1, Six1, Six4) maintain their expression in the morphologically visible placodes leading to the suggestion of a common placodal primordium (Schlosser and Ahrens, 2004). Analysis of another gene expressed in this domain, dlx3, shows that the pre-placode domain in the anterior border of the neural plate aligns with the pre-migratory cranial neural crest (CNC) cells expressing foxd3, (Whitlock and Westerfield, 2000). Thus both premigratory CNC and placodes lie in the edge of the lateral neural plate. Fate maps of the border of the neural plate and neighboring cells (medial) support the border of the neurectoderm as the origin of the peripheral nervous system (PNS) (Kozlowski et al., 1997; Pieper et al., 2011) where specific analysis of the olfactory placode (OP) derivatives has shown that olfactory bulb fate maps to progenitors lying adjacent to the progenitors of the OPs (Whitlock and Westerfield, 2000). Furthermore, when observing the pre-migratory olfactory and telencephalic domains in vivo there is no apparent morphological division. Thus the OPs and telencephalon, which is the site of the post-synaptic targets in the central nervous system, may develop simultaneously from the neural plate.
With the exception of the visual system, the morphogenetic movements giving rise to the placodal structures of the PNS are not well understood. In order to dissect the development of the pre-placode domain, the cell movements at the end of gastrulation, as the neurectoderm goes through morphogenesis to form the neural tube and associated PNS, need to be examined. In the last decade it has become accepted that the neural plate is patterned by morphogens that confer specific fates along the AP and DV axes (see for review (Cavodeassi and Houart, 2012). Initially a primary signaling center is established at the future midbrain hindbrain boundary during midgastrula stage, evident through the expression of gbx and otx genes in the neurectoderm (Raible and Brand, 2004). In the same development time frame a second signaling center is established, the anterior neural border, which patterns the anterior neural plate. It is the border of the anterior neural plate that will generate the peripheral olfactory sensory system.
With the exception of the lens of the eye, all placodes generate neurons and are part of the nervous system. If the peripheral nervous system (excluding lens of the eye) was induced from ectoderm by the neural plate, as opposed to being patterned simultaneously within the neural plate, the mechanics of matching peripheral neurons with their central targets would be difficult: it would be more parsimonious if form and function worked together. Furthermore in animals studied as ancestral representatives to modern day chordates, such as Amphioxus (Cephalochordate) there are clearly sensory structures, yet they do not have observable sensory placodes (Holland and Holland, 2001; Holland, 2009) or neural crest cells. Thus placodes may represent a morphological characteristic related to the generation of the neural crest derived cranium (Gans and Northcutt, 1983) but the fundamental neural component is the neural plate that will give rise simultaneously to both peripheral and central nervous system
Because of their obvious structural characteristics, placodes are amenable to experiments, but they are a very late characteristic of PNS development; at the time the OP is apparent neurons are differentiating. Here we examine the hypothesis that the central and peripheral olfactory system are more like the eye: an elaboration of the neural plate/neural tube that has maintained a continuous connection between peripheral and central nervous system during early development. To examine this we have concentrated on similarities between the peripheral olfactory sensory system and its central target, the telencephalon that contains the olfactory bulb. Initially dlx3 was described as being expressed in the border of the neural plate (Akimenko et al., 1994) and subsequently shown to be expressed at low levels in the anterior neural plate (Whitlock and Westerfield, 2000; Solomon and Fritz, 2002). We confirm that the border of the neural plate is immuno-positive for Dlx3b as is the medial region albeit at lower levels, and that this field of cells initially appears to be continuous, lacking an obvious basal lamina. Furthermore the neural field becomes polarized as precursor cells of the peripheral and central olfactory sensory system move together during early somitogenesis. Early in this migration cells moved between the fields giving rise to the peripheral versus central olfactory sensory system. Thus our data support a model of a single olfactory field that becomes progressively restricted in cell movements as it is subdivided in to the peripheral and central olfactory system.
Results
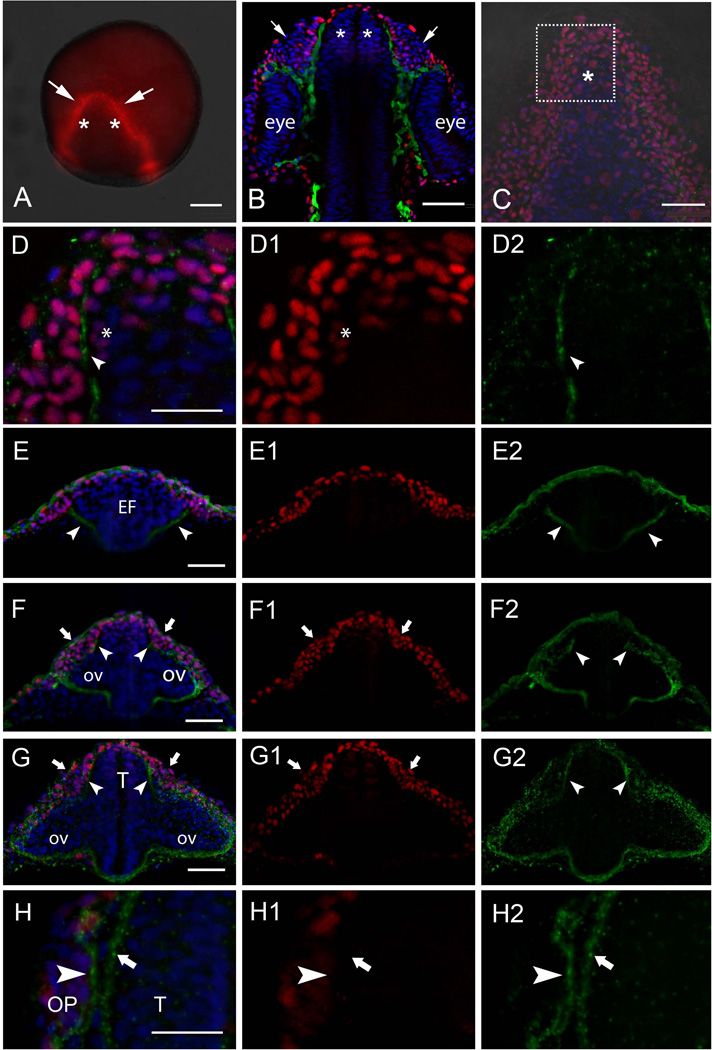
Neurectoderm is specified early in development at the onset of gastrulation, forming a continuous neural sheet that is delineated by signaling centers initiated during gastrulation. We used the antibody recognizing Dlx3b in zebrafish (Fig. 1A–C, D, D1, E, E1, F, F1, G, G1, H, H1, red) to identify the border of the anterior neural plate (Fig. 1A, red, arrows) including the precursors of the telencephalon (Fig. 1A, red, asterisks). The nuclei recognized by the anti-Dlx3b antibody had the strongest expression at the anterior border of the neural plate (Fig. 1A, arrows) at 2 somite stage (ss). Cells expressing Dlx3b strongly will give rise to the olfactory organs (Fig. 1B, arrows), which at this late developmental stage appear as morphologically distinct placodes (Fig. 1B, arrows). The cells lying more medial (Fig.1A, asterisks) that express low levels of Dlx3b (see below) will give rise to the telencephalon/olfactory bulbs (Fig. 1B, asterisks).
Figure 1.
The Dlx3b protein is expressed in the developing olfactory sensory system. A) The Dlx3b protein (red) is highly expressed in the anterior border of the neural plate at 2ss in region giving rise to the OP (arrows) and adjacent medial cells (asterisks) will contribute to the telencephalon. B) At 24 hpf the OPs are evident (arrows) adjacent to the telencephalon (asterisks). Cells in green are Sox10:GFP positive neural crest cells separating the OPs from the telencephalon. (C, D, D1–2) Wholemount embryos, dorsal view, anterior toward top of page. Dlx3b protein 2ss in the anterior neural plate where region of interest (C, boxed area) shows Dlx3b positive nuclei in the border of the neural plate (D, D1, red) with the initiation of laminin immunoreactivity (D, D2, green, arrow). E) At 2ss laminin signal is observed in the ventral border of the eye field (E, E2, green, arrowheads). The dorsal olfactory field (E, E1, red) is not divided by laminin expression at this stage. F) At 8ss the laminin signal extends dorsally (F, F2, arrowheads) reaching the telencephalic and OP fields (F, F1, red, arrows). G) At 14ss laminin immunoreactivity (G, G2, arrowheads) separates telencephalic and OP fields (G, G1, arrows). H) At 20ss laminin immunoreactivity is much stronger (H, H2) and is localized to the region of the basal lamina of the OP (H, H2, arrowhead) and telencephalon (H, H2, arrows). All images are wholemount embryos. A–D, H are dorsal views; E–G, are frontal views. EF, Eye Field; ov, Optic vesicle, OP, Olfactory placode; T, Telencephalon. Scale bars: A, 100 µm; B, C, 50 µm; D = 25 µm; E, F, G, 50 µm; H= 25 µm.
Development of the basal lamina in the olfactory sensory system
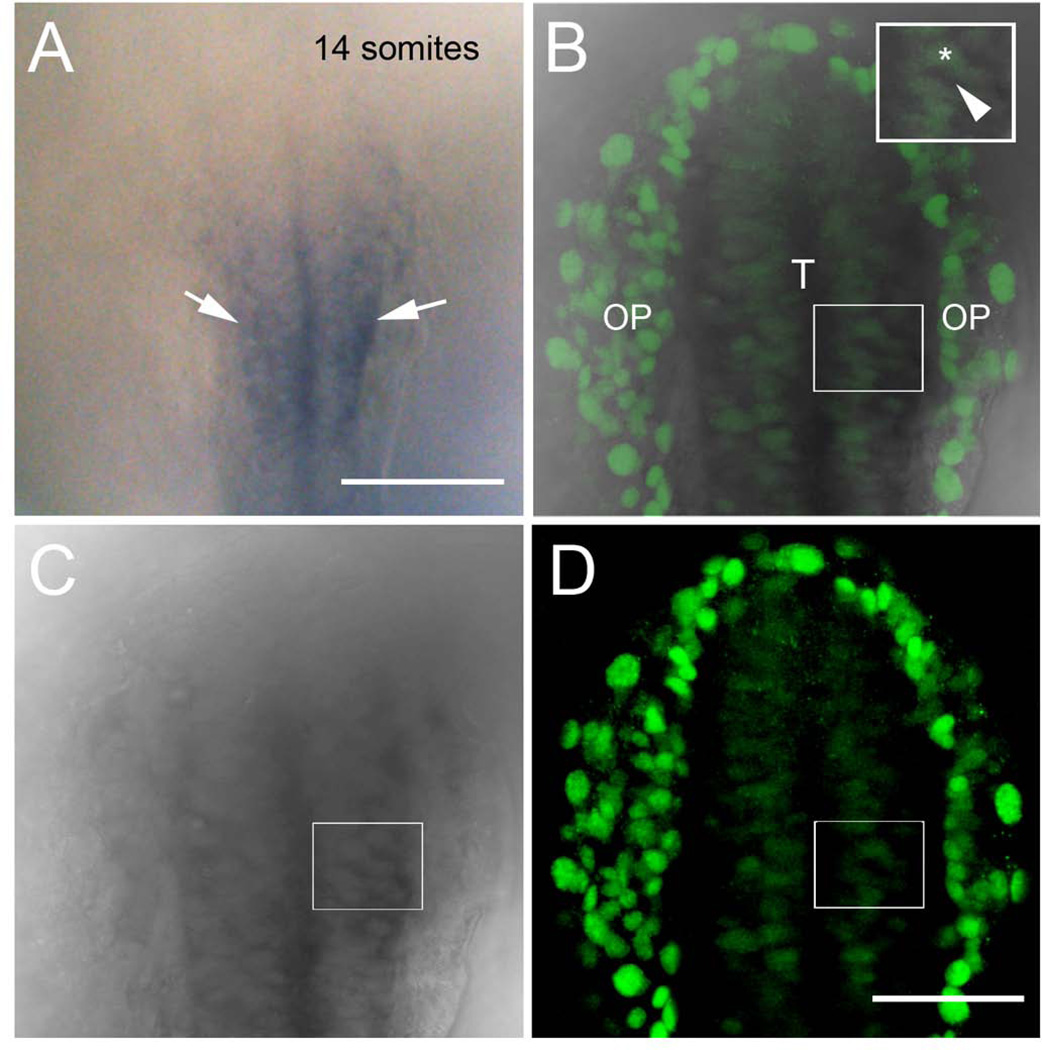
In order to analyze the formation of the basal lamina relative to the morphological division of the peripheral and central olfactory sensory system, we used an anti-laminin antibody (Fig. 1C, D, D2, E, E2, F, F2, G, G2, H, H2, green). Analysis of z-stack images of 30 µm revealed strong immunoreactivity of Dlx3b at the border of the neural plate (Fig. 1C, red, boxed) and less intense immunoreactivity located more medially (Fig. 1C, red, asterisk). Analysis of an optical section of 3 µm reveals punctate discontinuous laminin immunoreactivity (Fig. 1D, D2, green, arrow) apparent at 2ss in the anterior neural plate (Fig. 1D, D1, red) most likely corresponding to the lateral border of the eye field. Subsequent analysis of frontal optical sections at 2ss (Fig. 1E, E1–2), 8ss (Fig. 1F, F1–2), 14ss (Fig.1 G, G1–2) revealed that at 2ss the laminin immunoreactivity is localized around the eye field (Fig. 1E, “EF”) extending dorsally (Fig. 1E, E2, arrows), but the Dlx3b positive olfactory field (Fig. 1 E, E1, red) has not yet separated into distinct peripheral and central fields. At 8ss (Fig. 1F, F1–2), the separation of the future OPs (Fig. 1F, red, arrows) has been initiated as evidenced by laminin immunoreactivity extending dorsally around the future OPs (Fig.1F, F2, green, arrowheads). At 14ss the laminin immunoreactivity (Fig. 1G, G2 green, arrowheads) has separated the Dlx3b positive cells destined the OPs (Fig. 1G, G1, red, arrows) from those that would contribute to the telencephalon/olfactory bulbs (weakly immunoreactive: see Fig. 2 below). At 20ss the placodes were morphologically identifiable in a projection of z-stack images of 30 µm (Fig. 1B, arrows). Concomitant with the morphological appearance of the OP, the laminin labeling was much more intense (Fig. 1H, H2, green) and it was possible to differentiate the laminin labeling associated with the OP (Fig. 1H, H2, green, arrowhead) and telencephalon (Fig. 1H, H2, green, arrow). The region lying medially to the strong Dlx3b expression also expresses Dlx3b but at lower levels. This region (Fig. 2A) expresses emx1, a telencephalic marker (Morita et al., 1995), and double labeling with the antibody recognizing Dlx3b (Fig. 2B, D, green) and in situ hybridization for emx1 Fig. 2, B, C, dark grey) demonstrates that cells expressing low levels of Dlx3b in their nuclei (Fig. 2B, inset asterisk) also express emx1 in the cytoplasm (Fig. 2B, inset dark grey, arrow). Thus at early somitogenesis, 8ss, laminin labeling suggested that a single basal lamina initiated the separation of the PNS and the CNS and coincident with the appearance of the OP at 20ss, laminin accumulated in basal lamina of both the neural tube and OP.
Figure 2.
Expression of emx1 co-localizes with Dlx3b in the developing telencephalon. A) Transmitted light image of wholemount embryo processed for emx1 expression marking the telencephalon (arrowheads). B–D) Different preparation of 14ss wholemount embryo with Dlx3b immunodetection (B, D green) after in situ hybridization for emx1 (B,C, dark gray). Merged image of 3 µm focal plane (B) colocalizes Dlx3b signal (green) with transmitted light image of emx1 in situ (grey). Inset box in B shows higher magification of cells expressing Dlx3b (asterisk) and emx1 (arrowhead). All embryos are dorsal views with anterior toward top of page. OP, olfactory placodes; T, telencephalon. Scale bars: A, 100 µm; B–D, 50 µm.
Cell movements during early somitogenesis
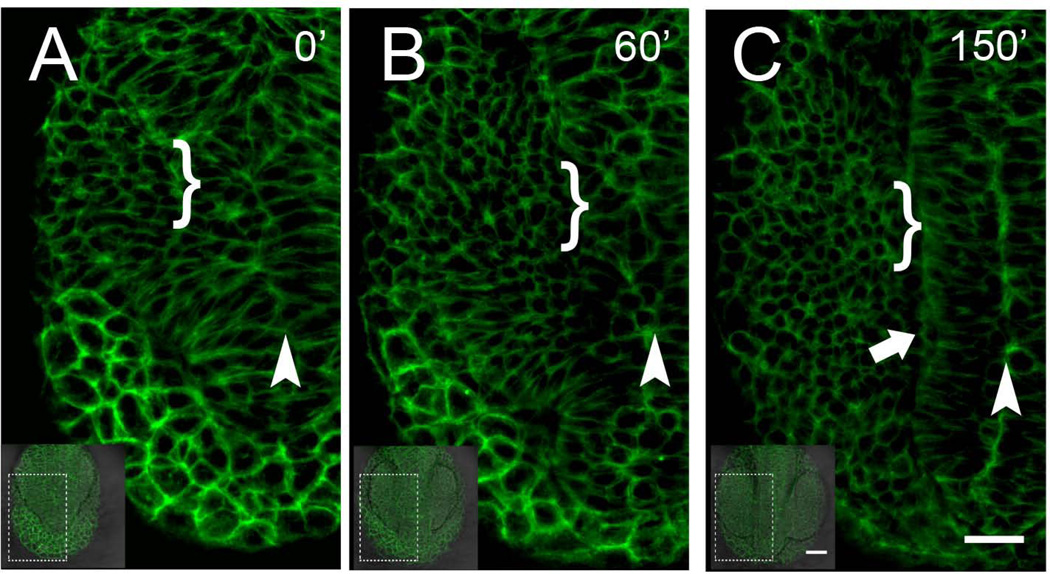
To better understand the morphogenetic cell movements during early development that lead to the separation of the periphery from their central targets, i.e. the appearance of the OPs, we used the β-actin:GAP43-GFP line to follow cell dynamics starting at 4ss (Fig. 3A, t=0). In still images from a representative movie (Supplemental Movie 1) it was not possible initially to discern the lateral border of the forming neural tube yet the midline (future lumen) was possible to identify (Fig. 3, arrowheads). As development continues the midline of the neural tube became more defined (Fig. 3 A–C, arrowheads) and at ~9ss the lateral border of the neural tube was clearly defined (Fig. 3C, arrow). During this period, cells lying laterally change their morphology becoming more rounded (Fig. 3A–C, brackets). These cells will remain dorsal as optic cup/stalk morphogenesis proceeds with antero-lateral cell movements. At 9–10ss (Fig. 3C) the field of cells that will generate the OP lie lateral to the neural tube, embraced ventrally by the forming eye. In analyzing the movies (n=4), at no time were the cells destined to form the peripheral nervous system absent or disconnected from the cells forming the central nervous system.
Figure 3.
Analysis of early cell movements reveals a continuous field of B-actin:Gap43-GFP expressing cells. A–C) initially, at 4ss, it is possible to identify the region of the forming neural tube lumen (A, arrowhead) but not the lateral neural tube which becomes well defined by 6–7ss (C, arrowhead). The region of the pollster (anterior prechordal plate) initially (A, B) showed the most intense Bactin:GFP expression, A,B) The OP precursors lie very dorsal and by 9–10ss (C) become very round in shape (brackets). Dorsal view, anterior toward bottom of page. Scale Bars: insets= 50µm; A–C=25µm. (see Supplemental Movie 1)
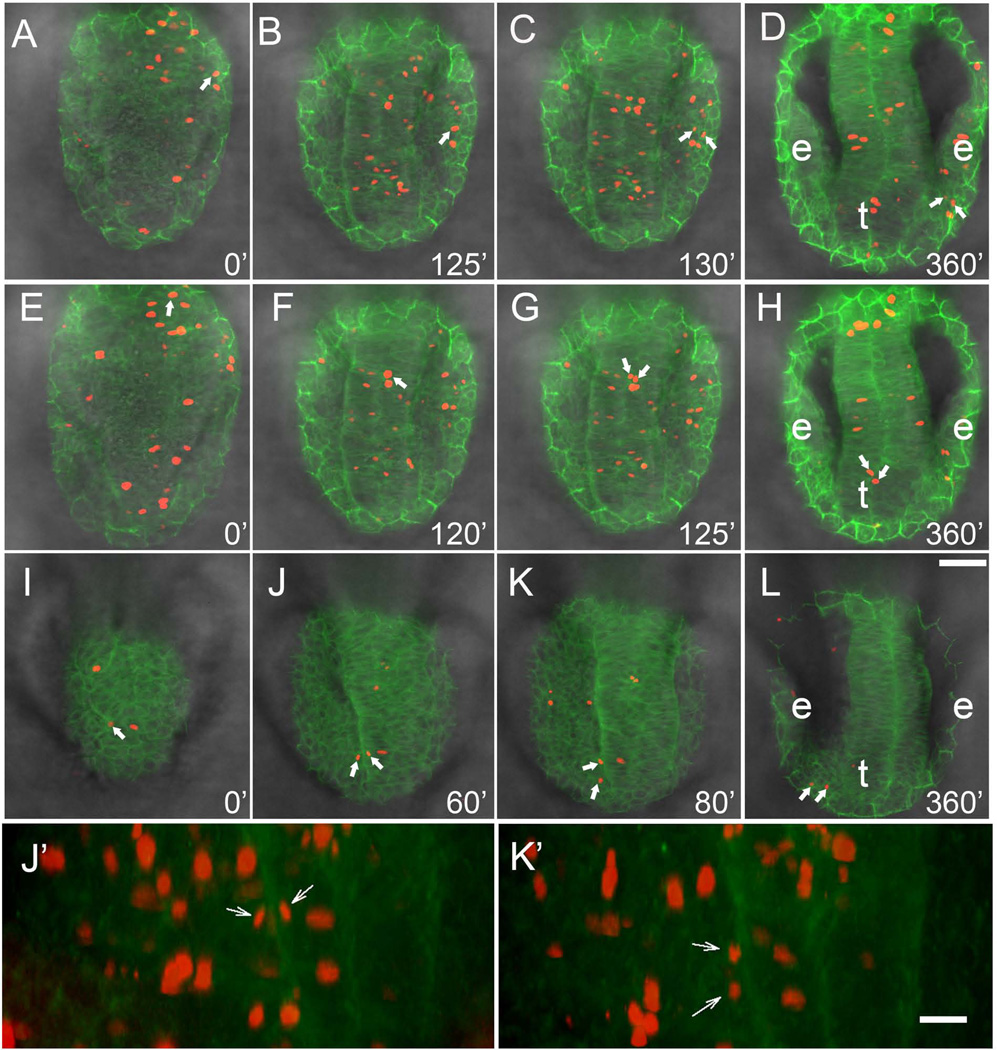
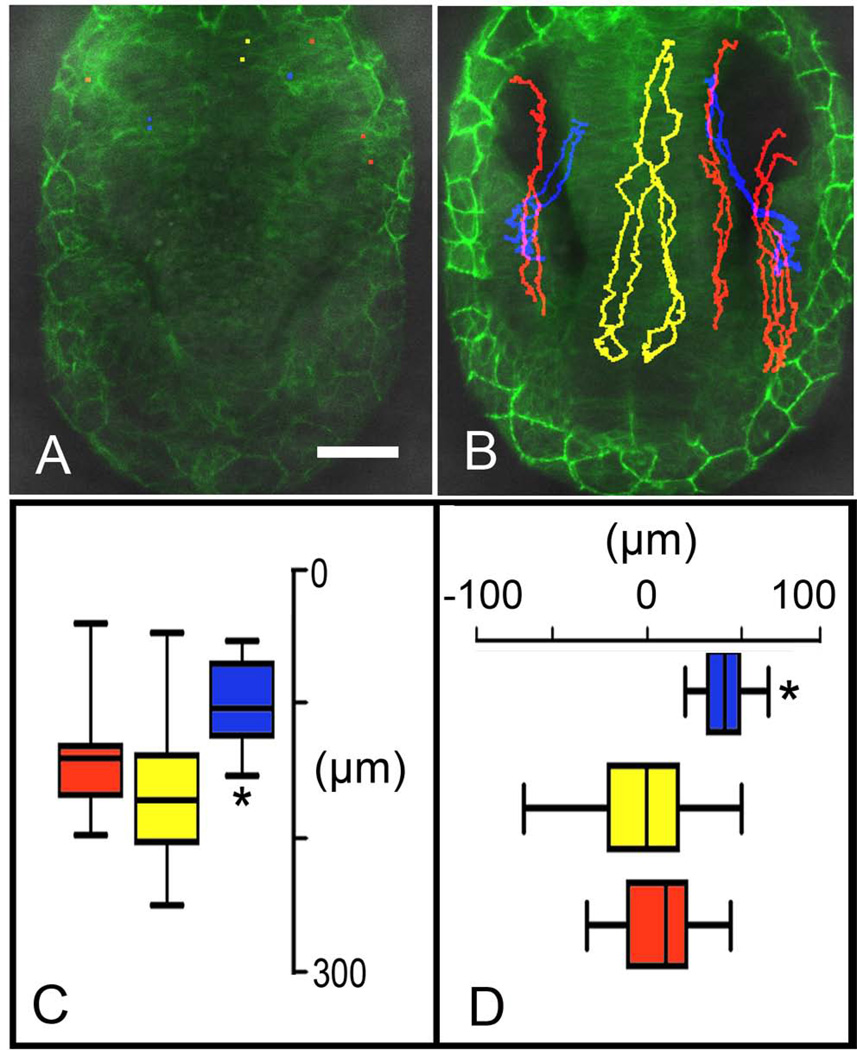
In order to follow individual groups of cells during the morphogenetic movements in developing embryos we used the same line, β-actin:GAP43-GFP, and injected H2B:RFP construct to generate random clones of cells expressing RFP. Wholemount embryos were imaged, capturing the dorsal most aspect (50–75µm stack) of the anterior neural tube initiated at 4–5ss. From these stacks 6µm slices were selected to follow identified cells through time (Fig. 4A–L). These clones of cells showed distinct patterns of movement during early somitogenesis, which were analyzed relative to their final destination: OP, telencephalon and eye. We observed that cells giving rise to the olfactory sensory system fell into three categories: those that stayed lateral (Fig. 4A–D, red, arrows; Supplemental Movie 2) and contributed to the OP, those that stayed medial (Fig. 4E–H, red, arrows; Supplemental Movie 3) and contributed to the telencephalon, and those that started centrally, then moved into the OP (Fig. 4I–L, red, arrows; Supplemental Movie 4). The most surprising result, and one which further supports an olfactory sensory field as opposed to two developmentally distinct tissues, is the movie (Fig. 4I–L) showing a single cell within the developing neural tube (Fig. 4I, arrow) that divides and one cell moves to the periphery (Fig. 4 J, J’, arrows) followed by its pair (Fig. 4K, K’, arrows) eventually contributing to the OP (Fig. 4L, arrows). To understand the net movement of cells, multiple cells were tracked in a single preparation starting at 4–5ss. The starting point of cells was marked (Fig. 5A) and color-coded according to positional identity deduced at the end of the movie (Fig. 5B; Supplemental Movie 5 and 6). Data were then combined for cells tracked in all movies (Fig. 5C,D; n=6; OP =21 cells, telencephalon=21 cells, eye=15 cells) and analyzed. The telencephalic precursors showed a net movement anterior (Fig. 5A–D, yellow), as did the OP precursors (Fig. 5A–D, red). The telencephalic precursors showed greater variability in their trajectories (Fig. 5C, D, yellow) often crossing the midline during early stages of the tracking. In contrast to cells contributing the olfactory sensory system, cells giving rise to the visual system (Fig. 5B, blue; Supplemental Movie 6) showed a net antero-lateral movement (Fig. 5C, D, blue) consistent with previous reports of optic cup morphogenesis (Ivanovitch et al., 2013). These data suggest that during early somitogenesis net movement for olfactory system precursors is anterior and cells can move within the olfactory field both across the midline and medial to lateral.
Figure 4.
Lineage analysis of cell movements of H2B:RFP positive clones in the β-actin:GAP43-GFP line. All in vivo tracking was initiated at 4ss. A–L) Image of 6µm slices taken from total z-stacks ranging from 50–75µm, dorsal view. J’, K’) Projections of 3D reconstructions from 50µm z-stacks, from preparations J and K, ventral view. A–D) Cells (red, arrows) contributing to the OP were tracked over the course of the movie (see Supplemental Movie 2). E–H) Cells (red, arrows) contributing to the telencephalon (t) were tracked over the course of the movie (see Supplemental Movie 3). I–L) Cells (red, arrows) originating medially but contributing to the OP are tracked over the course of the movie (see Supplemental Movie 4). Cells divide (J, J’, arrows) and both cells cross into the PNS (K, K’, arrows). Scale Bars: A–L = 50µm, J’, K’ = 20 µm.
Figure 5.
Cell migration of different H2B:RFP positive cells within one β-actin:GAP43-GFP embryo. A, B) Cells tracked in red become OP cells, yellow telencephalic cells (see Supplemental Movie 5). Cells shown tracked in blue contribute to visual system eyes (see Supplemental Movie 6). Anterior is toward bottom of page, dorsal views. C) Plot of anterior posterior movements (in µms) of cells tracked in A and B. D) Plot of lateral movements (in µms) of cells tracked in A and B. Scale Bar = 50µm. C, D: p=>0.005 for all values.
The anterior migration of cranial neural crest (CNC) initiates the morphological division of peripheral and central olfactory system
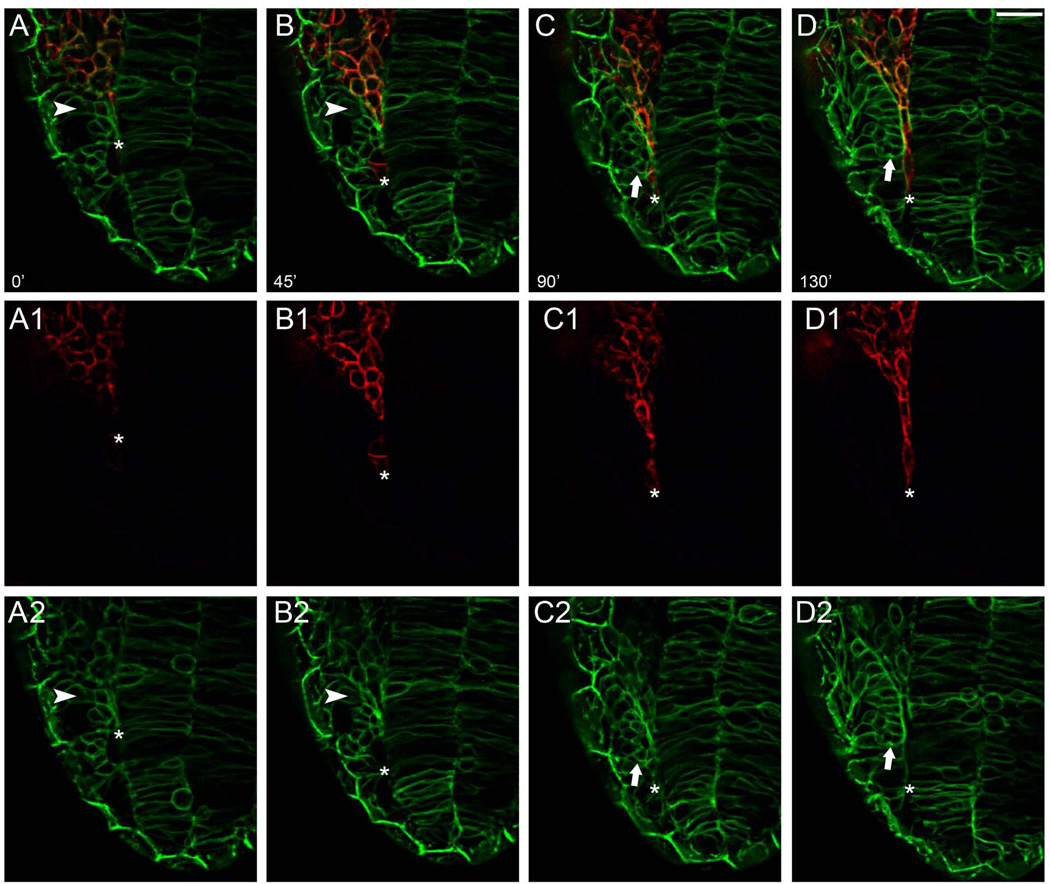
Previous studies clearly indicate that, during olfactory system development, the morphogenetic movements leading to the formation of the OPs coincide with the rostral most migration of the CNC (Harden et al., 2012; Boric et al., 2013). In order to better understand the morphological changes during this developmental period we used double transgenic embryos, β-actin:GAP43-GFP;sox10:RFP, to simultaneously visualize changes in general cell morphology (β-actin:GAP43-GFP positive cells, Fig. 6, green) associated with the migration of CNC (Sox10:RFP positive cells, Fig. 6, red). We recorded time-lapse movies (n=6) from 14–15ss to 19–20ss embryos; the developmental window (about 3 hours) leading to the stages when the OPs become morphologically visible. Frames were selected from a representative movie (Supplemental Movie 7). We observed that the olfactory precursors at 14ss showed mixed morphologies with some having the same morphology as observed earlier (Fig. 3) with very rounded cells, (Fig. 6A and B, arrowheads), resembling a mesenchymal state, although, the majority of the cells had lost the very rounded morphology observed earlier (Fig. 3). Progressively the cells became more compacted (Fig. 6C, D, arrows) and the cells acquired an epithelial organization as the OPs became evident (Fig. 6C and D). This transition coincided with the CNC migration (Fig. 6A–D, A1–D1, red, asterisks indicate advancing front of CNC), which morphologically separated peripheral olfactory sensory system from the developing neural tube. At no time did we observe the entry of the Sox10:RFP positive CNC cells into the developing OPs. This analysis in the β-actin-GAP43-GFP;sox10:RFP background demonstrated that the morphological condensation of the OPs and separation from the neural tube is coincident with the anterior migration of CNC.
Figure 6.
The anterior migration of cranial neural crest initiates the morphological division of peripheral and central olfactory system. Stills from movie using sox10:RFP;Bactin:Gap43-GFP embryos. A, B) Starting at 14ss cells that will form OP (green, arrowheads) lose their rounded appearance. CNC cells (red) advance anteriorly moving between the compacting OP and the neural tube. C, D) As the CNC cells move anteriorly the cells change shape (red, asterisk) appearing to squeeze between the forming NT and OP. Movies were initiated at 14ss and ended 3 hours later at 19–20ss (n=6). Dorsal view; anterior toward bottom of page. Scale Bar =25µm. (see Supplemental Movie 7).
Anterior migration of neural crest is accompanied by remodeling of basal lamina
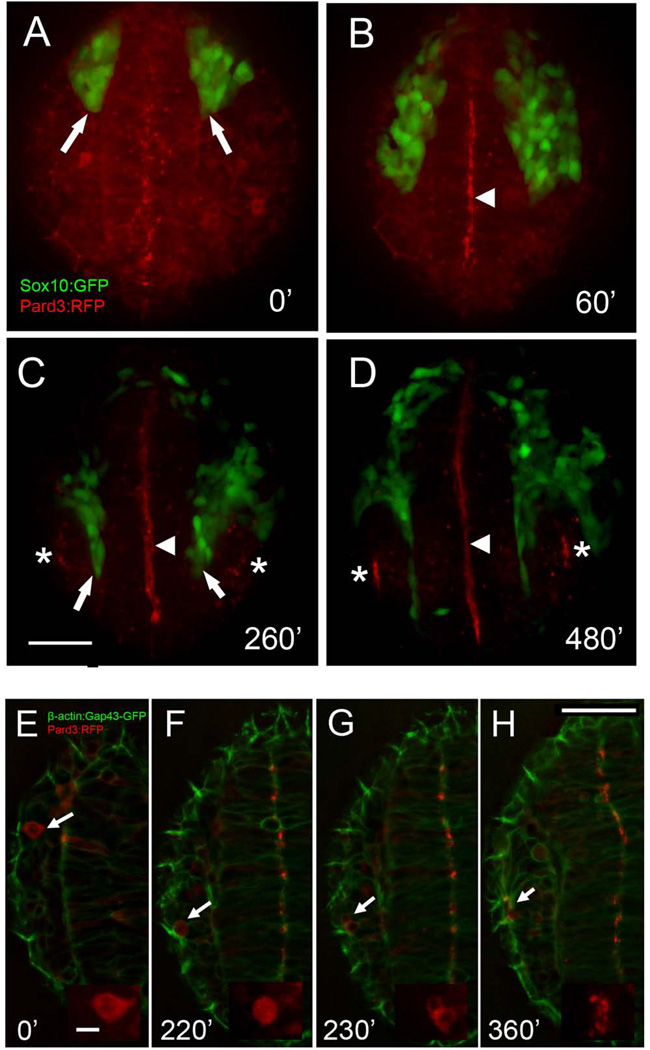
In order to understand when the olfactory field becomes polarized relative to CNC migration we examined the expression of ParD3, (Fig. 7A–D, red), part of an evolutionarily conserved protein complex that regulates establishment and maintenance of epithelial cell polarity (Wei et al., 2004; Tawk et al., 2007). At the 10ss ParD3:RFP could be see starting to accumulate in the lumen side of the forming neural tube (Fig. 7A, red). As CNC cells moved anteriorly this accumulation became more intense (Fig. 7B, arrowhead) and only at ~18ss (Fig. 7C) was it possible to discern accumulation of the ParD3:RFP at the apical side of the OPs (Fig. 7C, asterisks) with the accumulation becoming strong at ~ 24 hpf (Fig. 67, asterisks) similar to observations in the devloping visual system (Wei et al., 2004). We next examined clones of cells injected with the parD3:RFP construct by following them as single cells (Fig. 7E–H, arrows). An example of a lateral cell (OP), that divided (Fig. 7G) and then the ParD3:RFP becomes localized to the apical surface of the placode (Figure 7H).
Figure 7.
Cell polarization in the olfactory field occurs as CNC cells migrate anteriorly. A–D) Still images from movies of Pard3:RFP (red) injected into Sox10:GFP embryo; images are a projection of a 30um z-stack. E–H) Pard3:RFP (red) injected into β-actin:Gap43-GFP embryo; images are a projection of a 6um z-stack. At 10ss, before the anterior migration of the CNC (arrows, A) Pard3-RFP signal is homogeneously distributed in the forming neural tube. B) As CNC cells migrate Pard3:RFP (red) signal becomes localized in the lumen of the neural tube (arrowhead, B–D). C) As CNC cells separate OPs and neural tube (arrows) apical accumulation of the Pard3-RFP protein is observed OP where the nares will form (asterisks, C,D). E–H) Tracking of single Pard3:RFP cell (E–H, red, arrow), where initially Pard3-RFP is evenly distributed in the cell cytoplasm (inset E–F) before placode formation. At 16–17ss (F, inset) the cell will initiate mitosis and has divided 20’ later (G, inset). Two hours later cells are polarized with Pard3:RFP signal at the apical side of the cells (H, inset). All images are dorsal views, anterior toward bottom of page. Time is indicated in minutes after the beginning of the movies at 10ss (0’). Images are maximum intensity projection of 30µm (A–D) and 6µm (E–H). Scale bar in C,H=50µm, inset in E=10µm.
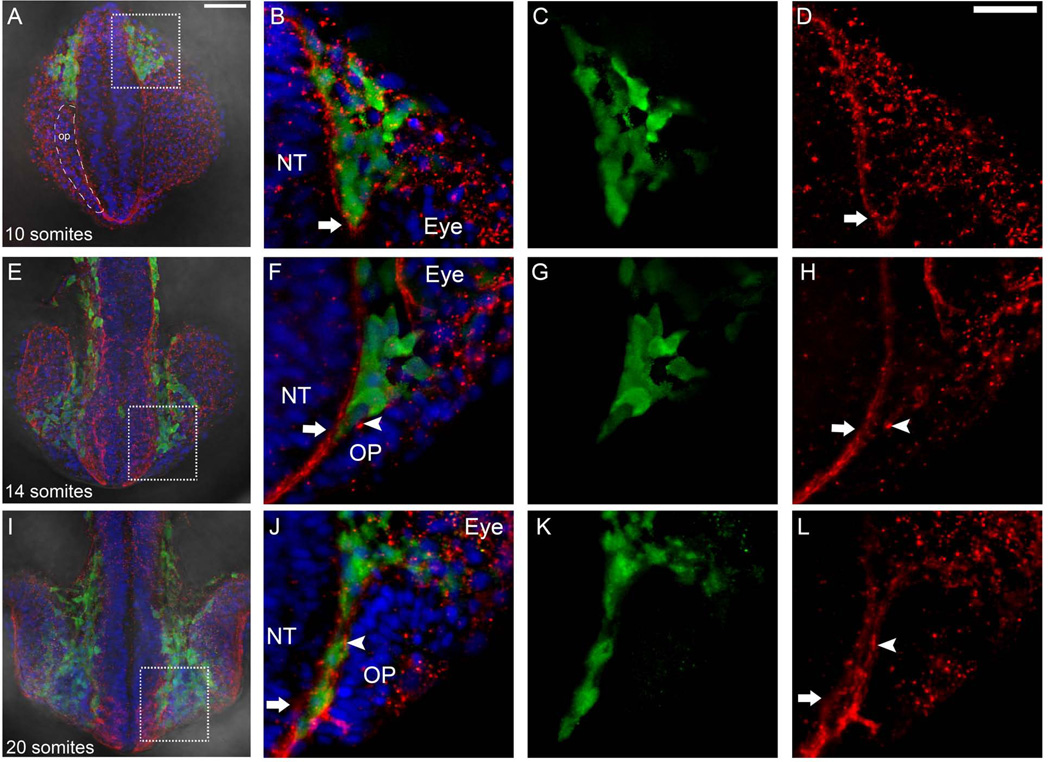
The anterior migration of the neural crest is intimately associated with the formation of the OPs (Harden et al., 2012; Fig. 6), which appear to develop by mesenchymal to epithelial transition. In order to analyze the relationship of these two processes we analyzed the distribution of laminin, a component of the basal lamina, during CNC migration. Using Sox10:GFP expressing animals we looked for changes in laminin immunoreactivity during CNC migration, which starts 6–8ss. At 10ss Sox10:GFP positive CNC cells initiated migration and were seen in the region between the posterior limit of the developing optic cup and the neural tube in a projected z-stack of 30 microns (Fig. 8A–C, green, boxed area). Laminin immunoreactivity was punctate and surrounded the advancing front of CNC (Fig. 8A,B D, red, arrow) and the laminin immunoreactivity that we observed starting at 8ss (Fig. 1F) continued to be apparent medial to the field that will form the OP (Fig. 8A, dashed outline, op). The CNC, which migrates anteriorly passing between the neural tube and developing eye, was observed adjacent to the region of the condensing OP (Fig. 8E, F, G, green) at 14ss. With the arrival of CNC in the region of the OP the basal lamina of the neural tube (Fig. 8H, red, arrow) and the OP (Fig. 8H, red, arrowhead) were discernible. As CNC cells populated the region between the neural tube and OP (Fig. 8I–K, green) the basal lamina of the neural tube (Fig. 8J, L, red, arrow) and the OP (Fig. 8H, L red, arrowhead) became more distinct. Thus, as the CNC cells moved anteriorly, dorsal to the developing eye, the basal lamina of the OP is formed, separating this tissue medially from the neural tube (Fig. 8B,F, J) and postero-laterally from the developing retina (Fig. 8B,F). These results suggest that CNC migration is correlated with changes in the pattern of laminin immunoreactivity where initially there is single border of laminin immunoreactivity separating the peripheral and central olfactory fields at 8ss (see Fig. 1F). CNC initiates migration at 6–8ss and the advancing front of CNC is associated with the separation of the basal laminae of the neural tube and OPs.
Figure 8.
Anterior migration of neural crest is accompanied by changes in the basal lamina. Wholemount heads in dorsal view at 10ss (A), 14ss (E), and 20ss (I). Boxed area show region of interest shown at higher magnification. A) Region of cells that will give rise to OP indicated by dashed outline (op). B–D) the leading edge of Sox10:GFP positive CNC (green) moves as a group surrounded by laminin (red, arrow). F–H) CNC (green) passes anterior separating the lamina of the neural tube (NT, red, arrow) and OP (red, arrowhead). J–L) CNC (green) is now flanked by laminin on both the side of the NT (red, arrow) and OP (red, arrowhead). Scale Bars: A, E, I=50µm; B–D, F–H, J–L =25µm.
Progenitors of neurectodermal border
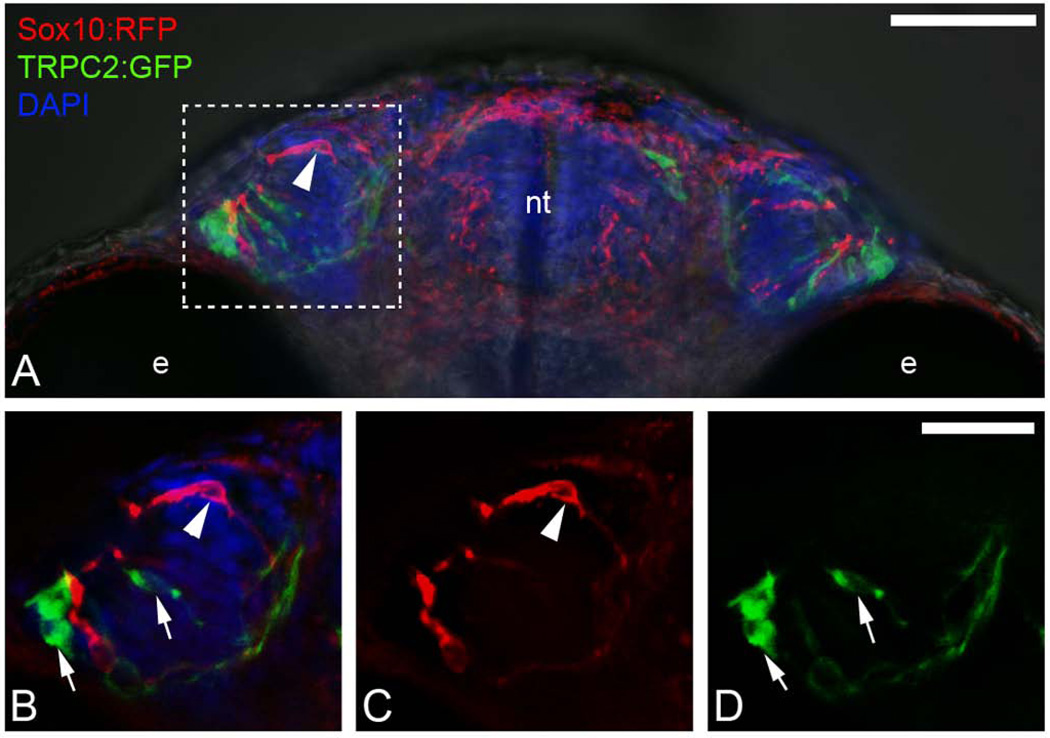
Because the anterior migration of CNC is associated with the development of the basal lamina as evidenced by the separation of a distinct neural tube and OP labeling, and previous reports suggested that a specific olfactory sensory neuron subtype, microvillar sensory neurons, arose from CNC (Saxena et al., 2013), we examined whether CNC markers (Sox10:RFP) co-localized with OP markers specifically microvillar sensory neurons (visualized using a TRPC2:GFP reporter line). Previously we have shown that there is little mixing of CNC with OP precursors during early development. Through crosses sox10:RFP;TRPC2:GFP embryos were generated to look for co-localization at the cellular level (Fig. 9). We analyzed animals at 55 hpf using spinning disc microscopy and in a projected z-stack of 30 microns found that, in spite of there being expression of Sox10:RFP in the OP (Fig. 9A, B, C, red, arrowheads), this signal did not co-localize with the TRC2:GFP cells (Fig. 9A,B,D green, arrows). We analyzed 20 preparations under low magnification and 5 preparations under high magnification and never observed microvillar sensory neurons positive for both Sox10:RFP and TRPC2:GFP. Thus we concluded that while the peripheral olfactory sensory precursors are developmentally coupled to their central targets in the telencephalon/olfactory bulb, they do not incorporate CNC lineages in the OPs. We have also observed expression of sox10 reporters in the OP (Harden et al., 2012), but the pattern differs dependent upon the reporter line (Whitlock and Torres-Paz, personal observation) and sox10 gene expression is never observed in the microvillar neurons of the OP at least by in situ hybridization (Whitlock et al., 2005; Harden et al., 2012). Thus the previous report of CNC derived lineages contributing to olfactory sensory neurons of the OPs is likely results from ectopic expression generated by insertional effects of the sox10 reporter lines.
Figure 9.
Sox10:RFP positive neural crest does not contribute to TRPC2:GFP positive microvillar neuronal populations within the olfactory sensory epithelium. A) wholemount head at 55 hpf viewed from ventral. Boxed area indicates region of interest shown in B–D. B) Expression of Sox10:RFP (red, arrowhead) and TRPC2:GFP (green, arrows) in the OP. B) TRPC2:GFP (arrows) in the olfactory organ. C) Expression of Sox10:RFP (arrowhead) in the olfactory organ. B–D) Images are 3 µm optical sections. Scale Bars: A=50µm; B–D =25µm.
Discussion
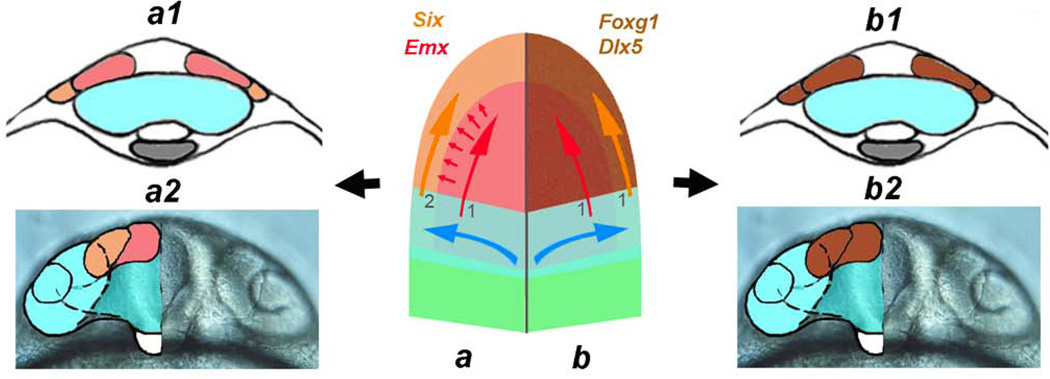
Here we have shown that the olfactory sensory system develops as a coordinated functional unit where the peripheral olfactory system develops with its target (Fig. 10, red, orange) from the 2ss, the time we could clearly identify cell fields. The cell movements contributing to the morphogenesis of the olfactory system (Fig. 10, blue) were observed in the same time window as the morphogenetic movements driving the formation of the optic cup (see for review: Cavodeassi, 2014). Initially, in β-actin:GAP43-GFP, there was no discernable border separating the future OPs from the neural tube. By 2–4ss embryos the lumen of the forming neural tube was evident and later at 8–98ss the lateral borders of the neural tube were clearly defined. The morphological appearance of the lateral border was evident at 8ss by an increase in laminin immunoreactivity separating the high Dlx3 immunoreactivity (presumed OP) from the more medial low immunoreactivity (presumed telencephalon) in the anterior neural plate/tube. Migration of the CNC cells further separated the central from the peripheral olfactory sensory system and was correlated with the appearance of two separate basal laminae. These data support a model where the peripheral olfactory system arises from a continuous region within the neural plate/neural tube similar to the visual system.
Figure 10.
The olfactory sensory system develops as an integrated unit. Center: Schematic of anterior neural plate during early somitogenesis with left side (a) representing the current model with the central olfactory field (1) (telencephalon, red, red arrow) inducing (small red arrows) the peripheral olfactory field (OP, orange, orange arrow) secondarily (2) from ectoderm. Cross-section of forming neural tube at 2ss (a1) and 20ss (a2) showing visual field cells (blue) and telencephalic field (red) and the OP (orange). On right (b) the central olfactory field + peripheral olfactory fields (brown) are induced together (1,1) as a common field with shared morphogenetic movements. Cross section of forming neural tube at 2ss (b1) and 20ss (b2) with visual field cells (blue) and a shared central olfactory field + peripheral olfactory fields (brown). Blue shape and arrows represent movements of optic vesicle field during morphogenesis. a2, b2) frontal view of head corresponding to 20ss. a1, a2, b1, b2 modified from (Whitlock, 2008).
Olfactory epithelia and olfactory bulb: a shared history
In studies of placodal development there has been a tendency to concentrate on the characteristics shared amongst placodes (Schlosser 2006), not the characteristics that the neurons derived from these structures share with their central targets. The continuous field of cells we observed at early somitogenesis and the clones of cells moving through these fields suggested an initial common mechanism controlling peripheral and central olfactory identity. Transcription factors belonging to the forkhead family of winged helix molecules as well as the Dlx homeodomain containing family are important in patterning the olfactory system (Solomon and Fritz, 2002). As part of anterior neural plate pattern patterning several transcription factors are expressed in the olfactory sensory system, including the future telencephalon and OP. The Foxg1 transcription factor is expressed in both the olfactory sensory precursors and telencephalic precursors in both mouse and zebrafish (Danesin et al., 2009; Kawauchi et al., 2009; Danesin and Houart, 2012; Zhao et al., 2009). The loss of function of Foxg1 in knock-out mice leads to loss of the entire olfactory system including the OE, bulb and vomeronasal organ (Duggan et al., 2008). In zebrafish the hypomorphic phenotype generated using morpholinos directed against Foxg1 is less severe but consistent in that the olfactory system has a significant decrease in the number of proliferating cells both in the OE and bulbs (Duggan et al., 2008). Thus this gene whose expression is initiated in late gastrula/early neurula plays an important role in neurogenesis throughout the peripheral and central olfactory system.
Like Foxg1, transcription factors in the Dlx family play an important role in olfactory system development. In mouse the Dlx family member Dlx5 is expressed in the olfactory system (Long et al., 2003) and loss of this gene results in selective defects of these structures as well as facial malformations (Acampora et al., 1999). The olfactory epithelia of the Dlx5 mutants have fewer olfactory sensory neurons and these neurons do not generate axons that connect to the olfactory bulb. Additionally the olfactory bulb circuitry is affected with specific defects in the granule and mitral cells (Long et al., 2003). Thus both Foxg1 and Dlx5 appear to promote olfactory identity evident by loss of function phenotypes in both peripheral and central olfactory system.
Dividing the field
Early in development (2–4ss) it was possible to observe the initiation of low levels of laminin immunoreactivity associated with the lateral border of the eye field (Ivanovitch et al., 2013; Cavodeassi et al., 2013). Correlated with the appearance of the visible border of the lateral neural tube at 8–9ss, visualized in the β-actin:GAP43-GFP time-lapse movies, the laminin immunoreactivity appeared to separate the Dlx3 expressing domain at 8ss. As the laminin levels increased in the region between the developing OP and neural tube, the fields were further separated by the advancing CNC. The separation of peripheral and central olfactory regions is accompanied by changing patterns of gene expression: emx1 and emx2 (Bishop et al., 2003; Hauptmann et al., 2002) are localized to the central olfactory region and the dlx3 and six4b (Kobayashi et al., 2000; Whitlock and Westerfield, 2000; Harden et al., 2012) are localized to the peripheral olfactory regions. In an analysis of genes expressed in the “placode domain” at the border of the neural plate three genes (Eya1, Six1, Six4; Schlosser and Ahrens, 2004) have been identified as common to all placodes with the exception of the lens (here again supporting the non-neuronal vs. neuronal aspects of ectoderm vs. neurectoderm) and this domain of expression is termed the placode domain. The link between these peripheral and central olfactory domains is supported by the changing pattern of Dlx3b shown here: the Dlx3b expression remains high in the periphery and decreases toward the midline where it is co-localizes with the emx1 positive field (Fig. 2) giving rise to the telencephalon. The patterning of the olfactory system proposed here would be: 1) Pattern anterior neural plate and give general olfactory identity (Foxg1, Dlx genes), 2) Identify the periphery (Six4, Eya1), 3) Identify the central targets (emx1, emx2), 4) OP becomes morphologically visible in association with CNC migration. Because the olfactory placodes are derived from the neural plate and not vice versa, (peripheral nervous system is derived from placode), we propose a term more appropriate to early development: PNS domain. Thus the olfactory PNS domain gives rise to the OP a morphological structure that may result from an association with CNC derived bones surrounding and encasing the olfactory system, leaving the dendrites exposed to the external environment.
Mixing of olfactory and neural crest fates
The peripheral nervous system is generally described as arising from neural crest and placode derived cells. Previously we have shown that the CNC cells migrate anteriorly as the cellular field condenses to give rise to the OP and that there is little mixing between OP precursors and neural crest (Harden et al., 2012; Boric et al., 2013). Subsequently it was reported that the microvillar neurons of the OP expressed the Sox10:GFP transgene (Saxena et al., 2013). Although previously we observed Sox10:GFP expression in the olfactory sensory system (Harden et al., 2012), its pattern did not correspond to known gene expression patterns for the endogenous sox10 gene (Dutton et al., 2001; Whitlock et al., 2005; Harden et al., 2012) and as a result it was only mentioned in the discussion. Therefore, in contrast to the transgenic reporter lines, there is no sox10 gene expression in the OP as judged by in situ hybridization during early development. In our previous studies (Harden et al., 2012; Boric et al., 2013) we used the line with a 4.9 kb of promoter driving the GFP expression Tg(−4.9sox10:eGFP) (Wada et al., 2005; Carney et al., 2006) to visualize Sox10:GFP expression in the migrating neural crest. In contrast, the line used in the data presented in this paper, chosen because it drives RFP to co-localize with the TRPC2:GFP line, has a different (larger) promoter Tg(sox10(7.2):mrfp) (Kucenas et al., 2008). In this transgenic line, as we showed here, there is no co-localization of Sox10:RFP with the TRPC2:GFP positive neurons. The pattern of expression of a reporter line is dependent upon the promoter driving the reporter protein, thus the difference is most likely due to the 4.9 vs. 7.2 promoters. Because reporter lines are not “knock-ins” they are subject to insertion effects that may change their expression pattern relative to the endogenous gene. Ultimately the expression of the Sox10:GFP and Sox10:RFP reporter lines should reflect the expression of the endogenous genes (with variances due to perdurance of the reporter protein) and neither reporter line faithfully reflects the details of the endogenous expression of sox10 in that both lines have variable expression in the OPs. Thus it is unclear at this time whether the CNC cells contribute to differentiated olfactory sensory neurons in the OP.
Conclusions and model
In the commonly accepted model (Fig. 10a) the telencephalic field (Fig. 10a, red) arises form the neural plate that is patterned at the end of gastrulation. The neural plate/tube will induce (Fig. 10a, small red arrows) the OP domain (Fig. 10a, orange) from the adjacent ectoderm resulting in two temporally distinct events leading to the formation of the telencephalon (Fig. 10a1, a2, red) and OP (Fig. 10a1, a2, orange). In contrast, we have shown, that these structures appear to arise simultaneously from the neural plate (Fig. 10b, brown). The telencephalon and OP arise from the anterior neural plate (Fig. 10b brown) leading to the formation of the telencephalon and OP (Fig. 10b1, b2, brown). Thus the development of the olfactory system is similar to the visual system (Fig. 10, blue) where the peripheral sensory receptors develop from the neural plate. These observations help explain the alignment of the periphery with its central targets in a constantly moving three-dimensional space.
Experimental Procedures
Animals
All fish were maintained in the Whitlock Fish Facility at the Universidad de Valparaiso. Wild-type fish of the Cornell strain (derived from Oregon AB) were used. Transgenic lines sox10:GFP (Wada et al., 2005) β-actin:GAP43-GFP (lab of M. Concha), TRPC2:GFP (Sato et al., 2005), sox10:RFP (Kucenas et al., 2008) were used to visualize specific cells types. The embryos, obtained from natural spawnings in laboratory conditions, were grown at 28.5 in Embryo medium (13.7 mM NaCl, 0.54 mM KCI, 1.3 mM CaCl2, 1.0 MgSO4, 0.044 mM KH2PO4, 0.025 mM NaH2PO4, and 0.42 mM NaHCO3 at pH 7.2) as described before (Westerfield, 2007) and staged according to (Kimmel et al., 1995).
Inmunocytochemistry
Staged embryos were fixed overnight in 4% paraformaldehyde in 0.1M phosphate buffer with 0.15 mM CaCl2 (pH 7,3). After rinsing twice 0.1M phosphate buffer, embryos were permeabilized in acetone at −20C for 7 minutes. After several washes the embryos were incubated for one hour in block solution (0.1 M phosphate buffer, 2% bovine serum albumin, 1% dimethylsulfoxide [DMSO] and 0.5% Triton X-100 and 2% normal goat serum). The primary antibodies used were anti-laminin (rabbit 1:200, Sigma), anti-GFP (mouse 1:1000, Life Technologies) and anti-zebrafish Dlx3b (Mouse 1:250, ZIRC). After 3 washes during 2 hours the embryos were incubated in the secondary antibody, which were Dylight488 conjugated anti-mouse antibody (Goat 1:500, Jackson Immuno Research), Alexa568 conjugated anti-rabbit antibody (goat 1:500, Molecular Probes), and Cy5 anti-mouse antibody (goat 1:500, Jackson Immuno Research). Embryos were then rinsed in 0.1 M phosphate buffer and 1% DMSO 3 times for 1 hour and then stained for DAPI (1ug/mL, Sigma), and mounted in 1.5% low melting agarose (Sigma) in 0.1M phosphate buffer for imaging in Spinning disc confocal microscope (Olympus).
Live imaging
Embryos were mounted in 1.5% low melting agarose (Sigma) with their dorsal side facing up. Mounted embryos were placed in an Attofluor Chamber (Invitrogen) and covered with Embryo Medium. During imaging, the room temperature was maintained at 28C. Z-stacks of 2um in a total optical section of 30um were captured every 5 minutes. For double transgenics green and red fluorescent channels and transmitted light, were captured using a Spinning disc confocal microscope (Olympus).
Data acquisition and analyses
Fluorescent images were taken using a Spinning Disc microscope Olympus BX-DSU (Olympus Corporation, Shinjuku-ku, Tokyo, Japan) and acquired with ORCA IR2 Hamamatsu camera (Hamamatsu Photonics, Higashi-ku, Hamamatsu City, Japan). Images were acquired using the Olympus Cell-R software (Olympus Soft Imaging Solutions, Munchen, Germany) and processed using the deconvolution software AutoQuantX 2.2.2 (Media Cybernetics, Bethesda, MD, USA) and ImageJ® software (National Institute of Health, Bethesda, Maryland, USA). Movies were processed and analyzed using Fiji (NIH).
In situ Hybridization
Embryos were fixed in phosphate-buffered (100 mM) 4% paraformaldehyde (PFA 4%). In situ hybridization was performed as described in (Thisse et al., 1993), using single-stranded RNA probes labeled with digoxigenin-UTP (Roche, Mannheim, Germany). The emx1 probes were generated using plasmid provided by the Westerfield lab. After the colorimetric reaction took place it was stopped and we continued with the immunocytochemistry protocol described before, beginning with the primary antibody (anti-Dlx3b) incubation.
H2B: RFP and Pard3:RFP Injections
β-actin:GAP43-GFP construct (gift from lab of Dr. Miguel Concha) were injected with 10–15 nL of 15 ng/µL H2B:RFP DNA and 1% phenol red and allowed to develop to the desired time. Pard3:RFP vector (gift from lab of Dr. Claudio Araya) was linearized with NotI endonuclease (New England Biolabs) and mRNA was synthesized by in vitro transcription using the SP6 mMessage mMachine System (Ambion). An amount of 150–200pg of mRNA was injected per embryo. Injection pipettes were pulled using borosilicate capillary glass (OD=1.2mm, ID=0.94 mm, 10 cm length) on a Sutter Puller P-2000 (Sutter instruments). Images capturing early cell dynamics were initiated at the 4ss (Fig. 4) and later events were recorded starting at 10ss and continued for 6 hours. Z-stacks of 2 or 3 um in a total optical section of 30um (50–75 um in the case of cell track analyses) were captured every 5 minutes. Time is given in minutes according to the capture rate of a z-stack every 5 minutes.
In order to analyze the migration of cells ending up in the OPs, telencephalon, and retina, we generated movies of selected 6 µm optical sections, keeping the nucleus of the cell of interest (RFP positive) in focus. Quantification was performed using ImageJ to analyze total migration in the X (posterior to anterior) and Y (medial to lateral) axis. Assuming a symmetrical development, the values in the X-axis for cells in left placodes or retinas were multiplied by −1, thus values over and under 0 indicate a medial- to-lateral and lateral-to-medial migration, respectively. The flexion of the head, resulting from the ongoing morphogenesis, did not significantly affect the analyses. Positive values for the movement in the Y-axis indicate a posterior to anterior migration. Statistics were performed using Statistics GraphPad Prism 5 program.
Supplementary Material
Bullet Points.
Peripheral olfactory sensory system arises from neurectoderm
Fields of cells generating the peripheral and central olfactory system move together to generate a functional unit
Cells can move between central and peripheral olfactory fields during development
Acknowledgements
We would like to thank to Lucas Schütz for help with the ImageJ macro used to analyze the movies, Edson Pinto and Valentina Herrera for keeping our fish facility running, and all members of the Whitlock lab for their help in keeping the lab running in spite of water cuts, power cuts, earthquakes, and fires.
Grant support: NIH/NIDCD 050820 (KW); FONDECYT 1111046 (KW); Instituto Milenio ICM-P09-022.F (KW); CONICYT 21110200 (JT).
Contributor Information
Jorge Torres-Paz, Centro Interdisciplinario de Neurociencia de Valparaiso, Instituto de Neurociencia, Universidad de Valparaiso, Avenida Gran Bretana 1111, Valparaiso Chile, 56-32-250-8053, FAX 56-32-250-8027, jorge.torres.paz@gmail.com.
Kathleen E. Whitlock, Centro Interdisciplinario de Neurociencias de Valparaiso, Instituto de Neurociencias, Universidad de Valparaiso, Avenida Gran Bretana 1111, Valparaiso Chile, 56-32-250-8040, FAX 56-32-250-8027, kathleen.whitlock@uv.cl, kewhitlock@gmail.com
References
- Acampora D, Merlo GR, Paleari L, Zerega B, Postiglione MP, Mantero S, Bober E, Barbieri O, Simeone A, Levi G. Craniofacial, vestibular and bone defects in mice lacking the Distal-less-related gene Dlx5. Development. 1999;126:3795–3809. doi: 10.1242/dev.126.17.3795. [DOI] [PubMed] [Google Scholar]
- Akimenko MA, Ekker M, Wegner J, Lin W, Westerfield M. Combinatorial expression of three zebrafish genes related to distal-less: part of a homeobox gene code for the head. J Neurosci. 1994;14:3475–3486. doi: 10.1523/JNEUROSCI.14-06-03475.1994. [DOI] [PMC free article] [PubMed] [Google Scholar]
- Bishop KM, Garel S, Nakagawa Y, Rubenstein JL, O'Leary DD. Emx1 and Emx2 cooperate to regulate cortical size, lamination, neuronal differentiation, development of cortical efferents, and thalamocortical pathfinding. J Comp Neurol. 2003;457:345–360. doi: 10.1002/cne.10549. [DOI] [PubMed] [Google Scholar]
- Boric K, Orio P, Vieville T, Whitlock K. Quantitative analysis of cell migration using optical flow. PLoS One. 2013;8:e69574. doi: 10.1371/journal.pone.0069574. [DOI] [PMC free article] [PubMed] [Google Scholar]
- Carney TJ, Dutton KA, Greenhill E, Delfino-Machin M, Dufourcq P, Blader P, Kelsh RN. A direct role for Sox10 in specification of neural crest-derived sensory neurons. Development. 2006;133:4619–4630. doi: 10.1242/dev.02668. [DOI] [PubMed] [Google Scholar]
- Cavodeassi F. Integration of anterior neural plate patterning and morphogenesis by the Wnt signaling pathway. Dev Neurobiol. 2014;74:759–771. doi: 10.1002/dneu.22135. [DOI] [PubMed] [Google Scholar]
- Cavodeassi F, Houart C. Brain regionalization: of signaling centers and boundaries. Dev Neurobiol. 2012;72:218–233. doi: 10.1002/dneu.20938. [DOI] [PubMed] [Google Scholar]
- Cavodeassi F, Ivanovitch K, Wilson SW. Eph/Ephrin signalling maintains eye field segregation from adjacent neural plate territories during forebrain morphogenesis. Development. 2013;140:4193–4202. doi: 10.1242/dev.097048. [DOI] [PMC free article] [PubMed] [Google Scholar]
- Danesin C, Houart C. A Fox stops the Wnt: implications for forebrain development and diseases. Curr Opin Genet Dev. 2012;22:323–330. doi: 10.1016/j.gde.2012.05.001. [DOI] [PubMed] [Google Scholar]
- Danesin C, Peres JN, Johansson M, Snowden V, Cording A, Papalopulu N, Houart C. Integration of telencephalic Wnt and hedgehog signaling center activities by Foxg1. Dev Cell. 2009;16:576–587. doi: 10.1016/j.devcel.2009.03.007. [DOI] [PubMed] [Google Scholar]
- Duggan CD, DeMaria S, Baudhuin A, Stafford D, Ngai J. Foxg1 is required for development of the vertebrate olfactory system. J Neurosci. 2008;28:5229–5239. doi: 10.1523/JNEUROSCI.1134-08.2008. [DOI] [PMC free article] [PubMed] [Google Scholar]
- Dutton KA, Pauliny A, Lopes SS, Elworthy S, Carney TJ, Rauch J, Geisler R, Haffter P, Kelsh RN. Zebrafish colourless encodes sox10 and specifies non-ectomesenchymal neural crest fates. Development. 2001;128:4113–4125. doi: 10.1242/dev.128.21.4113. [DOI] [PubMed] [Google Scholar]
- Forni PE, Taylor-Burds C, Melvin VS, Williams T, Wray S. Neural crest and ectodermal cells intermix in the nasal placode to give rise to GnRH-1 neurons, sensory neurons, and olfactory ensheathing cells. Journal of Neuroscience. 2011;31:6915–6927. doi: 10.1523/JNEUROSCI.6087-10.2011. [DOI] [PMC free article] [PubMed] [Google Scholar]
- Gans C, Northcutt RG. Neural crest and the origin of vertebrates: a new head. Science. 1983;220:268–273. doi: 10.1126/science.220.4594.268. [DOI] [PubMed] [Google Scholar]
- Harden MV, Pereiro L, Ramialison M, Wittbrodt J, Prasad MK, McCallion AS, Whitlock KE. Close association of olfactory placode precursors and cranial neural crest cells does not predestine cell mixing. Developmental Dynamics. 2012;241:1143–1154. doi: 10.1002/dvdy.23797. [DOI] [PMC free article] [PubMed] [Google Scholar]
- Hauptmann G, Soll I, Gerster T. The early embryonic zebrafish forebrain is subdivided into molecularly distinct transverse and longitudinal domains. Brain Res Bull. 2002;57:371–375. doi: 10.1016/s0361-9230(01)00691-8. [DOI] [PubMed] [Google Scholar]
- Holland LZ. Chordate roots of the vertebrate nervous system: expanding the molecular toolkit. Nat Rev Neurosci. 2009;10:736–746. doi: 10.1038/nrn2703. [DOI] [PubMed] [Google Scholar]
- Holland LZ, Holland ND. Evolution of neural crest and placodes: amphioxus as a model for the ancestral vertebrate? J Anat. 2001;199:85–98. doi: 10.1046/j.1469-7580.2001.19910085.x. [DOI] [PMC free article] [PubMed] [Google Scholar]
- Ivanovitch K, Cavodeassi F, Wilson SW. Precocious acquisition of neuroepithelial character in the eye field underlies the onset of eye morphogenesis. Dev Cell. 2013;27:293–305. doi: 10.1016/j.devcel.2013.09.023. [DOI] [PMC free article] [PubMed] [Google Scholar]
- Kawauchi S, Santos R, Kim J, Hollenbeck PL, Murray RC, Calof AL. The role of foxg1 in the development of neural stem cells of the olfactory epithelium. Ann N Y Acad Sci. 2009;1170:21–27. doi: 10.1111/j.1749-6632.2009.04372.x. [DOI] [PMC free article] [PubMed] [Google Scholar]
- Kimmel CB, Ballard WW, Kimmel SR, Ullmann B, Schilling TF. Stages of embryonic development of the zebrafish. Dev Dyn. 1995;203:253–310. doi: 10.1002/aja.1002030302. [DOI] [PubMed] [Google Scholar]
- Kobayashi M, Osanai H, Kawakami K, Yamamoto M. Expression of three zebrafish Six4 genes in the cranial sensory placodes and the developing somites. Mech Dev. 2000;98:151–155. doi: 10.1016/s0925-4773(00)00451-2. [DOI] [PubMed] [Google Scholar]
- Kozlowski DJ, Murakami T, Ho RK, Weinberg ES. Regional cell movement and tissue patterning in the zebrafish embryo revealed by fate mapping with caged fluorescein. Biochem Cell Biol. 1997;75:551–562. [PubMed] [Google Scholar]
- Kucenas S, Takada N, Park HC, Woodruff E, Broadie K, Appel B. CNS-derived glia ensheath peripheral nerves and mediate motor root development. Nat Neurosci. 2008;11:143–151. doi: 10.1038/nn2025. [DOI] [PMC free article] [PubMed] [Google Scholar]
- Long JE, Garel S, Depew MJ, Tobet S, Rubenstein JL. DLX5 regulates development of peripheral and central components of the olfactory system. J Neurosci. 2003;23:568–578. doi: 10.1523/JNEUROSCI.23-02-00568.2003. [DOI] [PMC free article] [PubMed] [Google Scholar]
- Morita T, Nitta H, Kiyama Y, Mori H, Mishina M. Differential expression of two zebrafish emx homeoprotein mRNAs in the developing brain. Neurosci Lett. 1995;198:131–134. doi: 10.1016/0304-3940(95)11988-9. [DOI] [PubMed] [Google Scholar]
- Onuma TA, Ding Y, Abraham E, Zohar Y, Ando H, Duan C. Regulation of temporal and spatial organization of newborn GnRH neurons by IGF signaling in zebrafish. Journal of Neuroscience. 2011;31:11814–11824. doi: 10.1523/JNEUROSCI.6804-10.2011. [DOI] [PMC free article] [PubMed] [Google Scholar]
- Pieper M, Eagleson GW, Wosniok W, Schlosser G. Origin and segregation of cranial placodes in Xenopus laevis. Dev Biol. 2011;360:257–275. doi: 10.1016/j.ydbio.2011.09.024. [DOI] [PubMed] [Google Scholar]
- Raible F, Brand M. Divide et Impera--the midbrain-hindbrain boundary and its organizer. Trends Neurosci. 2004;27:727–734. doi: 10.1016/j.tins.2004.10.003. [DOI] [PubMed] [Google Scholar]
- Sato Y, Miyasaka N, Yoshihara Y. Mutually exclusive glomerular innervation by two distinct types of olfactory sensory neurons revealed in transgenic zebrafish. J Neurosci. 2005;25:4889–4897. doi: 10.1523/JNEUROSCI.0679-05.2005. [DOI] [PMC free article] [PubMed] [Google Scholar]
- Saxena A, Peng BN, Bronner ME. Sox10-dependent neural crest origin of olfactory microvillous neurons in zebrafish. Elife. 2013;2:e00336. doi: 10.7554/eLife.00336. [DOI] [PMC free article] [PubMed] [Google Scholar]
- Schlosser G. Induction and specification of cranial placodes. Dev Biol. 2006;294:303–351. doi: 10.1016/j.ydbio.2006.03.009. Epub 2006 May 2003. [DOI] [PubMed] [Google Scholar]
- Schlosser G, Ahrens K. Molecular anatomy of placode development in Xenopus laevis. Dev Biol. 2004;271:439–466. doi: 10.1016/j.ydbio.2004.04.013. [DOI] [PubMed] [Google Scholar]
- Solomon KS, Fritz A. Concerted action of two dlx paralogs in sensory placode formation. Development. 2002;129:3127–3136. doi: 10.1242/dev.129.13.3127. [DOI] [PubMed] [Google Scholar]
- Tawk M, Araya C, Lyons DA, Reugels AM, Girdler GC, Bayley PR, Hyde DR, Tada M, Clarke JD. A mirror-symmetric cell division that orchestrates neuroepithelial morphogenesis. Nature. 2007;446:797–800. doi: 10.1038/nature05722. Epub 2007 Mar 2028. [DOI] [PubMed] [Google Scholar]
- Thisse C, Thisse B, Schilling TF, Postlethwait JH. Structure of the zebrafish snail1 gene and its expression in wild-type, spadetail and no tail mutant embryos. Development. 1993;119:1203–1215. doi: 10.1242/dev.119.4.1203. [DOI] [PubMed] [Google Scholar]
- Wada N, Javidan Y, Nelson S, Carney TJ, Kelsh RN, Schilling TF. Hedgehog signaling is required for cranial neural crest morphogenesis and chondrogenesis at the midline in the zebrafish skull. Development. 2005;132:3977–3988. doi: 10.1242/dev.01943. [DOI] [PubMed] [Google Scholar]
- Wei X, Cheng Y, Luo Y, Shi X, Nelson S, Hyde DR. The zebrafish Pard3 ortholog is required for separation of the eye fields and retinal lamination. Dev Biol. 2004;269:286–301. doi: 10.1016/j.ydbio.2004.01.017. [DOI] [PubMed] [Google Scholar]
- Westerfield M. The zebrafish book: A guide for the laboratory use of zebrafih (Danio rerio) Eugene OR USA: University of Oregon Press; 2007. [Google Scholar]
- Whitlock KE. Developing a sense of scents: plasticity in olfactory placode formation. Brain Res Bull. 2008;75:340–347. doi: 10.1016/j.brainresbull.2007.10.054. [DOI] [PMC free article] [PubMed] [Google Scholar]
- Whitlock KE, Smith KM, Kim H, Harden MV. A role for foxd3 and sox10 in the differentiation of gonadotropin-releasing hormone (GnRH) cells in the zebrafish Danio rerio. Development. 2005;132:5491–5502. doi: 10.1242/dev.02158. [DOI] [PubMed] [Google Scholar]
- Whitlock KE, Westerfield M. The olfactory placodes of the zebrafish form by convergence of cellular fields at the edge of the neural plate. Development. 2000;127:3645–3653. doi: 10.1242/dev.127.17.3645. [DOI] [PubMed] [Google Scholar]
- Zhao XF, Suh CS, Prat CR, Ellingsen S, Fjose A. Distinct expression of two foxg1 paralogues in zebrafish. Gene Expr Patterns. 2009;9:266–272. doi: 10.1016/j.gep.2009.04.001. [DOI] [PubMed] [Google Scholar]
Associated Data
This section collects any data citations, data availability statements, or supplementary materials included in this article.


