

Abstract
We combined microfluidic tools and molecular probes to monitor the migration speed of successive generations of cancer cells. We found that the migratory speed of individual cells changes stochastically from parent cells to their descendants, while the average speed of successive generations of cells remains constant. Further studies of the interrelations between cell migration and division processes may help identify the molecular determinants of cell speed and lead to new therapies to slow the invasion of cancer cells and delay metastases.
INNOVATION
Two hallmark abilities of malignant cells, to divide and to invade, are critical during the pathology associated with cancers, including local invasion and formation of distant metastases. Although each of these abilities is the topic of intense research, the two processes are not usually studied together. It is generally assumed that the clonal proliferation of cells gives rise to homogenous cell populations that share the phenotype of their precursors, including their ability to move. However, this assumption has not yet been properly verified because of technological limitations of tracking the movement of individual cells in clonal populations. In this study, we report on a microfluidic device that confines cells in channels and enables precise measurements of cell migration speed for clonal populations as small as two cells. We show that the migration speed changes stochastically from one cell to its descendants, while the average speed of successive generations of cells remains constant. These results suggest that a molecular circuit that controls the speed of individual cells exists. Once identified, such mechanism could eventually be targeted by drugs to reduce the migration speed of malignant epithelial cells and delay metastases. Alternatively, the mechanisms could be targeted to accelerate the migration of healthy epithelial cells during wound repair.
NARRATIVE
Cancer cells that are descendants of faster cells in a population are considered likely to also move faster and to be more effective at giving rise to distant metastases than the rest1–3. However, studies of metastasis formation using cells selected from clonal populations based on speed, so far have failed to show clear advantages for the faster cells compared to the original population4. While it has been suggested that the speed of cell migration may not be important for metastases5, other explanations for the lack of differences are also possible, including the heterogeneity of cell migration phenotype in various populations of cells6.
To monitor the migration speed of individual cells before and after division, we employed microfluidic devices that confine the migration of cells in small channels (Fig. 1). As previously shown, such mechanical confinement induces persistent migration at constant speed for long periods6 and is driven by self-generated EGF gradients7. To prevent cell-cell interactions that could interfere with cell migration, we minimized the number of cells that can enter simultaneously in the same channel by loading the cells in larger “loading channel” connected to all migration channels (Fig. 1b,c). A solution of 30 μg/mL collagen IV was used to coat the surface of the channels, to facilitate cell adhesion and migration, as shown in earlier studies6. HCT-116 (human colon carcinoma) and MCF-7 (human breast carcinoma) cell lines, transfected with FUCCI Gemini markers of cell cycle, were loaded in the devices and observed by time-lapse imaging every 20 minutes for 48 hours. The timing of cell cycle was defined by the progressive increase in fluorescence in the G2 phase of the cell cycle and the sudden drop in fluorescence at the end of mitosis (M, Fig. 1a). To measure the migration speed of dividing cells and their progenies, cells were tracked manually for 6 hours before and 6 hours after cell division.
Figure 1.

Cell migration through channels in relation to cell division events. (a) Kymograph showing the typical cell migration before and after cell division. Cancer cells migrating persistently through channels stop before dividing. The two daughter cells migrate with different speed, also distinct from the mother cells. The nucleus of the cells is labeled with Hoechst dye. To precisely identify the dividing cells, a Fucci fluorescent marker was used. The fluorescence of nucleus increases progressively in cells in the G2 phase and turns off after the M phase, throughout the G0/G1 phase of the cell cycle. (b) To precisely quantify the migration speed, a microfluidic device is employed, inside which migrating epithelial cells are confined in small migration channels and their migration driven at constant speed by self-generated EGF gradients. (c) Moving cells were confined in straight migration channels with cross section slightly smaller than the cell size (10 × 10 μm). The migration channels are 900 μm long, to accommodate the moving cells for more than 12 hours.
For each of the dividing cells, we characterized the migration of mother cells before divisions and that of the daughter-pairs of cells after division (Fig. 2a). The average migration speed through the migration channels was 0.23 ± 0.16 and 0.52 ± 0.55 μm/min for the two cell lines, HTC-116 and MCF-7, respectively. We observed that cells stop for 1.2 ± 0.4 hours before the mitosis (for both HTC-116 and MCF-7) and resume migration at 1.2 ± 0.6 hours for HTC-116 and 1.1 ± 0.1 hours for MCF-7 after mitosis. To exclude the artifact of cytokinesis and other changes in migration speed around the time of mitosis, we calculated the migration speed for hours 4 to 2 before division and hours 2 to 4 after division. The first cell in the direction of migration, immediately after division, is identified as daughter cell 1 (D1) and the one following as daughter cell 2 (D2). Often, the D2 cell starts moving with a delay but moves faster and eventually overtakes the D1 cell. It is thus most likely that the design of the channel influences equally the speed of the daughter cells.
Figure 2.
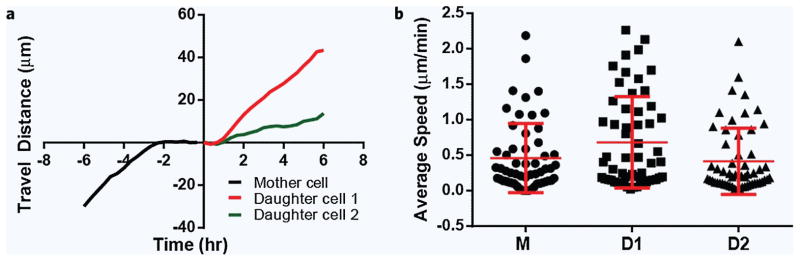
Detailed analysis of cell migration through channels in relation to cell division events. (a) Typical displacement for HCT-116 cells before and after division. Cells migrate at constant speed for several hours and temporarily pause before division. The two daughter cells commence migration shortly after division and migrate at different velocities that are uniform over time. (b) The average and standard deviation of the migration velocities of the mother (hours −4 to −2) and all daughter cells (hours 2 to 4) are comparable (N = 47 cells).
We compared the average migration speed for HTC-116 cells before and after cell division (N = 47 cells, Fig. 2b). We verified that the division rate of the cells is not altered by the mechanical confinement in the channels. For this purpose, we compared the percentage of cells dividing over 24 hours on flat glass-bottom surface outside the device and inside the channels of the device. We found that after 24 hours, 50 ± 10% of cells in channels and 65 ± 10% of cells in a standard dish undergo mitosis (p = 0.1, N = 3 experimental repeats).
To estimate the variability of cell velocity over time, we analyzed the migration speed of MCF-7 cells at two distinct, one hour time intervals before division and found significant correlations between the two velocities (R2 = 0.72, Fig. 3a, N = 56 cells). By comparison, the correlations between migration velocity for the mother and first and second daughter cells were close to zero (R2 = 0.03 for D1, R2 = 0.07 for D2, Fig. 3b,c, N = 56 cell pairs) indicating that the migration phenotype is not shared by descendent cells. There was also no significant correlation between the velocities of the two daughter cells (R2 = 0.25, Fig. 3d). The correlation coefficient was slightly higher than for the mother-daughter pairs, likely due to the situation when daughter cells remain close to each other and migrate together more often than separated from each other. This situation is unlikely due to mechanical restrictions in the channel, because we observed quite often the two daughter cells passing each other. Most often, the two daughter cells transiently separate, confirming that the division process was completed. At this time, it is not clear if the two distinct sub-populations, one with high D1/D2 correlation (on the diagonal line), and the other has low correlation (close to D1 axes) reflect heterogeneities of cell-cell interaction in the cell population8 or discrete thresholds of sensitivity to the self generated gradients7. Comparable results were measured in the second cell line HTC-116 (R2 = 0.03 for D1, R2 = 0.08 for D2, and R2 = 0.4 for mother cells before division; N = 47 cell pairs, Fig. 3e).
Figure 3.

Lack of correlations between migration speed of mother and daughter MCF-7 cells. (a) The average migration speed of cells before division does not change significantly over time. We found high correlations between the velocities of the same cells measured for one hour intervals at 4 and 3 hours before division (N = 56 cell pairs). (b,c) We found no correlations between the mother and the two daughter cells. Daughter cell 1 (D1) is the cell closer to the entrance to the migration channels, the first cell in the direction of cell migration. (d) Most of the time the two daughter cells dissociate completely and move at distinct velocities. When the daughter cells adhere to each other, they share the same velocity for longer time. (e) A comparison between the correlation coefficients for cell velocities in two cell lines, MCF-7 and HCT-116, shows lower levels of correlation between mother and daughter cells compared to mother cells at two different time intervals. (N = 56 for MCF-7 and N = 47 cell pairs for HCT-116.)
The measurements enabled by the microfluidic device would not have been possible using traditional tools for observing cell migration. Transwell assays could compare population averages but lack single cell and temporal resolution. Wound healing assays have single cell resolution, however the results are confounded by interactions between moving cells. Micropipette experiments are not appropriate for experiments longer than a few hours, and are inefficient for capturing events associated with cell division. Microfluidic devices that establish stable gradients using laminar flow and streams of different concentrations9 cannot follow cells after division, because dividing cells round up above the surface, lose their attachment to surfaces and are easily removed by the flow. Other microfluidic devices that establish gradients by diffusion in the absence of flow are not precise enough to make comparisons between individual cells because of the variations in cell migration and directionality over time when moving on flat surfaces10. Only devices that confine epithelial cells in channels can induce uniform behavior and enable high precision for cell migration speed measurements6. In the past, these devices enabled quantitative studies of the mechanisms of self-guidance of epithelial cells through mazes of channels7 and helped probe the role of myc gene during invasion through channels filled with Matrigel11. Detailed analysis of nutrient transport through the channels to the moving cells revealed that no nutrient limitations occur in these devices7.
Our observations of stochastic variations of migration speed between daughter cells in clonal populations are along the lines of other stochastic functions reported in cells. For example, the time to initiate migration in neutrophils exposed to successive stimuli is stochastic12, T helper cells make random decisions during cytokine secretion13, stochastic levels of AKT drive the asymmetric division of cancer cells14, and stochastic synthesis of mRNA in eukaryotic15 and prokaryotic cells16 has consequences on the phenotype of cells share the same genomic information17. Other factors, like the internal organization of cells and positioning of mitochondria during migration could also be a source of variability for cell migration speed18. However, the determinants of cell migration speed cannot be entirely stochastic. The two cell types in this study display differences in their average migration speeds that are stable over time, through successive cycles of cell division. Thus, while the typical migration speed for a cell is encoded in the genome, additional factors, most likely epigenetic, are also critical for determining the velocity of individual cells throughout their lifetime.
Our study raises important questions regarding the migration and division of epithelial cells. First, the lack of correlation between the speed of migration in mother and daughter cells indicates that stochastic events during mother cell division are important in determining the migration phenotype for the lifetime of the daughter cells. Finding what these factors are and how they interact with the mechanisms of cell migration may have practical implications, for example for increasing the cell migration velocity for epithelial cells during division. Second, the robust stop of cell migration at the time of division, before the initiation of the mitosis is an indication that endogenous stop signals exist in cells. Identifying signals that are specific to cancer cells and using these signals to control their motility may reduce the invasion and delay the progression of disease. Future studies, enabled by the microfluidic technologies, may shed light in these areas and have practical implications for health and disease.
METHODS
Microfluidic device design and fabrication
The design of the microfluidic device enables precise measurements of cancer cell migrating while confined in small channels (10 × 10 × 900 μm). To minimize the number of cells that can enter simultaneously in the channels a loading channel is used instead of a cell loading chamber. The device is fabricated using standard microfabrication technologies. Briefly, two layers of negative photoresist (SU8, Microchem, Newton, MA), the first one 10 μm thin and the second one 50 μm thick were patterned on one silicon wafer by sequentially employing three photolithography masks and processing cycles according to the instructions from the manufacturer. The wafer with patterned photoresist was used as a mold to produce PDMS (Polydimethylsiloxane, Fisher Scientific, Fair Lawn, NJ) parts. After baking for 12 hours at 70 °C, the cast PDMS was removed from the mold. Each device was cut using a 5 mm puncher with a hole punched with a 0.8 mm puncher in the center. These individual devices were then bonded irreversibly to a 24-well glass bottom plate (Mattek, Ashland, MA).
Surface modification
Immediately after bonding and while the PDMS was still hydrophilic, 2 μL of a solution of 30 μg/mL1 collagen IV were added inside the center well of each device. The strong capillary force ensured the collagen solution quickly filled the channels. Excess collagen was later washed away by adding 1 mL of phosphate buffer (PBS) to the central well of the devices. Each well was then filled with 1 × PBS and the whole plate was left in desiccator at room temperature for 20 minutes to remove any air bubbles trapped inside the channels during priming.
Cell lines
HCT-116 (human colon carcinoma) and MCF-7 (human breast carcinoma) cell lines transfected with FUCCI Gemini (Invitrogen, Carlsbad, CA) were gifts from Dr. Sridhar Ramaswamy (Massachusetts General Hospital, Boston, MA). HCT-116 cells were cultured in McCoy 5A media with 10% fetal bovine serum (FBS) and 1% PenStrep. MCF-7 cells were cultured in DMEM media containing 10% FBS, 1% PenStrep and 4 mM glutamine. Before experiments, cells were stained with Hoechst 33342 (Life Technologies, Grand Island, NY) for 1 hour followed by washing with PBS twice. After detachment from cell culture flasks using trypsin (0.02% trypsin–EDTA in PBS, Sigma), cells were centrifuged and re-suspended in complete media at 1 × 10⁶ cells/mL. Cells were then loaded into each device by directly pipetting 2 μL of the cell suspension. After the cells were settled down at the entrance of migration channels, 1 mL of the complete media was added to each well to completely cover the device.
Time lapse imaging and image analysis
Cell migration was recorded using time-lapse imaging on a fully automated Nikon TiE microscope (10× magnification) with a motorized stage and biochamber heated to 37 °C in the presence of 5% carbon dioxide gas. Images were taken every 20 minutes for 48 hours at multiple locations on microfluidic chips. Cell displacement and speed were tracked manually using Image J (NIH).
Statistical analysis
Cell motility was analyzed by average speed (total travel distance over migration time) and instantaneous speed (calculated for 20 minute intervals). Three experimental repeats were considered for each comparison (N = 3). Correlations between variables were tested using a linear regression model and was implemented in Prism (GraphPad Software, San Diego, CA). The fraction of cells divided at 24 hours was measured in three independent experiments (N = 3) and the significance of the differences estimated using the t Student test.
Acknowledgments
We thank Dr. Sridhar Ramaswamy (Massachusetts General Hospital, Boston, MA) for the HCT-116 (human colon carcinoma) and MCF-7 (human breast carcinoma) cell lines transfected with FUCCI Gemini (Invitrogen, Carlsbad, CA). All microfabrication was performed at the BioMEMS Resource Center, supported in part by National Institutes of Health grant EB002503. This work was supported in part by NIH grants CA135601 and GM092804.
References
- 1.Hanahan D, Weinberg RA. Hallmarks of cancer: The next generation. Cell. 2011;144:646–674. doi: 10.1016/j.cell.2011.02.013. [DOI] [PubMed] [Google Scholar]
- 2.Friedlander DR, Zagzag D, Shiff B, Cohen H, Allen JC, Kelly PJ, Grumet M. Migration of brain tumor cells on extracellular matrix proteins in vitro correlates with tumor type and grade and involves alphaV and beta1 integrins. Cancer Res. 1996;56:1939–1947. [PubMed] [Google Scholar]
- 3.Grimstad IA. Direct evidence that cancer cell locomotion contributes importantly to invasion. Exp Cell Res. 1987;173:515–523. doi: 10.1016/0014-4827(87)90291-6. [DOI] [PubMed] [Google Scholar]
- 4.Grimstad IA. Growth and metastasis of hypermotile, hyperinvasive cancer cells selected in vitro by rapid locomotion under various conditions. Clin Exp Metastasis. 1988;6:257–269. doi: 10.1007/BF01753573. [DOI] [PubMed] [Google Scholar]
- 5.Niggemann B, Maaser K, Lu H, Kroczek R, Zanker KS, Friedl P. Locomotory phenotypes of human tumor cell lines and T lymphocytes in a three-dimensional collagen lattice. Cancer Lett. 1997;118:173–180. doi: 10.1016/s0304-3835(97)00328-5. [DOI] [PubMed] [Google Scholar]
- 6.Irimia D, Toner M. Spontaneous migration of cancer cells under conditions of mechanical confinement. Integr Biol (Camb) 2009;1:506–512. doi: 10.1039/b908595e. [DOI] [PMC free article] [PubMed] [Google Scholar]
- 7.Scherber C, Aranyosi AJ, Kulemann B, Thayer SP, Toner M, Iliopoulos O, Irimia D. Epithelial cell guidance by self-generated EGF gradients. Integr Biol (Camb) 2012;4:259–269. doi: 10.1039/c2ib00106c. [DOI] [PMC free article] [PubMed] [Google Scholar]
- 8.Wong IY, Javaid S, Wong EA, Perk S, Haber DA, Toner M, Irimia D. Spatiotemporal analyses of malignant epithelial-mesenchymal transitions reveal heterogeneous and hierarchical cell invasion behaviors. Nat Mater. 2014 doi: 10.1038/nmat4062. in press. [DOI] [PMC free article] [PubMed] [Google Scholar]
- 9.Mosadegh B, Saadi W, Wang SJ, Jeon NL. Epidermal growth factor promotes breast cancer cell chemotaxis in CXCL12 gradients. Biotechnol Bioeng. 2008;100:1205–1213. doi: 10.1002/bit.21851. [DOI] [PubMed] [Google Scholar]
- 10.Kim BJ, Hannanta-Anan P, Chau M, Kim YS, Swartz MA, Wu M. Cooperative roles of SDF-1alpha and EGF gradients on tumor cell migration revealed by a robust 3D microfluidic model. PLoS One. 2013;8:e68422. doi: 10.1371/journal.pone.0068422. [DOI] [PMC free article] [PubMed] [Google Scholar]
- 11.Wolfer A, Wittner BS, Irimia D, Flavin RJ, Lupien M, Gunawardane RN, Meyer CA, Lightcap ES, Tamayo P, Mesirov JP, et al. MYC regulation of a “poor-prognosis” metastatic cancer cell state. Proc Natl Acad Sci USA. 2010;107:3698–3703. doi: 10.1073/pnas.0914203107. [DOI] [PMC free article] [PubMed] [Google Scholar]
- 12.Irimia D, Balazsi G, Agrawal N, Toner M. Adaptive-control model for neutrophil orientation in the direction of chemical gradients. Biophys J. 2009;96:3897–3916. doi: 10.1016/j.bpj.2008.12.3967. [DOI] [PMC free article] [PubMed] [Google Scholar]
- 13.Fang M, Xie H, Dougan SK, Ploegh H, van Oudenaarden A. Stochastic cytokine expression induces mixed T helper cell states. PLoS Biol. 2013;11:e1001618. doi: 10.1371/journal.pbio.1001618. [DOI] [PMC free article] [PubMed] [Google Scholar]
- 14.Dey-Guha I, Wolfer A, Yeh AC, Albeck JG, Darp R, Leon E, Wulfkuhle J, Petricoin EF, 3rd, Wittner BS, Ramaswamy S. Asymmetric cancer cell division regulated by AKT. Proc Natl Acad Sci USA. 2011;108:12845–12850. doi: 10.1073/pnas.1109632108. [DOI] [PMC free article] [PubMed] [Google Scholar]
- 15.Raser JM, O’Shea EK. Control of stochasticity in eukaryotic gene expression. Science. 2004;304:1811–1814. doi: 10.1126/science.1098641. [DOI] [PMC free article] [PubMed] [Google Scholar]
- 16.Golding I, Paulsson J, Zawilski SM, Cox EC. Real-time kinetics of gene activity in individual bacteria. Cell. 2005;123:1025–1036. doi: 10.1016/j.cell.2005.09.031. [DOI] [PubMed] [Google Scholar]
- 17.Cai L, Friedman N, Xie XS. Stochastic protein expression in individual cells at the single molecule level. Nature. 2006;440:358–362. doi: 10.1038/nature04599. [DOI] [PubMed] [Google Scholar]
- 18.Desai SP, Bhatia SN, Toner M, Irimia D. Mitochondrial localization and the persistent migration of epithelial cancer cells. Biophys J. 104:2077–2088. doi: 10.1016/j.bpj.2013.03.025. [DOI] [PMC free article] [PubMed] [Google Scholar]