Abstract
The depth of two-photon fluorescence imaging in turbid media can be significantly enhanced by the use of the here described fluorescence detection method that allows to efficiently collect scattered fluorescence photons from a wide area of the turbid sample. By using this detector we were able to perform imaging of turbid samples, simulating brain tissue, at depths up to 3mm, where the two-photon induced fluorescence signal is too weak to be detected by means used in conventional two-photon microscopy.
Keywords: two-photon microscopy, turbid media, multiple scattering, imaging depth
1. Introduction
Since its invention in 1990, two-photon fluorescence microscopy [1] has been widely used to image biological tissues. The near-infrared light that is used to induce two-photon fluorescence can penetrate deeper inside tissue samples, thus allowing for high-resolution imaging of deep tissue layers [2-10]. Biological tissue is by nature a turbid media, with optical properties characterized by a strong multiple scattering and inhomogeneity of the refractive index. The excitation light that effectively reaches the focal area is attenuated by scattering so that the imaging depth is limited. Light in biological tissue is strongly forward-scattered, and the optical properties of the media can be characterized by the absorption coefficient μa, the scattering coefficient μs, the anisotropy factor g and the reduced scattering coefficient μ’s = μs (1-g) [3,9]. For most biological tissues the value of g is in the range of 0.6 – 0.95 and μ’s is in the range of 5 – 15 cm−1 [6,11,13]. Some tissue components, such as blood and melanin [12,13], may have a noticeable absorption at excitation wavelengths. However, the contribution of absorption and its effect on imaging depth is usually negligible for most biological tissues when compared with attenuation by multiple scattering, because of much lower values of the absorption coefficients, for instance, for brain tissue μa ~1 cm−1 [6,11].
Most of the excitation light focused inside the turbid media is scattered before reaching the focal area. It can be shown [3] that the intensity of unscattered (ballistic) photons reaching the focal area decays exponentially with depth, while the intensity of the total amount of light decays approximately as 1/depth. However, only ballistic photons induce two-photon fluorescence, because scattered photons will either miss the focal area or be time- delayed, thus not contributing to two-photon processes. For this reason, two-photon induced fluorescence is localized only in a small (micron scale) focal area inside the sample that allows high-resolution imaging in turbid media. Obviously, an increase in the excitation light power will lead to an increase in achievable imaging depths, because a sufficient amount of unscattered photons can be delivered to the focal area at deeper layers. However, as was shown in [3], at a certain power level the excitation light will induce out-of-focus fluorescence near the sample surface that will mask the fluorescence signal from the focal area and limit the possible imaging depth.
To increase imaging depth in turbid media most of the research reported in the literature was concentrated on methods that allow the delivery of more excitation power to the focal area and consequently increase fluorescence intensity and depth at which fluorescence signal can be detected. The excitation light peak power depends on pulse duration and energy and shorter pulses of higher energy are preferable for two-photon fluorescence imaging [14]. An imaging depth of 1mm was demonstrated in brain tissue when a regenerative amplifier was used to increase the excitation pulse power [2]. The numerical aperture (NA) of the focusing optics also affects resolution as well as imaging depth and the optimum NA was found to be 0.6-0.8 for imaging at 300μm depth in tissue phantoms [15]. The use of longer wavelengths for excitation increases the imaging depth due to less scattering of excitation light by the tissue and 1mm depth was achieved in the imaging of a mouse brain at 1280nm wavelength [16]. The application of optical clearing agents [17], which are in fact index matching compounds, was shown to double the image depth in a skin tissue sample (from 40 to 80μm). Another factor that limits imaging depth in tissue is the optical inhomogeneity of the media that leads to a distortion of the excitation light wave-front and degrades imaging performance. To some extent this problem can be corrected by means of adaptive optics [18-20].
Another major problem associated with in-depth fluorescence imaging is the harvesting of fluorescence photons. While acquiring images of deep layers, the detected signal decays with depth due to the decrease in number of induced fluorescence photons, as well as the attenuation of fluorescence by multiple scattering and possible absorption. It is obvious that the ability of the imaging system to collect fluorescence photons propagating in turbid sample will strongly affect the imaging depth, thus deeper layers can be imaged with more sensitive fluorescence detectors.
The overall sensitivity also depends on the efficiency of fluorescence collection optics, which for all commercial and experimental two-photon fluorescence microscope systems utilizes an optical setup, where fluorescence is collected by the same microscope objective that is used for excitation. The collection efficiency of this method is very limited by the ability of the microscope objective to collect photons only at a certain angle and from a relatively small area of the sample, thus leaving most of the fluorescence photons undetected. References [21,22] describe the use of parabolic mirror to reflect these “missed” photons to detector and increase the signal gain and imaging performance. Alternatively, optical fibers can be used for fluorescence collection in imaging systems [23]. A relatively narrow acceptance angle of optical fibers limits their ability to collect fluorescence photons, however, the use of an array of optical fibers, especially large-core fibers with high NA~0.5, can be practically efficient. The additional collection of fluorescence photons by a ring of large-core optical fibers surrounding the objective was shown to have the potential to enhance the overall fluorescence collection efficiency by up to 4-fold signal gain [24].
To resolve this problem we decided to separate excitation and detection optics, thus allowing a more efficient collection of fluorescence and enhancing the possible imaging depth. In this paper we present our detection method and experimental results on imaging in depth in turbid samples with optical properties that simulate brain tissue. To our knowledge, the imaging depth in brain tissue is usually limited to a few hundred microns [6,8,25], and the maximum imaging depth reported is about 1 mm [2,16]. The use of the detection method described below allowed us to perform imaging in turbid samples with brain-like optical properties at depths up to 3 mm, while the maximum depth at which images could be acquired on the same samples by the state-of-the-art commercial two-photon microscope (Zeiss LSM 710) was limited to about 500μm.
Although the presented experimental setup utilizes an optical scheme where excitation and detection are performed on the opposite sides of the sample, this paper also discusses a possible configuration in which excitation and detection optics are combined in the same unit to perform imaging from the same side of the sample.
2. Materials and methods
2.1. Sample preparation
Imaging experiments were performed on samples with fluorescent objects and scattering particles embedded in gelatin or agar gels and in silicone polymer.
Turbid samples were prepared by dispersion of fluorescent microspheres (Invitrogen FluoSpheres yellow-green, size 1μm or 15 μm) and TiO2 particles (Atlantic Equipment Engineers, Ti-602) as a scattering agent in a gelatin or agar gel. Gelatin (Sigma-Aldrich) or agar (Fisher Scientific) was dissolved in hot water to make a 5% or 1% solution respectively, to which fluorescent microspheres and TiO2 powder were subsequently added. The mixture was then placed in an ultrasonic bath to disperse the particles. As soon as the mixture reached room temperature and begun to thicken, it was poured in a 35 x 10 mm Petri dish and placed at 4°C to complete the solidification process.
Silicone samples were prepared according to [26] with the exception of the addition of fluorescent microspheres. These samples were also polymerized in Petri dishes to obtain a sample size of 35 mm diameter x 10 mm thick. The reduced scattering and absorption coefficients of the samples were measured as 14 cm−1 and 0.7cm−1 respectively at 806 nm by the method described in [26].
For experiments on imaging of living cells in turbid media the samples were prepared as following: cell cultures MDA-MB-231 cell line stably expressing paxillin-EGFP were grown in high glucose DMEM medium (Gibco) supplemented with 10% heat-inactivated fetal bolvine serum (Invitrogen), 5mM HEPES (Sigma), and 100 IU/ml penicillin/streptomycin (Invitrogen). Cells were cultured at 37°C in a humidified 5% CO2 atmosphere. Cells were resuspended to a final concentration of 5 x 10⁴ cells/ml in type I collagen solution (final concentration of 2 mg/ml) in PBS, pH value was carefully adjusted with 1M NaOH to ~pH 7. 250 μl of cell-collagen solution was pipetted into one 8-well chambered coverglass (Lab-Tek), and kept at 20 C for 1 hr, then moved to 37°C incubator for 1 hr before fresh medium was applied. The collagen gel containing cells (gel size ~ 10 x 10 x 1 mm thick) then was embedded in a larger size (35 x 10 mm Petri dish) scattering gel made of agar in PBS solution to which 0.3% of intralipid (Fresenius Kabi) was added as a scattering agent.
2.2. Two-photon microscope system
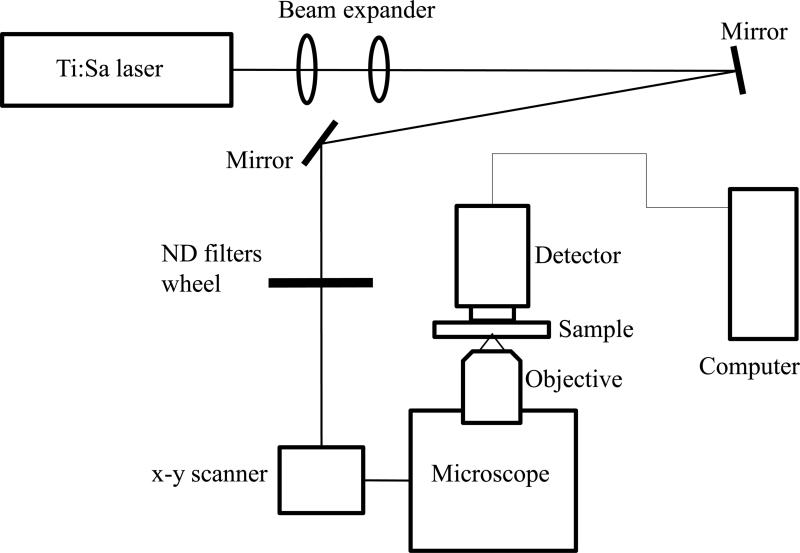
The experimental system diagram is shown in figure 1. A femtosecond Ti:Sapphire laser (Tsunami Spectra-Physics, 100 fs, 80 MHz, 800 nm) was used for the two-photon excitation of the samples. The excitation beam was directed to an ISS Alba x-y-scanner coupled to a Nikon Eclipse TE2000-U microscope equipped with a long working distance Olympus LCPlanFl 20x/0.4 air objective. The objective was mounted on a piezo-stage to perform the z-scan. The maximum power of excitation beam reaching the sample was about 160 mW. The turbid sample in the Petri dish was placed on a microscope stage and the excitation beam was focused by an objective lens inside the sample from its bottom side. The two-photon induced fluorescence was collected by the detector (described below) placed directly on top of the sample. To prevent external light from hitting the sensitive detector, the components were enclosed in a light-sealed box made out of black cardboard.
Figure 1.
Experimental system diagram.
We have also used a commercial two-photon scanning microscope Zeiss LSM 710 to compare results obtained in our experiments.
2.3. Detector
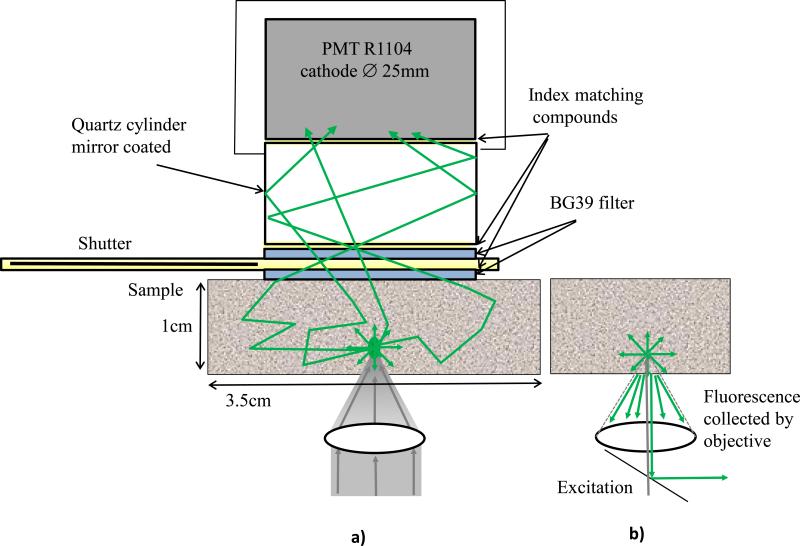
The detector is the key feature of the described experimental setup. The detector and the principle of its operation are shown schematically in figure 2a. The detector consists of a head-on photomultiplier tube with a 25 mm diameter photocathode (Hamamatsu PMT R-1104) that operates in photon-counting mode. The PMT is coupled to a glass cylinder with mirror coated walls. This cylinder works as a light-guide to direct fluorescence photons to the PMT photocathode. The optical shutter, connected to the bottom of the glass cylinder, is made of two 25 x 3mm optical filters (Schott BG-39) that transmit fluorescence, but prevent excitation light from entering the PMT. There is a ~0.2 mm gap between filters were a 0.1mm thin aluminum plate can be inserted to close the shutter. All the detector components are connected with index matching compounds and the gap between filters is filled with an index matching liquid to minimize losses of fluorescence photons due to reflection at the boundaries. For the same purpose, during measurements the detector was placed directly in contact with the surface of samples.
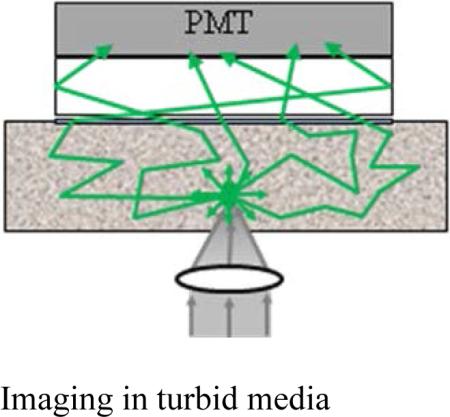
Figure 2.
a) Detector construction and operation diagram; b) fluorescence collection by a microscope objective.
As shown in figure 2a, the two-photon induced fluorescence photons are multiply-scattered inside the turbid sample and when they reach the surface they are collected by the detector from a wide surface area of 25 mm in diameter. Because of multiple scattering, photons originally directed out of the detector have the probability to be redirected and enter the detector. For the same reason, in the multiple scattering media, where photons continuously change direction, light losses due to total internal reflection at the sample/detector boundary are reduced and fluorescence photons that reach it can be picked up by the detector from any angle of incidence. Theoretically, multiple scattering may even enhance fluorescence detection because in multiple scattering media the intensity of the scattered photons decays as 1/distance from the excitation light focus [3], which is slower than the 1/(distance)2 decay that takes place in clear media. We suggest that the described detection method is very efficient in harvesting photons and no microscope objective is capable of collecting photons from such a wide area. For comparison, figure 2b shows conventional two-photon microscope diagram where fluorescence photons can be collected by a microscope objective only from a relatively small area and at narrow angle.
The detector is very simple in construction, it practically does not require any optics, and it should be also efficient for clear media samples. To prove this concept we conducted the measurements described below.
3. Results and discussion
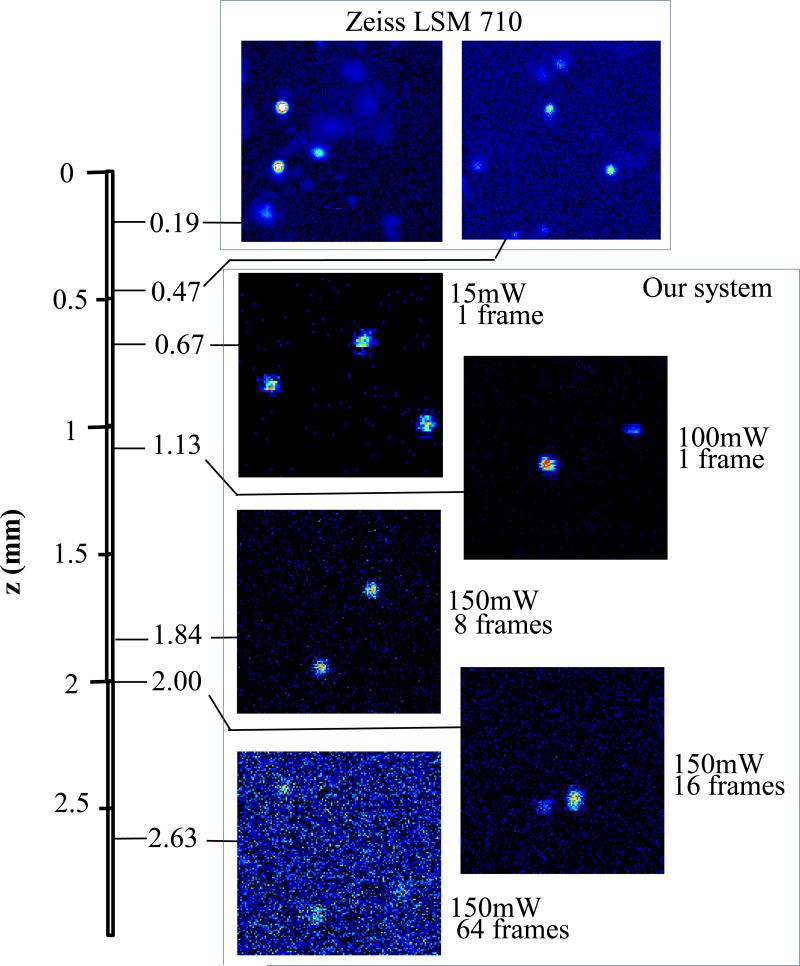
Figure 3 shows images of fluorescent beads dispersed in turbid samples and acquired at various depths. The similar results were obtained for samples made of gelatin or agar gel and silicone. It can be seen that with increased depth the image intensity decays. Moreover, for deeper layers a higher excitation light power and more accumulated frames are required to maintain the image quality. Using our experimental setup and detector we were able to obtain reasonable quality images of fluorescent beads at depths up to about 2.5 mm. When the same samples were imaged with a commercial Zeiss LSM 710 two-photon fluorescence microscope with similar objective and excitation light power, the maximum imaging depth was about 0.5 mm (see fig. 3). That is, in fact, the maximum imaging depth obtained so far in brain tissue [6,8,25], the optical properties of which we have replicated in our samples.
Figure 3.
Images of 1μm fluorescent beads dispersed in turbid sample at various depths.
The images depicted in figure 3 were acquired using an objective with NA=0.4 (Olympus LCPlanFl 20x/0.4) for excitation. Because the beam diameter at focus depends on the numerical aperture as d=1.22λ/NA, where λ is a light wavelength, the use of higher NA objectives results in a smaller beam size, which in turn gives a higher excitation light intensity at focus and thus an increased imaging depth and resolution. However, high NA objectives usually have a short working distance. It was shown [15] that objectives with NA of 0.6 - 0.8 are optimal for two-photon imaging in turbid media. When an objective with NA=0.8 (Olympus LUMPlanFL/IR 40x/0.80w) was used for excitation, it was possible to obtain high resolution images of fluorescent beads at a depth of 3mm, which was limited mainly by the objective working distance.
To verify the capability of our imaging system to resolve fluorescent objects inside a turbid media, we performed imaging of samples containing 15μm diameter fluorescent beads and CHO-K1-GFP cells embedded in a turbid gel. Cell solutions were sealed in ~150μm diameter glass capillaries and then embedded in the turbid gel at various depths. Figure 4 shows images of x-y- and x-z-scans of 15μm fluorescent sphere and images of CHO-K1-GFP cells in the turbid gel at 1mm depth. As shown in figure, the detector allows to image fluorescent objects inside a turbid gel at significant depths without loss of resolution.
Figure 4.
Images of 15μm fluorescent sphere: x-y scan (left), x-z scan (middle) and CHO- K1-GFP cell (right) in turbid gel at 1mm depth.
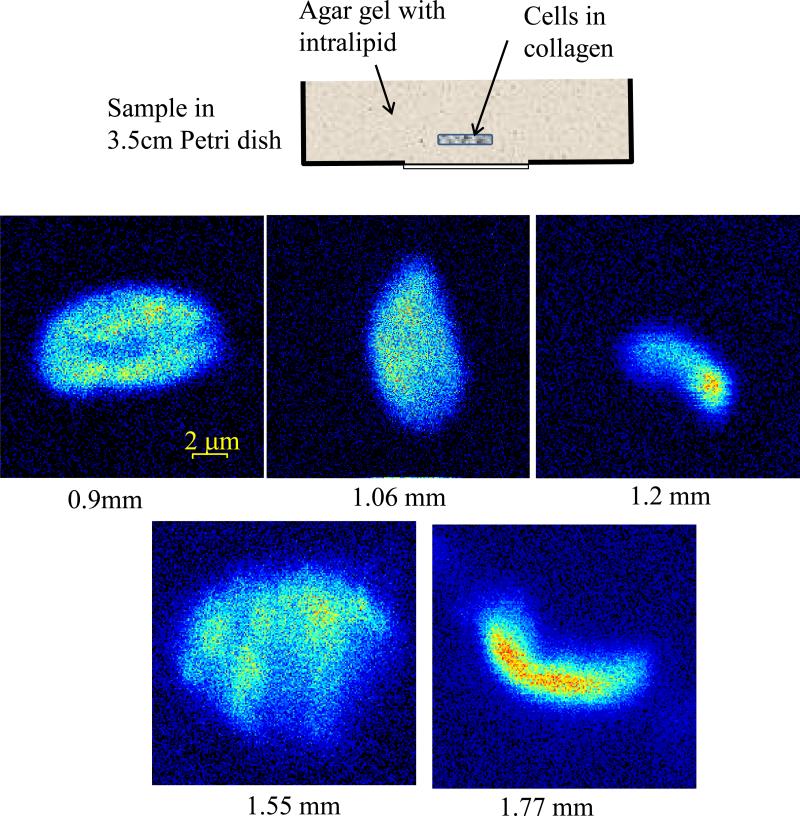
The results on imaging of living cells in turbid gel with optical properties imitating brain tissue are shown in figure 5. In these experiments we have used MDA-MB-231 human breast cancer cells expressed with paxillin-EGFP and suspended in collagen gel. Because of collagen gel samples containing cells were too small in size to take advantage of our detection system, they were enclosed in a bigger size scattering gel and placed in a standard 35mm Petri dish used for imaging with our detector. This surrounding scattering gel was made of agar dissolved in hot PBS solution and then cooled to room temperature to become a gel. The intralipid solution was mixed with the liquid agar solution to induce scattering. The concentration of intralipid was adjusted to 0.3% to make a gel with the reduced scattering coefficient ~7 cm−1[27,28]. As it shown in figure 5, we were able to obtain high resolution images of these living cells inside a turbid gel to a depth of approximately 2 mm.
Figure 5.
Images of MDA-MB-231 human breast cancer cells in scattering gel at various depths.
It should be noted that fluorescence photons, induced at the excitation beam focus, have to travel through about 1cm thickness of strongly scattering media before reaching the sample surface, and yet they are efficiently detected with the presented detection method.
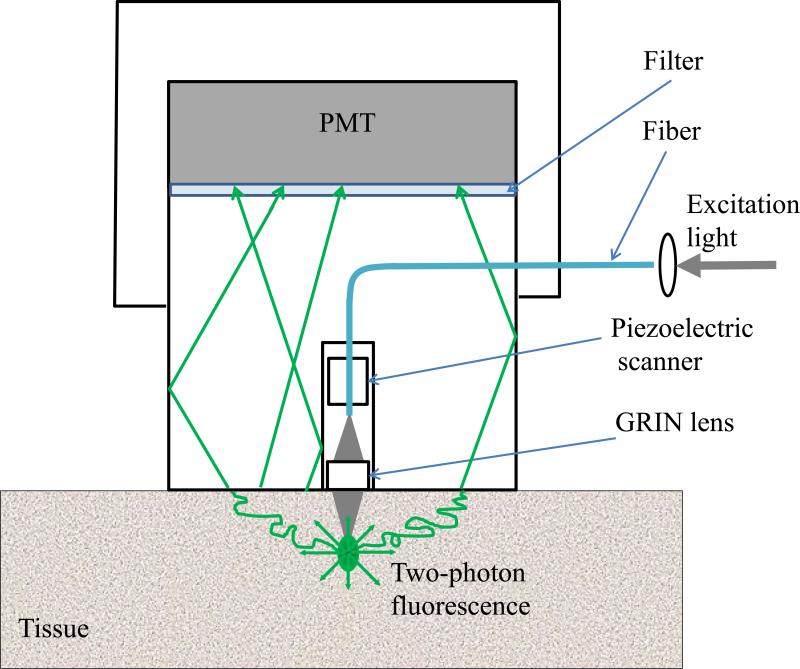
To demonstrate the performance of the detection method, the experimental system utilizes an optical scheme where a two-photon excitation of fluorescence in thick turbid samples is applied to one side of the sample, while the detection of fluorescence is performed on its opposite side. Such schematics are not really suitable for a practical device meant for non-invasive imaging of deep tissue layers. One of the possible optical schemes that combine fluorescence excitation optics with a wide area detector in a single unit can be realized according to the setup shown in figure 6. In this scheme the scanning excitation device, such as a fiber optic scanning two-photon fluorescence endoscope [29,30], can be embedded into the light guiding cylinder of our detector. Because of the small size of this device (just a few millimeters in diameter), it will not significantly prevent fluorescence photons, which are collected from a much wider area, from reaching the photocathode of the detector and decrease its overall sensitivity.
Figure 6.
Optical scheme for imaging from the same side of the sample.
We believe that through the application of the described detection method and after the optimization of the excitation optics and beam parameters, such as pulse duration and energy, wavelength, wave-front profile etc., the imaging of biological tissue in depths of few millimeters will become a reality.
4. Conclusions
In this paper we presented the fluorescence detection method that, in combination with two-photon fluorescence scanning microscope, allows to image fluorescent objects inside tissue-like turbid media with the micron scale resolution. The detector collects photons from the wide (25 mm diameter) area of the sample with minimum photon losses, which makes it exceptionally sensitive to low light levels.
We have demonstrated that by using this detector it is possible to increase imaging depth of turbid samples up to 3 mm, while the best state-of-the-art commercial two-photon fluorescence microscope was able to image the same samples only at a maximum depth of 0.5 mm and the maximum reported imaging depth in similar samples does not exceed 1mm. The imaging depth can be further enhanced by incorporating other methods targeting fluorescence excitation aspects, which are also discussed in the paper.
The detector is simple in construction and can potentially be utilized in devices for noninvasive imaging of few mm deep tissue layers. The experiments on in-depth-imaging of biological tissue samples are now in progress.
Acknowledgements
This work was supported by National Institutes of Health grants: P41-RRO3155, P50-GM076516.
The authors would like to thank Dr. W. Mantulin, Dr. L. Estrada, Chi-Li Chiu, Dr. R. Saager, Dr. A. Cerussi and his group from the Beckman Laser Institute, for technical consulting in samples preparations and for scattering coefficient measurements.
Biography
 Viera Crosignani studied Electrical Engineering at the University of Roma 3, where she earned her Laurea degree in 2004. She earned her Masters of Engineering in Electrical and Computer Engineering in 2005 and a Master of Art in History of Science in 2007 at the University of California San Diego. She worked at the California Institute of Technology in the Biology department in 2008-2009. She is presently pursuing her PhD in Biomedical Engineering at the University of California Irvine in the Laboratory for Fluorescence Dynamics. Her main interest is deep tissue microscopy.
 Alexander S. Dvornikov graduated from the Moscow State University, Russia in 1976 and received his Ph.D. in chemistry in 1983 from the Institute of Chemical Physics Academy of Sciences, Moscow. He joined the research staff of the University of California, Irvine in 1989 and Call/Recall, Inc. in 1995, later as a VP, where he was involved in developing 3D optical memory technology. He joined the LFD in 2009 where he is currently a senior researcher. He has over 100 publications in scientific journals and books and holds several patents.
 Enrico Gratton received his doctorate in physics in 1969 from the University of Rome. In 1986, while a Professor at the University of Illinois at Urbana-Champaign, Dr. Gratton established the first national facility dedicated to fluorescence spectroscopy: the Laboratory for Fluorescence Dynamics (LFD). It is committed to service in a user-oriented facility, as well as to research and development of fluorescence instrumentation and theory. The LFD has reached international recognition for the development of instrumentation for time-resolved fluorescence spectroscopy. In 2006 the LFD moved to its current location at the UCI. Dr. Gratton holds joint appointments as Professor in the UCI departments of BME, Physics and College of Medicine.
Footnotes
V. Crosignani, A. S. Dvornikov, E. Gratton: Enhancement of imaging depth in turbid media using a wide area detector
References
- 1.Denk W, Strickler J, Webb W. Science. 1990;248:78–76. doi: 10.1126/science.2321027. [DOI] [PubMed] [Google Scholar]
- 2.Theer P, Hasan MT, Denk W. Opt. Lett. 2003;28:1022–1024. doi: 10.1364/ol.28.001022. [DOI] [PubMed] [Google Scholar]
- 3.Theer P, Denk W. J. Opt. Soc. Am. A. 2006;23:3139–3149. doi: 10.1364/josaa.23.003139. [DOI] [PubMed] [Google Scholar]
- 4.O'Malley D. Methods Cell Biol. 2008;89:95–128. doi: 10.1016/S0091-679X(08)00605-5. [DOI] [PubMed] [Google Scholar]
- 5.Gu M, Gan X, Kisteman A, Xu MG. Appl. Phys. Lett. 2000;77:1551–1553. [Google Scholar]
- 6.Deng X, Gu M. Appl. Opt. 2003;42:3321–3329. doi: 10.1364/ao.42.003321. [DOI] [PubMed] [Google Scholar]
- 7.Gerritsen HC, De Grauw CJ. Microsc. Res. Tech. 1999;47:206–209. doi: 10.1002/(SICI)1097-0029(19991101)47:3<206::AID-JEMT6>3.0.CO;2-H. [DOI] [PubMed] [Google Scholar]
- 8.Oheim M, Beaurepaire E, Chaigneau E, Mertz J, Charpak S, Neurosci J. Methods. 2001;11:29–37. doi: 10.1016/s0165-0270(01)00438-1. [DOI] [PubMed] [Google Scholar]
- 9.Leray A, Odin C, Le Y. Opt. Commun. 2008;281:6139–6144. [Google Scholar]
- 10.Botcherby EJ, Juskaitis R, Wilson T. Opt. Commun. 2006;268:253–260. [Google Scholar]
- 11.Yaroslavsky AN, Schulze PC, Yaroslavsky IV, Schober R, Ulrich F, Schwarzmaier H-J. Phys. Med. Biol. 2002;47:2059–2073. doi: 10.1088/0031-9155/47/12/305. [DOI] [PubMed] [Google Scholar]
- 12.Masters BR, So PTC, Buehler C, Barry N, Sutin JD, Mantulin WW, Enrico Gratton J. Biomed. Opt. 2004;9(6):1265–1270. doi: 10.1117/1.1806135. [DOI] [PubMed] [Google Scholar]
- 13.Cheong W, Prahl SA, Welch AJ. IEEE J. Quantum Electron. 1990;26:2166–2185. [Google Scholar]
- 14.Tang S, Krasieva TB, Chen Z, Tempea G, Tromberg BJ. J. Biomed. Opt. 2006;11:020501–1-3. doi: 10.1117/1.2177676. [DOI] [PubMed] [Google Scholar]
- 15.Dunn AK, Wallace VP, Coleno M, Berns MW, Tromberg BJ. Appl. Opt. 2000;39:1194–1201. doi: 10.1364/ao.39.001194. [DOI] [PubMed] [Google Scholar]
- 16.Kobat D, Durst ME, Nishimura N, Wong AW, Schaffer CB, Xu C. Opt. Express. 2009;17:13354–13364. doi: 10.1364/oe.17.013354. [DOI] [PubMed] [Google Scholar]
- 17.Cicchi R, Pavone FS. Opt. Express. 2005;13:2337–2344. doi: 10.1364/opex.13.002337. [DOI] [PubMed] [Google Scholar]
- 18.Ji N, Milkie DE, Betzig E. Nat. Methods. 2010;7:141–147. doi: 10.1038/nmeth.1411. [DOI] [PubMed] [Google Scholar]
- 19.Watson BO, Nikolenko V, Yuste R. Front. Neural Circuits. 2009;3:1–11. doi: 10.3389/neuro.04.006.2009. [DOI] [PMC free article] [PubMed] [Google Scholar]
- 20.Cha JW, Ballesta J, So PTC. J. Biomed. Opt. 2010;15(4):046022–1-10. doi: 10.1117/1.3475954. [DOI] [PMC free article] [PubMed] [Google Scholar]
- 21.Combs CA, Smirnov AV, Riley JD, Gandjbakhche AH, Knutson JR, Balaban RS, Microsc J. 2007;228:330–337. doi: 10.1111/j.1365-2818.2007.01851.x. [DOI] [PubMed] [Google Scholar]
- 22.Combs CA, Smirnov A, Chess D, McGavern DB, Schroeder JL, Riley J, Kang SS, Lugar-Hammer M, Gandjbakhche A, Knutson JR, Balaban RS. J. Microsc. 2010 Jun 21; doi: 10.1111/j.1365-2818.2010.03411.x. doi: 10.1111/j.1365-2818.2010.03411.x. [Epub ahead of print] [DOI] [PMC free article] [PubMed] [Google Scholar]
- 23.Flusberg BA, Cocker ED, Piyawattanametha W, Jung JC, Cheung ELM, Schnitzer MJ. Nat. Methods. 2005;2:941–950. doi: 10.1038/nmeth820. [DOI] [PMC free article] [PubMed] [Google Scholar]
- 24.Engelbrecht CJ, Göbel1 W, Helmchen F. Opt. Express. 2009;17:6421–6435. doi: 10.1364/oe.17.006421. [DOI] [PubMed] [Google Scholar]
- 25.Chia TH, Levene MJ. J. Neurophysiol. 2009;102:1310–1314. doi: 10.1152/jn.91208.2008. [DOI] [PubMed] [Google Scholar]
- 26.Ayers F, Grant A, Kuo D, Cuccia DJ, Durkin AJ. Proc. 2008;SPIE 6870:687007–1-9. [Google Scholar]
- 27.Flock ST, Jacques SL, Wilson BC, Star WM, van Gemert MJC. Lasers Surg. Med. 1992;12:510–519. doi: 10.1002/lsm.1900120510. [DOI] [PubMed] [Google Scholar]
- 28.Kodach V, Bosschaart N, Kalkman J, van Leeuwen TG, Faber DJ. Biomedical Optics, OSA Technical Digest (Optical Society of America. 2010:BSuD11. [Google Scholar]
- 29.Myaing MT, MacDonald DJ, Li X. Opt. Lett. 2006;31:1076–1078. doi: 10.1364/ol.31.001076. [DOI] [PubMed] [Google Scholar]
- 30.Le Harzic R, Riemann I, Weinige M, König K, Messerschmidt B. Appl. Opt. 2009;48:3396–3400. doi: 10.1364/ao.48.003396. [DOI] [PubMed] [Google Scholar]


