

Abstract
Objectives
Epidemiologic studies have documented a disproportionate burden of chronic diseases in Appalachia, showing the area to be underserved by the health-care system. Nothing is known about how the health status of the Appalachian population compares with other rural or non-rural populations in the same state. We examined the associations among county type, health insurance category, and health outcomes in poorer adult Ohioans.
Methods
We obtained data from the 2008 Ohio Family Health Survey, a complex landline- and cell phone-based survey of 50,944 noninstitutionalized households. We constructed bivariate analyses examining health status measures across various insurance categories and metropolitan, suburban, rural, and Appalachian counties in Ohio.
Results
Medicaid enrollees living in Appalachian and rural counties tended to be in poorer health and have a greater prevalence of smoking than non-Medicaid enrollees. Within rural and Appalachian regions, Medicaid enrollees were more likely than non-Medicaid enrollees to have lower self-rated health (54.8%, 95% confidence interval [CI] 44.1, 65.5 in rural regions and 52.1%, 95% CI 44.7, 59.5 in Appalachian regions). Appalachian and rural Medicaid enrollees were at an increased likelihood of having several chronic diseases compared with non-Medicaid enrollees.
Conclusion
Our findings suggest that rural and Ohio Appalachian Medicaid enrollees were more likely to have hypertension, cardiovascular disease, and overall poorer health than non-Medicaid enrollees. These findings have important policy implications for health-care reform, highlighting regional disparities in provider coverage. These underserved regions would need an increase in the provider base to positively impact proposed Medicaid expansion programs.
Regional disparities in health insurance coverage play an important role in determining health use and access patterns.1,2 In particular, preventive services and appropriate treatment may not be equitable for those with public health insurance coverage based on their region of residence.3 Inadequate insurance or lack of health insurance results in increased difficulty receiving medical care and accessing medical services as well as delays in care and poorer quality of care.4–6
In Ohio, an estimated 1.2 million adults are without health insurance, with about 200,000 uninsured in Appalachia.7,8 The southeastern Ohio Appalachian region has been characterized as being more impoverished than the rest of the state, with lower median incomes, poorer infrastructure, fewer health-care providers, and increased barriers to care. Compounding these effects is an overall lower education level, higher unemployment rates, and an increased prevalence of adults engaging in unhealthy behaviors (e.g., tobacco use, poor diet, and risky sexual behaviors). The fact that 20 of the 29 Appalachian counties are considered economically depressed undoubtedly contributes to the increased risk for adverse health outcomes for Ohioans residing in Appalachia.9,10
To date, no study has examined the relationship between health insurance coverage and adverse health outcomes for Appalachian, metropolitan, rural, and suburban residents within the same state. It would be important to identify populations at higher risk for adverse outcomes based on their region of residence and insurance category. With Ohio's recent expansion of Medicaid, these findings could serve as a useful way to highlight underserved and at-risk populations in Ohio.
METHODS
We obtained data for this study from the Health Policy Institute of Ohio's 2008 Ohio Family Health Survey (OFHS).11 The study was a complex landline- and cell phone-based survey of 50,944 noninstitutionalized households, collecting information on demographics, socioeconomic status (SES), insurance coverage, use of services, and health status. Interviews were conducted with an adult in each household, and information was collected for adults and by proxy for children when available. To generate estimates of the Ohio population, data were weighted based on a stratified sample design of counties and on an oversample of African American, Asian American, and Hispanic adults. The analysis was limited to adults and did not include children, defined as those aged ≤17 years.
The OFHS was designed to collect information on health status variables and health use patterns for the insured/uninsured population of Ohio across county type levels. County types were defined by key characteristics such as population density, industry type, geographic location, and residential type. Counties were grouped to represent suburban, metropolitan, Appalachian, and rural non-Appalachian characteristics, as defined in 2008 by the U.S. Census and Section 403 of the U.S. code (Figure 1).12,13 The survey was a follow-up to the 1998 and 2004 OFHSs; however, the survey's cross-sectional nature did not allow for the inclusion of survey samples from previous years.
Figure 1.
Regional map of Ohioa, classified according to the U.S. Census and Section 403 of the U.S. Code, 2008
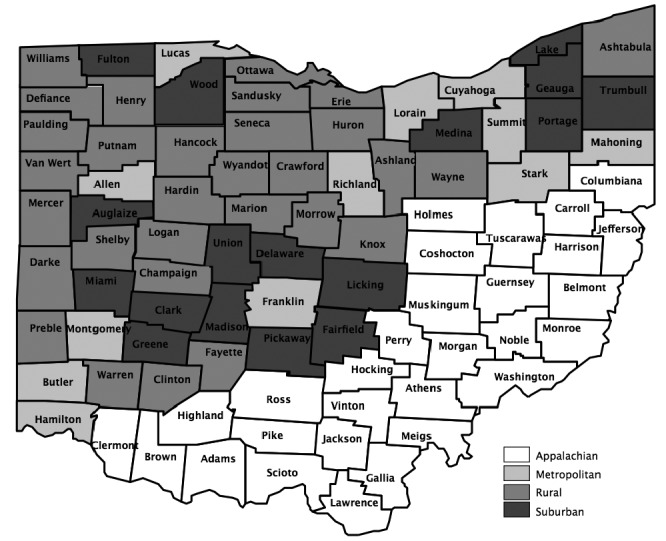
aOhio Family Health Survey regions are classified as Appalachian, metropolitan, rural, and suburban counties.
To evaluate the differences among those with Medicaid, private insurance, or no insurance, we constructed summary tables. Health outcome variables included heart disease and hypertension as well as selected risk factors. We constructed initial summary tables to examine health status measures across the various insurance categories. To standardize comparisons, we limited analyses to 90% of the 2007 federal poverty level (FPL). Results were presented as cross-tabulations between insurance coverage and the variable of interest. In addition, regional variations were also accounted for within these tables.
Study sample
We limited the analysis to adults aged 18–64 years. Individuals enrolled in both Medicare and Medicaid were excluded from the analyses, as Medicare would be their primary insurance provider.
Analytical variables
Insurance coverage categories.
We defined four types of insurance coverage categories for this study: Medicaid, private insurance, uninsured, and noncontinuous coverage. All groups were continuously enrolled unless otherwise specified.
The Medicaid category included three subgroups: Healthy Start/Healthy Families (HS/HF); Aged, Blind, and Disabled (ABD); and other Medicaid. The HS/HF Medicaid category was defined as adults enrolled in the HS/HF program for the past year. Eligibility criteria for this category were families with children whose income was up to 200% FPL or pregnant women with an income up to 200% FPL. Those aged 18–20 years were considered HS/HF eligible.
The ABD Medicaid category was defined as adults requiring long-term care, such as a need for day-to-day assistance, special therapies, personal care, domestic care, and/or social and emotional care. Dual Medicare/Medicaid-eligible individuals were not included in this category. The other Medicaid category was defined as individuals enrolled in Medicaid who did not fall into the previous categories. We defined the private insurance category as adults covered by job-based insurance, directly purchased insurance, or some other type of nongovernmental insurance. Adults covered by their spouse's insurance, either privately purchased or job-based insurance, were also included in this category. The uninsured category was defined as adults who indicated they were not enrolled in any insurance coverage program for at least one week prior to being interviewed. Those with noncontinuous coverage were defined as adults who had no coverage for part of the previous year or who switched between insurance categories (e.g., from Medicaid to private insurance).
Health variables.
We assessed overall health by asking respondents to rate their health status from excellent to poor, with “good to excellent” defined as being in good health and “poor to fair” defined as not being in good health. We identified diseases by asking the participants, “Has a doctor or nurse ever told you that you have…” for particular conditions. In this study, we focused on hypertension and coronary heart disease. In addition to examining health status variables, we assessed risk factors (e.g., current or history of smoking and obesity) and comorbidity variables (e.g., diabetes and hypertension). Demographic variables included age, sex, race/ethnicity, education, employment status, and county type.
RESULTS
Demographic characteristics are presented in Table 1. Overall, the respondents tended to be female (57.2%) and had a mean age of 35.8 years. Approximately -one-quarter (25.5%) of respondents were African American and nearly one-third of respondents (29.2%) had less than a high school education. As shown in Table 2, individuals with private (84.9%) and no (68.8%) insurance coverage tended to be in better health than those in other insurance categories, rating themselves as being in either good or excellent health. Of those enrolled in Medicaid and with noncontinuous coverage, only 61.3% of respondents in each group reported being in good health. Hypertension was more prevalent in Medicaid enrollees (33.5%) than in those listing other insurance categories (range: 21.6%–31.3%). Risk factors such as obesity were greater in the Medicaid group (40.0%) and those with noncontinuous coverage (33.6%) than in other insurance groups. Medicaid enrollees (52.9%), those with noncontinuous coverage (45.8%), and the uninsured (48.1%) were more likely to be current smokers than those with private insurance (28.3%).
Table 1.
Demographic and socioeconomic characteristics of adult Ohioans,a by insurance status: Ohio Family Health Survey, 2008b
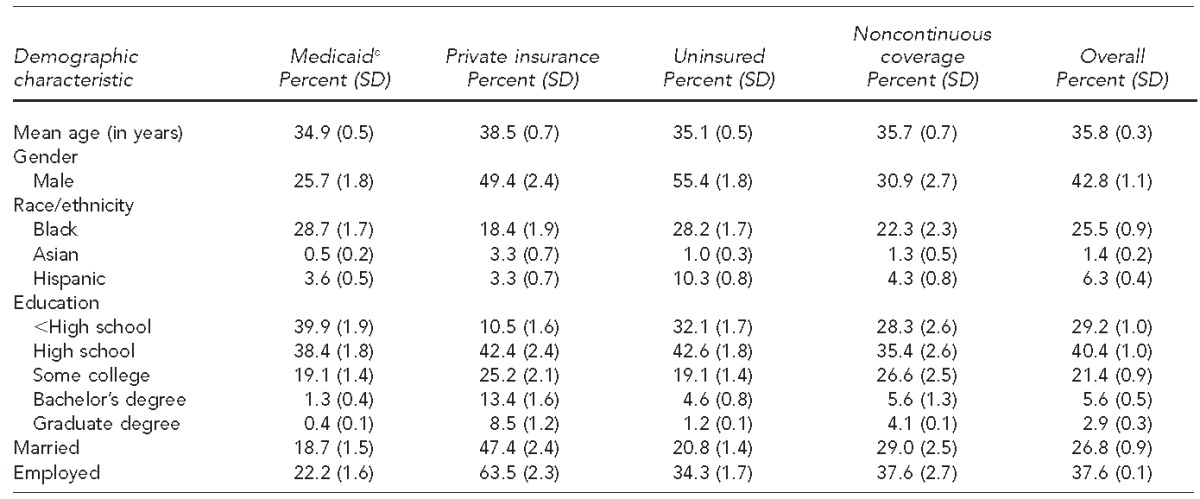
Adult Ohioans were defined as respondents aged 18–64 years.
Analysis was restricted to individuals at 90% of the federal poverty level.
cIncludes Healthy Start/Healthy Families; Aged, Blind, and Disabled; and other Medicaid insurance categories
SD = standard deviation
Table 2.
Prevalence of self-reported good health status, hypertension, coronary heart disease, diabetes, obesity, and current smoking among adult Ohioans,a by insurance status: Ohio Family Health Survey, 2008b
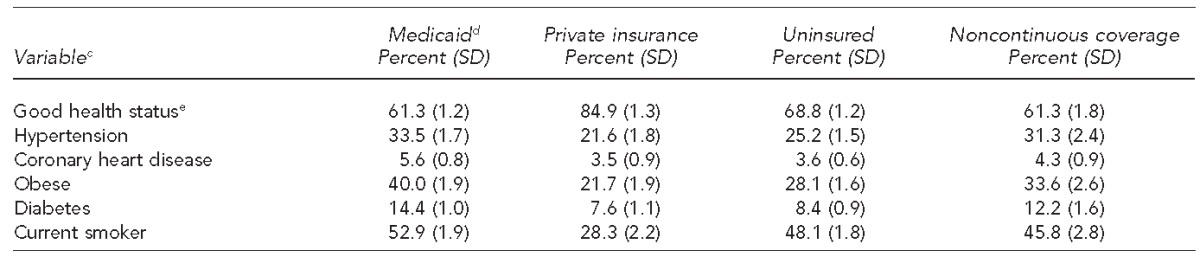
Adult Ohioans were defined as respondents aged 18–64 years.
Analysis was restricted to individuals at 90% of the federal poverty level.
cDefined as binary yes/no variables
dIncludes Healthy Start/Healthy Families; Aged, Blind, and Disabled; and other Medicaid insurance categories
eGood health status rating was defined as a binary yes/no variable, with respondents who answered good, very good, or excellent defined as being in good health and those answering poor to fair defined as not being in good health.
SD = standard deviation
Good health status by county type classifications
To examine whether health disparities varied by geography for Medicaid and non-Medicaid populations, we constructed summary tables by county type, examining specific health variables by insurance type. Within each county type, Medicaid enrollees reported lower health ratings, with the lowest percentage observed among Appalachians (52.1%, 95% confidence interval [CI] 44.7, 59.5), followed closely by rural residents (54.8%, 95% CI 44.1, 65.5). The uninsured had higher self-reported health ratings than those with noncontinuous coverage across all county types, whereas those who were privately insured reported the highest health ratings (Table 3).
Table 3.
Prevalence of self-reported good health status, hypertension, coronary heart disease, diabetes, obesity, and current smoking among adult Ohioans,a by insurance status and county type classification: Ohio Family Health Survey, 2008b
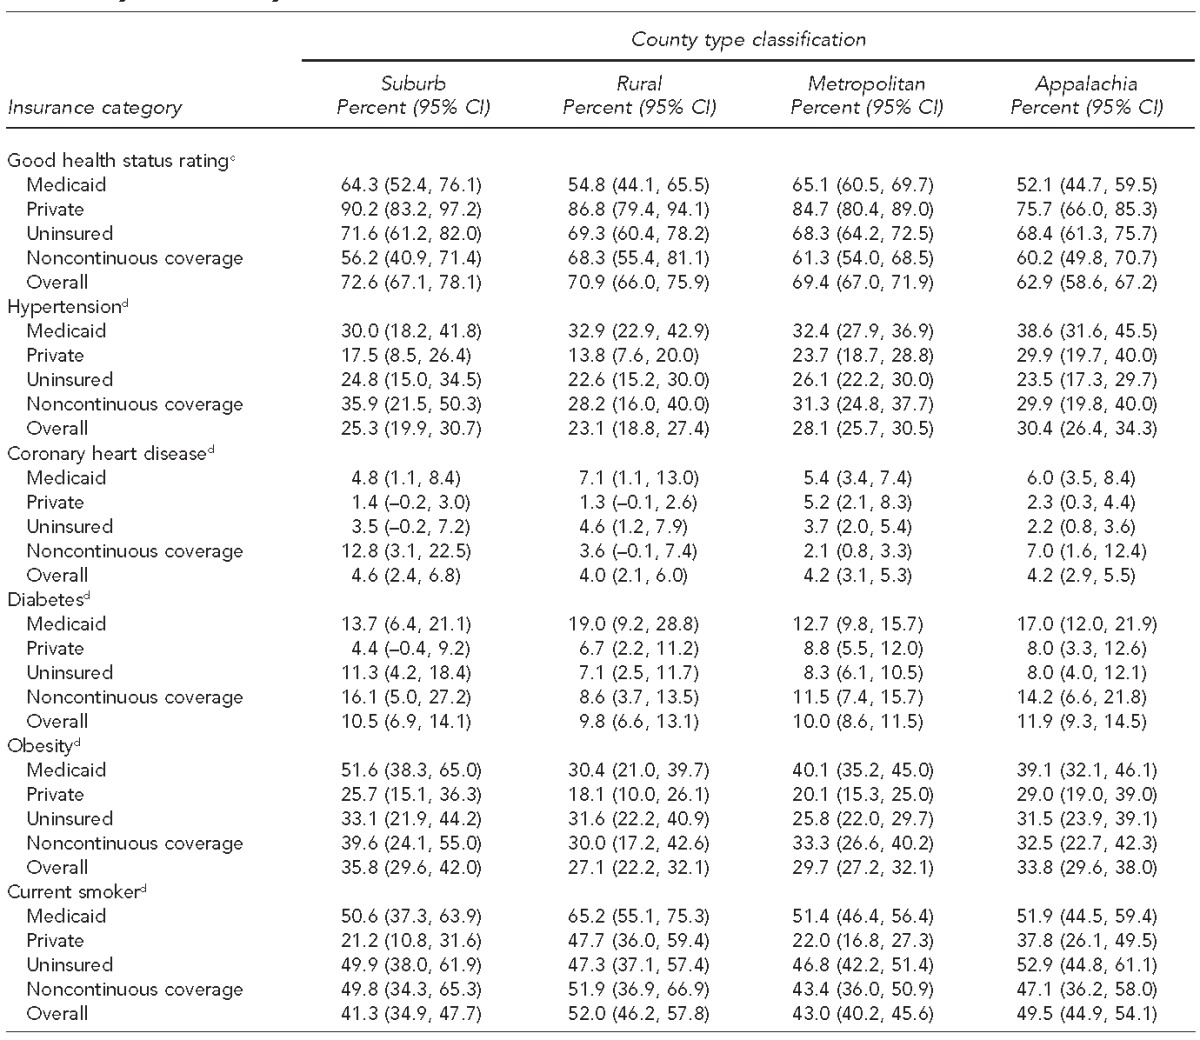
Adult Ohioans were defined as respondents aged 18–64 years.
Analysis restricted to individuals at 90% of the federal poverty level.
cGood health status rating was defined as a binary yes/no variable, with respondents who answered good, very good, or excellent defined as being in good health and those answering poor to fair defined as not being in good health.
dDefined as binary yes/no variables
CI = confidence interval
Disease variables
Appalachians were more likely than non-Appalachians to be hypertensive (30.4%, 95% CI 26.4, 34.3); among them, Medicaid enrollees reported the largest percentage of individuals with hypertension (38.6%, 95% CI 31.6, 45.5). Rural (23.1%, 95% CI 18.8, 27.4) and suburban (25.3%, 95% CI 19.9, 30.7) residents were less likely to have hypertension than those in metropolitan or Appalachian counties. Among suburban and rural residents, those with private insurance coverage were less likely to be hypertensive (suburban: 17.5%, 95% CI 8.5, 26.4; rural: 13.8%, 95% CI 7.6, 20.0) than those in other insurance categories (Table 3).
In the case of coronary heart disease, percentages were relatively similar among the four different county types. Individuals living in suburban areas were slightly more likely than those in metropolitan, suburban, or Appalachian areas to have coronary heart disease (4.6%, 95% CI 2.4, 6.8). Among suburban residents, individuals with non-continuous coverage were more likely than those in other insurance groups to report having coronary heart disease (12.8%, 95% CI 3.1, 22.5) (Table 3).
Diabetes was most prevalent in Appalachian residents (11.9%, 95% CI 9.3, 14.5), and, among them, Medicaid enrollees reported a high prevalence of diabetes (17.0%, 95% CI 12.0, 21.9%). Although the lowest overall percentage of diabetes was observed among rural residents (9.8%, 95% CI 6.6, 13.1), Medicaid enrollees in rural counties had the highest proportion of diabetes (19.0%, 95% CI 9.2, 28.8) (Table 3).
Risk factors
Obesity was prevalent across all insurance categories. Obesity percentages were highest among Appalachian (33.8%, 95% CI 29.6, 38.0) and suburban (35.8%, 95% CI 29.6, 42.0) residents. Medicaid enrollees in suburban county types were more likely than non-Medicaid enrollees to be obese (51.6%, 95% CI 38.3, 65.0). Across all county types, the privately insured were the least likely to be obese, with the lowest likelihood found among those residing in rural areas (18.1%, 95% CI 10.0, 26.1) (Table 3).
Smoking was common in Appalachia and rural counties, with nearly half of Appalachians reporting being smokers (49.5%, 95% CI 44.9, 54.1). Across several county types, Medicaid enrollees were the most likely to be smokers, with percentages as high as 65.2% (95% CI 55.1, 75.3) in rural counties. Those who were privately insured reported the lowest percentage of smoking with the lowest observed proportion in suburban residents (21.2%, 95% CI 10.8, 31.6). With the exception of the privately insured, within each county type, all insurance categories had smoking percentages of ≥40% (Table 3).
DISCUSSION
Findings from the survey showed that the distribution of health outcomes was not uniform across the different insurance categories. Analyses revealed that more than 80% of adults with private insurance were in good health compared with nearly 70% of uninsured adults and 60% of Medicaid enrollees. These findings support existing studies indicating that lower-income adult Medicaid populations are more likely to be in poorer health than either the uninsured or those with private insurance.14 Specifically, enrollment in Medicaid is often linked to rules that expand eligibility requirements for the disabled and medically needy.15 If the unhealthy are enrolled by their health-care providers in Medicaid, leaving the healthy but Medicaid eligible without insurance, we should expect Medicaid adults to have overall lower health status. This phenomenon reflects a selection bias, as sick individuals who previously may have been uninsured are now qualified for supplemental security income and, thus, for Medicaid. Interestingly, the results also suggest that having noncontinuous coverage or interruptions in health-care coverage could be associated with poorer health status. Like the uninsured, having noncontinuous coverage could translate to increased barriers to care, delays in receiving treatment, and inability to obtain treatment due to cost.16
To reduce the effect of confounding due to the low SES of the Medicaid population, analyses were limited to individuals at 90% FPL—the Ohio financial qualifying limit for Medicaid eligibility. For this impoverished group, private insurance was again associated with positive health outcomes. These results are not surprising given the fact that most adults obtain their private insurance through their employers, implying that these individuals are healthy enough to work. Medicaid enrollees were found to have a greater likelihood of reporting hypertension and heart disease, possibly due to poorer health prior to enrolling in Medicaid. The uninsured were in no worse health than those on Medicaid but reported poorer health outcomes than those with noncontinuous coverage. Typically, the uninsured are the least likely to use preventive care services.17 Factors such as lack of coverage and cost are important reasons uninsured low-income individuals cite for not receiving necessary medical care.18
A more notable finding from the analyses, however, was the importance of county type and insurance category on health status. In the county type analyses, Medicaid enrollees from Appalachian and rural -counties tended to have a greater percentage of respondents with poorer overall health, hypertension, diabetes, and heart disease. Additionally, smoking proportions were highest among Medicaid enrollees, with high percentages observed for Medicaid enrollees living in Appalachian and rural counties. These findings reinforce the results of other studies: Appalachian residents often characterized by lower income and limited education are at an increased risk for health problems.19,20 Our results contribute to the literature by suggesting that, even with similar public health coverage, Medicaid enrollees in rural and Appalachian counties are more likely to report poorer health outcomes, specifically as related to hypertension, diabetes, and cardiovascular disease, than Medicaid enrollees in other regions. Medicaid enrollees in Appalachian and rural counties may experience more barriers to care due to fewer primary care providers and geographic isolation, causing them to have to travel long distances for care.21
Although studies have demonstrated Medicaid's effectiveness in reducing the health services use gap between the publicly and privately insured (e.g., having a usual source of care and the number of physician visits), disparities in access to care persist, particularly with respect to the inability to receive care.22–24 Medicaid's low payment rates to providers may limit beneficiaries' choice of providers.25 In addition, the presence of fewer specialists in rural or isolated regions may compound difficulties in reaching an already limited number of primary care physicians.26,27 In areas such as rural and Appalachian Ohio counties, fewer primary care providers per capita could translate into greater barriers to care, particularly among an already vulnerable population (Figure 2).
Figure 2.
Ranking of Ohio counties by access to care, 2008a
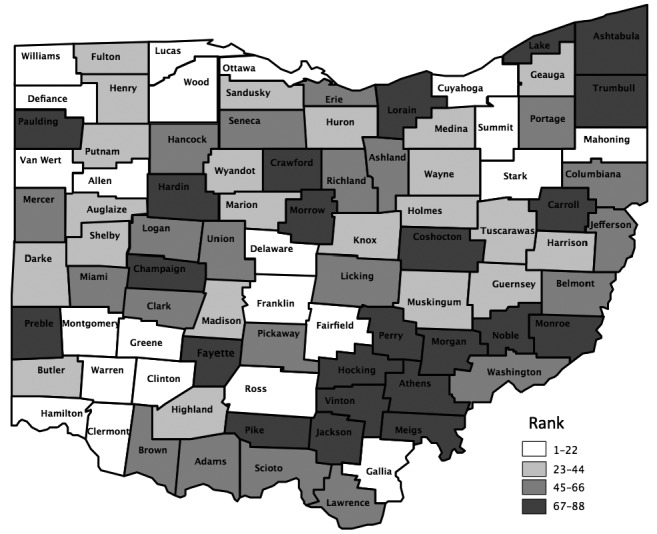
aRanking of access to care is based on the ratio of primary care physicians to the population at the county level. Sources: County Health Rankings and Roadmaps: University of Wisconsin Population Health Institute and the Robert Wood Johnson Foundation
Limitations
This study was subject to several limitations. For one, because our analysis was cross-sectional, focusing on survey results from 2008 only, we failed to take into account baseline health and relied instead on health status reported at the time of the survey. A more appropriate analysis would have examined improvement in health as a result of health insurance coverage. Health data collected during several years could have attenuated selection bias, as it would have allowed for the adjustment of health status before the start of insurance coverage. Furthermore, because health insurance selection was nonrandom, endogeneity bias was a possibility. Some researchers have argued that only randomized trials can provide information on the causal relationship between health insurance and health status.3 Although we tried to minimize confounding due to low SES by restricting our sample to 90% FPL, this restriction was based only on income and did not reflect assets, education level, or employment status. To better control for the effect of low SES on our results, the construction of an SES index variable may have been more appropriate.
Another limitation of our study was that health outcomes were based on self-reports rather than actual medical examinations. The self-report was dependent on whether or not the respondent saw a physician and his/her personal health status assessment. Such self-reported measures could have biased the results, as respondents may not have accurately reported their health status, either due to infrequent doctor visits or, possibly, self-diagnosis.
CONCLUSION
The majority of Appalachian residents at 90% FPL are enrolled in Medicaid. However, their health status on average is worse than Medicaid enrollees in either suburban or metropolitan counties. These findings raise the possibilities of more entrenched demographic difficulties and a limited provider network in Appalachia and rural areas compared with other regions. Medicaid expansion in these underserved counties could encounter shortages of participating providers; policies aimed at increasing health insurance coverage should also attempt to increase the region's primary care provider base.
Health-care reform is expanding Medicaid eligibility up to 133% FPL. This expansion will be very important for low-income rural populations. Medicaid expansion would reduce economic barriers to care but, in itself, may not be a sufficient enough method for improving overall health status for this low-income rural population. Other factors such as additional primary care providers, better access to care, and increased availability of services are also necessary for the improvement of health for this at-risk population. Expanding Medicaid without addressing these factors could stress an already strained system in rural areas of the United States.
Footnotes
The study was approved by the Institutional Review Board of The Ohio State University.
REFERENCES
- 1.Levy H, Meltzer D. What do we really know about whether health insurance affects health? In: McLaughlin CG, editor. Health policy and the uninsured. Washington: Urban Institute Press; 2004. pp. 179–204. [Google Scholar]
- 2.Pickle LW, Su Y. Within-state geographic patterns of health insurance coverage and health risk factors in the United States. Am J Prev Med. 2002;22:75–83. doi: 10.1016/s0749-3797(01)00402-0. [DOI] [PubMed] [Google Scholar]
- 3.Quesnel-Vallee A. Is it really worse to have public health insurance than to have no insurance at all? Health insurance and adult health in the United States. J Health Soc Behav. 2004;45:376–92. doi: 10.1177/002214650404500402. [DOI] [PubMed] [Google Scholar]
- 4.McWilliams JM. Health consequences of uninsurance among adults in the United States: recent evidence and implications. Milbank Q. 2009;87:443–94. doi: 10.1111/j.1468-0009.2009.00564.x. [DOI] [PMC free article] [PubMed] [Google Scholar]
- 5.Sudano JJ, Jr, Baker DW. Intermittent lack of health insurance coverage and use of preventive services. Am J Public Health. 2003;93:130–7. doi: 10.2105/ajph.93.1.130. [DOI] [PMC free article] [PubMed] [Google Scholar]
- 6.Asch SM, Kerr EA, Keesey J, Adams JL, Setodji CM, Malik S, et al. Who is at greatest risk for receiving poor-quality health care? N Engl J Med. 2006;354:1147–56. doi: 10.1056/NEJMsa044464. [DOI] [PubMed] [Google Scholar]
- 7.Health Policy Institute of Ohio. Ohio Family Health Survey: 2008 summary of initial findings. 2009. [cited 2014 Sep 18]. Available from: URL: http://www.shadac.org/files/OH_2008_HH_SummFindings.pdf.
- 8.Ohio Deparment of Health. Ohio primary care—health professional shortage areas (HPSAs) [cited 2014 Sep 18] Available from: URL: http://www.odh.ohio.gov/odhprograms/chss/pcrh_programs/primary_care/hpsa.aspx.
- 9.Wewers ME, Katz M, Paskett ED, Fickle D. Risky behaviors among Ohio Appalachian adults. Prev Chronic Dis. 2006;3:A127. [PMC free article] [PubMed] [Google Scholar]
- 10.Wewers ME, Ahijevych KL, Chen MS, Dresbach S, Kihm KE, Kuun PA. Tobacco use characteristics among rural Ohio Appachians. J Community Health. 2000;25:377–88. doi: 10.1023/a:1005127917122. [DOI] [PubMed] [Google Scholar]
- 11.State of Ohio, Department of Insurance, Department of Job and Family Services, Department of Health, and Department of Mental Health. Ohio Family Health Survey, 2008. Columbus (OH): Ohio State University, Ohio Colleges of Medicine Government Resource Center; 2009. [Google Scholar]
- 12.Census Bureau (US) 1990 urban and rural classification. 1990. [cited 2014 Sep 18]. Available from: URL: https://www.census.gov/geo/reference/urban-rural.html.
- 13. Title 40 U.S.C §403 (2006)
- 14.Kaiser Commission on Medicaid and the Uninsured. What is Medicaid's impact on access to care, health outcomes, and quality of care? Setting the record straight on the evidence. 2013. [cited 2014 Sep 18]. Available from: URL: http://kaiserfamilyfoundation.files.wordpress.com/2013/08/8467-what-is-medicaids-impact-on-access-to-care1.pdf.
- 15.Kaiser Commission on Medicaid and the Uninsured. The role of Medicaid for adults with chronic illnesses. 2012. [cited 2014 Sep 18]. Available from: URL: http://kaiserfamilyfoundation.files.wordpress.com/2013/01/8383.pdf.
- 16.Kasper JD, Giovannini TA, Hoffman C. Gaining and losing health insurance: strengthening the evidence for effects on access to care and health outcomes. Med Care Res Rev. 2000;57:298–318. doi: 10.1177/107755870005700302. [DOI] [PubMed] [Google Scholar]
- 17.Decker SL, Kostova D, Kenney GM, Long SK. Health status, risk factors, and medical conditions among persons enrolled in Medicaid vs uninsured low-income adults potentially eligible for Medicaid under the Affordable Care Act. JAMA. 2013;309:2579–81. doi: 10.1001/jama.2013.7106. [DOI] [PubMed] [Google Scholar]
- 18.DeVoe JE, Baez A, Angier H, Krois L, Edlund C, Carney PA. -Insurance + access = health care: typology of barriers to health care access for low-income families. Ann Fam Med. 2007;5:511–8. doi: 10.1370/afm.748. [DOI] [PMC free article] [PubMed] [Google Scholar]
- 19.Behringer B, Friedell GH. Appalachia: where place matters in health. Prev Chronic Dis. 2006;3:A113. [PMC free article] [PubMed] [Google Scholar]
- 20.Wingo PA, Tucker TC, Jamison PM, Martin H, McLaughlin C, Bayakly R, et al. Cancer in Appalachia, 2001–2003. Cancer. 2008;112:181–92. doi: 10.1002/cncr.23132. [DOI] [PubMed] [Google Scholar]
- 21.Baldwin FD. Access to care: overcoming the rural physician shortage. Appalachia. 1999;32:8–15. [Google Scholar]
- 22.Berk ML, Schur CL. Access to care: how much difference does Medicaid make? Health Aff (Millwood) 1998;17:169–80. doi: 10.1377/hlthaff.17.3.169. [DOI] [PubMed] [Google Scholar]
- 23.Coughlin TA, Long SK, Clemans-Cope L, Resnick D. Menlo Park (CA): Kaiser Commission on Medicaid and the Uninsured; 2013. What difference does Medicaid make? Assessing cost effectiveness, access, and financial protection under Medicaid for low-income adults. Also available from: URL: http://kaiserfamilyfoundation.files.wordpress.com/2013/05/8440-what-difference-does-medicaid-make2.pdf [cited 2014 Sep 19] [Google Scholar]
- 24.Long SK, Coughlin T, King J. How well does Medicaid work in improving access to care? Health Serv Res. 2005;40:39–58. doi: 10.1111/j.1475-6773.2005.00341.x. [DOI] [PMC free article] [PubMed] [Google Scholar]
- 25.Decker SL. In 2011 nearly one-third of physicians said they would not accept new Medicaid patients, but rising fees may help. Health Aff (Millwood) 2012;31:1673–9. doi: 10.1377/hlthaff.2012.0294. [DOI] [PMC free article] [PubMed] [Google Scholar]
- 26.Feder J, Levitt L, O'Brien E, Rowland D. Covering the low-income uninsured: the case for expanding public programs. Health Aff (Millwood) 2001;20:27–39. doi: 10.1377/hlthaff.20.1.27. [DOI] [PubMed] [Google Scholar]
- 27.Cook NL, Hicks LS, O'Malley AJ, Keegan T, Guadagnoli E, Landon BE. Access to specialty care and medical services in community health centers. Health Aff (Millwood) 2007;26:1459–68. doi: 10.1377/hlthaff.26.5.1459. [DOI] [PubMed] [Google Scholar]