Abstract
The occurrence of glass delamination is a serious concern for parenteral drug products. Over the past several years, there has been a series of product recalls involving glass delamination in parenteral drugs stored in vials which has led to heightened industry and regulatory scrutiny. In this study, a two-pronged approach was employed to assess the inner surface durability of vials and pre-filled syringes. Non-siliconized syringes were used in order to directly compare glass to glass performance between vials and syringes. The vial and syringe performance was screened with pharmaceutically relevant formulation conditions. The influence of pH, buffer type, ionic strength, and glass type and source was evaluated. In addition, an aggressive but discriminating formulation condition (glutaric acid, pH 11) was used to ascertain the impact of syringe processing. Advanced analytical tools including inductively coupled plasma/mass spectrometry, scanning electron microscopy, atomic force microscopy, and dynamic secondary ion mass spectroscopy showed significant differences in glass performance between vials and syringes. Pre-filled syringes outperform vials for most tests and conditions. The manufacturing conditions for vials lead to glass defects, not found in pre-filled syringes, which result in a less chemically resistant surface. The screening methodology presented in this work can be applied to assess suitability of primary containers for specific drug applications.
Key words: borosilicate vials, glass delamination, glass corrosion, hydrolytic resistance, pre-filled syringes
INTRODUCTION
Glass delamination, or the release of glass flakes or lamellae from a glass surface, is a serious issue and unacceptable for the storage and administration of parenteral therapies (1,2). In general, Type I borosilicate glass has a long and successful history as a safe and effective packaging material for pharmaceuticals. However, in the past few years, there has been a significant number of voluntary recalls for various parenteral solutions due to the presence of glass particles or flakes in Type I borosilicate vials (3). The specific reason for this increase in observations of glass delamination is unknown. Nevertheless, there are a number of factors that can contribute to the weakening or deterioration of a glass surface. These have been discussed in the literature in the area of nuclear glasses (4), glass antiquities (5), and more recently for borosilicate vials used for pharmaceutical applications (1,2,6–9). Typically, there are three key factors that can impact pharmaceutical glass durability: (1) different chemistry of the bulk glass (i.e., the sodium, boron, silicon, and aluminum content); (2) the glass processing history, including forming and annealing, sterilization and depyrogenation, and surface treatments; and (3) the formulation in contact with the container during its shelf life.
Several studies have been conducted with vials in recent years to evaluate the impact of these factors. The manufacturing process for the cane and vial can have a significant impact on the chemical durability of the glass surface and affect the size and distribution of surface defects. This has been shown to eventually influence delamination propensity (1). In the same study, the thermal processing history of the glass was evidenced by the chemical composition of the glass at the extreme surface versus that of the bulk glass, where glass receiving more extreme processing profile showed greater alkali enrichment at the surface prior to solution contact (1). It was found that ammonium sulfate surface treatment typically used to reduce surface alkalinity led to a degraded surface structure with extensive pitting (2). Finally, several recent studies have shown that terminal sterilization and certain chemical entities in fill solutions significantly affected glass durability (6,7).
Pre-filled syringes (PFS) are both the storage and the administration device for parenteral therapies, and they continue to increase in popularity due to their convenience, safety, and accuracy of drug delivery (10). As of 2012, the PFS sales reached more than 3 billion units (11). Even though PFS make up a significant percentage of packaging for the parenteral market, there have been no published studies on glass corrosion or delamination with PFS to date, nor have there been any associated recalls for glass PFS to our knowledge.
There are several differences between vials and PFS that could contribute to significant differences in glass performance. Firstly, there are two different categories of Type I borosilicate glass, commonly referred to as Type IA and Type IB. These two types differ in bulk glass chemistry and also in thermal coefficient of expansion. Vials are commonly made of both Type IA and IB borosilicate glass. Most PFS, on the other hand, are made of Type IB glass due to its ease of transformation, allowing for lower manufacturing temperatures. Secondly, there are marked differences in the manufacturing processes of vials and PFS. For tubing vials, heat is applied to cut and part the glass cane, then to tool the neck, and finally to form and polish the bottom. The most extreme heat is used for forming the vial bottom, and previous vial studies have found the region just above the vial bottom to be more susceptible to delamination (2). For PFS, the glass cane are cut via thermal shock, and heat is then applied to fire polish the ends of cut lengths, to form the flange, and then to form the tip. It is expected that the differences in transformation steps and associated heating profiles between vials and syringes could lead to significant differences in performance. Thirdly, there may be post-forming treatment differences between vials and PFS, including surface treatments (e.g., ammonium sulfate), sterilization, depyrogenation, and added coatings for chemical resistance (e.g., SiO2 coating) or lubricity (e.g., silicone oil). Finally, it should be noted that by design, the flange end of the PFS has no contact with solution upon filling, while both the neck and bottom regions of vials are potentially exposed, leading to different levels or regions of risk.
Herein, a two-pronged approach is presented to compare the glass durability for vials and non-siliconized PFS. The first prong consists of a performance screening with pharmaceutically relevant formulation conditions. A few examples of marketed formulations in Type I borosilicate vials and syringes are listed in Table I for perspective. The second prong includes a comparison of PFS and vial performance using an aggressive but discriminating formulation. The goal of this study is to identify which physico-chemical properties are responsible for delamination and understand contributions of glass chemistry and processing on glass durability. This is made possible through comparison of vials and PFS formed from the same tubing glass chemistry, comparison of PFS made from different tubing sources, and comparison of surfaces of these different glasses both before and after solution contact. Using tools such as dynamic secondary ion mass spectroscopy (D-SIMS), inductively coupled plasma/mass spectrometry (ICP/MS), pH, methylene blue staining, scanning electron microscopy (SEM), and atomic force microscopy (AFM), surface chemistry as a function of depth before and after solution contact, released chemical profiles, pH shift, and surface morphology are able to be determined.
Table I.
Example Parenteral Formulations Marketed in PFS and Vials
| Drug | Generic name | Buffer | pH | Container |
|---|---|---|---|---|
| Neulasta | Pegfilgrastim | Acetate | 4.0 | PFS |
| Humira | Adalimumab | Phosphate, citrate | 5.2 | PFS |
| Avastin | Bevacizumab | Phosphate | 6.2 | Vial |
| Enbrel | Etanercept | Phosphate | 6.3 | PFS |
| Rituxan | Rituximab | Citrate | 6.5 | Vial |
| Epogen | Epoetin alfa | Citrate or citrate, phosphate | 6.1 or 6.9 | Vial |
| Bacteriostatic water | Bacteriostatic water for injection | N/A | 4.5–7.0 | Vial |
| Acetadote | Acetylcysteine injection | N/A | 6.0–7.5 | Vial |
| Sodium bicarbonate | Sodium bicarbonate 5% injection | Carbonate | 7.0–8.5 | Vial |
MATERIALS AND METHODS
Reagents
Sodium citrate, sodium phosphate monobasic, sodium phosphate dibasic, Tris, sodium acetate, sodium chloride, potassium hydroxide, methylene blue, glutaric acid, and 1 N hydrochloric acid were all obtained from Sigma. The 0.01 N hydrochloric acid was purchased from Aqua solutions, and methyl red solution was obtained from Ricca Chemical Company. WFI was obtained from Hyclone. Sodium hydroxide was from J.T. Baker.
Componentry
For the formulation study, the 1-mL-long PFS were processed through washing and sterilization steps and were prepared with no silicone oil and no through-hole (i.e., no opening for needle). For the glutaric acid study, 1-mL-long PFS, including the PFS at different steps of the forming process, vials (2 mL) from Vendor A, and vials (6 mL) from Vendor B were evaluated. All the PFS investigated in this study were made of Type IB glass. West FluroTec® W4023/50 stoppers (BD, cat# 47271919) were used to seal the PFS, and West FluroTec® W4023/50 stoppers were used to seal vials after filling in order to minimize the possibility of interfering leachables from the stopper into the formulations.
Study Design
Formulation Study
The formulation screening study was conducted to investigate the impact of pH, buffer type, salt, and glass type and source on glass durability. As listed in Fig. 1a, two types of PFS and five types of vials from two cane sources were evaluated. Buffers (50 mM) including acetate, citrate, phosphate, and Tris were selected to cover a pH range from 4.5 to 8.5. None or 0.9% NaCl was added to the buffers to investigate the impact of salt on glass durability. Other solutions/controls assessed include water for injection (WFI), 0.9% NaCl, 0.1 N NaOH, and 0.1 N KOH. The filling volume was 1 mL/syringe with a surface area to volume ratio (SA/V) of 6.7 cm−1 and 2 mL/vial with a SA/V of 3.9 cm−1. Two different sample treatments and study durations were utilized in order to produce predictive results and make the most use of limited vial sample sizes. In order to quickly and directly compare vial and syringe performance, filled syringes and vials were autoclaved for 3 cycles at 121°C with a 30-min dwell and then stored at 40°C/75% relative humidity (RH) for 1 month. PFS performance was further investigated with the same solutions after 1 autoclave cycle at 121°C with a 30-min dwell and over 6 months of storage at 40°C/75% RH. Samples were analyzed at 0, 1, 3, and 6 months.
Fig. 1.
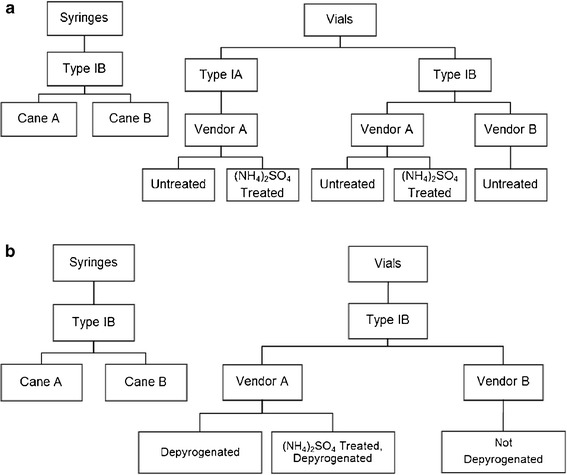
Container selection for the formulation study using 1-mL-long PFS and 2-mL vials (a) and the glutaric acid study using 1-mL-long PFS, 2-mL vials from Vendor A, and 6-mL vials from Vendor B (b)
Glutaric Acid Study
As listed in Fig. 1b, vials and syringes from two cane sources were evaluated. A 10 g/L glutaric acid solution, adjusted to pH 11 with NaOH, was used in order to assess glass performance with an aggressive but discriminating formulation. Glutaric acid solution at high pH has previously been shown to delaminate glass vials under similar conditions (7). These filled containers were stored at 40°C/75% RH for 6 months, and samples were analyzed at 0, 2, and 10 days and 3 and 6 months. Note that the filled containers for this study were not autoclaved.
Hydrolytic Resistance
Hydrolytic resistance was determined for both vials and syringes in their as-received condition. The filling volume was 90% of the brimful capacity for both vials and syringes. The containers were autoclaved for 60 min at 121°C in a table top sterilizer (Steris, Eagle Ten+) and were then titrated using 0.01 N HCl per USP <660> (12).
pH
The pH of the filled solutions was measured prior to filling and after removal from the various configurations at each time point using a standard electronic pH meter (Orion 350, Thermo Scientific). The pH meter was calibrated according to internal standard operating procedures before the measurement.
Methylene Blue Staining
Methylene blue is a cationic dye that interacts with glass surface via ion exchange and has been used historically to study glass corrosion. In this study, vials and syringes were stained with methylene blue and visually examined both as received and after solution contact. The as-received containers were filled with 1.5% methylene blue (2 mL/vial, 1 mL/syringe) and agitated overnight (>8 h) horizontally at 100 rpm (MaxQ 2508, Barnstead Lab-line), and then emptied, thoroughly rinsed with deionized water (DIW), and air-dried prior to visual examination. The filled containers were emptied, rinsed with DIW three times before staining and visual inspection.
ICP/MS
ICP/MS was used to assess the elements released from glass including silicon, boron, and aluminum. The filled solutions for formulation study were analyzed using ICP/MS (Perkin Elmer ELAN DRC-e) using the multielement standards at concentrations of 10, 50, and 100 ppb. The filled solutions for glutaric acid study were analyzed using ICP/MS (Perkin Elmer DRC-e 9000) using standards at concentrations of 10, 15, 25, and 35 ppb to determine the dissolved silicon.
SEM and AFM
To compare the interior surface topography of PFS and vials, the containers were examined using both SEM and AFM. For the formulation study, the containers were emptied, rinsed with DIW, air-dried, and sectioned using a diamond laser band saw (DL3000 XL, Diamond Tech) prior to analysis. The glass pieces from the wall near the vial bottom or syringe tip were cleaned with an air jet to blow off any loose debris and then coated with a very thin layer of gold for SEM (Zeiss SUPRA 55VP) analysis. For the glutaric acid study, vials and PFS were emptied, rinsed with DIW, air-dried, and sectioned using a diamond saw. The glass pieces were cleaned with nitrogen jet before being examined using a FEI QUANTA 400 FEG SEM coupled with a Bruker Quantax 5030 probe. The glass pieces were also analyzed by tapping mode in air by a Veeco Dimension V AFM system.
D-SIMS
To understand the impact of glass chemistry and processing on glass surface compositions, D-SIMS analysis was performed to obtain comparative concentrations of the elements in the glass as a function of glass depth using an Ion Tof V GmbH D-SIMS. The analyzed area is about 100 μm × 100 μm, the center of a larger piece (approximately 350 μm × 350 μm), in order to minimize edge effects.
RESULTS
Hydrolytic Resistance of Incoming Containers
For the USP <660> surface glass test, the volume of 0.01 N HCl required to titrate the container fill solution is inversely related to the hydrolytic resistance of containers. The Type IB vial from Vendor A resulted in the highest volume of titrant, at approximately 66% of the limit, which per 100 mL of test solution is 2.0 mL for containers with up to 1 mL fill volume and 1.8 mL for containers having more than 1 and up to 2 mL fill volume. Since containers of different surface areas and volumes were assessed, results were converted into a per surface area basis for comparison. In increasing order of performance, Type IB vials from Vendor A < Type IB vials from Vendor B < Type IA vials from Vendor A < treated Type IB vials from Vendor A < PFS from Vendor B < treated Type IA vials from Vendor A < PFS from Vendor A. The PFS from both cane sources, at <35% of the USP <660> limit, performed similarly to the ammonium sulfate-treated Type IA and IB vials from Vendor A and outperformed vials made of the same glass type from the same vendor.
pH Shift
As expected, the pH shift for buffered solutions in the formulation study over time was not significant (<0.1 pH units). For the unbuffered WFI and 0.9% NaCl solutions, which are more representative of diluent presentations than typical formulated drug products, significant positive shifts in pH were observed for all containers after 3 autoclave cycles and 1-month storage at 40°C/75% RH. The average pH shift for these unbuffered solutions was 2.0 for vials and 1.2 for PFS. Note that the pH shift was smaller for PFS, even though the surface area to volume ratio for the PFS is greater at 6.7 versus 3.9 cm−1 for the vials. The Type IB vials from both vendors had the largest pH shifts of all the containers for these two solutions. For the NaOH and KOH solutions, a negative pH shift was observed and the pH shift was greatest for Type IA vials (untreated and treated) from Vendor A followed by Type IB vials from Vendor B.
Methylene Blue Staining
Methylene blue staining of containers was performed both as-received and after exposure to different formulations. For as-received samples, Type IA and IB vials from Vendor A exhibited the most staining, followed by Type IB vials from Vendor B. The stained areas were located on the side walls of the vials, starting a few millimeters above the bottom of the vials and extending up toward the shoulder area. Neither of the ammonium sulfate-treated vials nor the PFS were visibly stained for as-received samples. For filled containers, some general trends are apparent. Overall, Type IA vials were stained the most for most conditions, followed by Type IB vials. Ammonium sulfate-treated vials were stained similar as untreated vials for both Type IA and Type IB glasses from Vendor A. PFS did not show any staining for most of the conditions, except for the positive controls. Even for samples stored for 6 months with one cycle of autoclave, PFS displayed, at most, minimal staining with exposure to some of the buffers. It was found that citrate buffer resulted in the least staining in the formulation study. A representative image of methylene blue staining for containers filled with pH 7.5 phosphate plus salt and subjected to 3 autoclave cycles and 1-month storage at 40°C/75% RH is shown in Fig. 2.
Fig. 2.
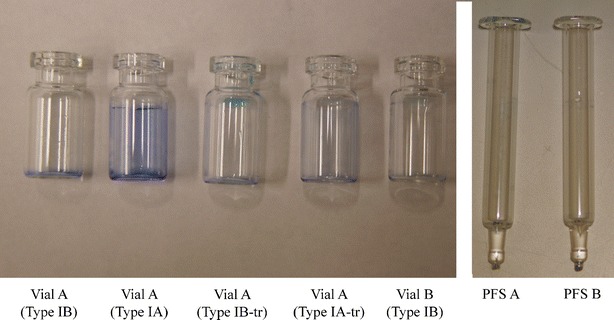
Representative methylene blue staining images of containers filled with pH 7.5 phosphate with NaCl and exposed to 3 autoclave cycles and 1-month storage at 40°C/75% RH
ICP/MS Analyses
Formulation Study
Container corrosion over time was monitored by ICP/MS analysis of the filled solutions. Silicon and boron release for the various configurations stored with select formulations for 1 month at 40°C/75% RH after 3 autoclave cycles is shown in Fig. 3. Among all tested formulations (excluding the positive controls of 0.1 N NaOH and KOH), citrate buffer showed the highest level of silicon release, followed by phosphate buffer. For the formulations inducing the highest silicon release, Type IA vials, ammonium sulfate treated and untreated from Vendor A released the most, followed by Type IB vials from the same vendor. PFS from both Vendor A and B released the least of silicon. For the same type of buffer (phosphate and citrate buffers), higher pH induced higher silicon release, while the ionic strength facilitated the silicon release only in a minimal way.
Fig. 3.
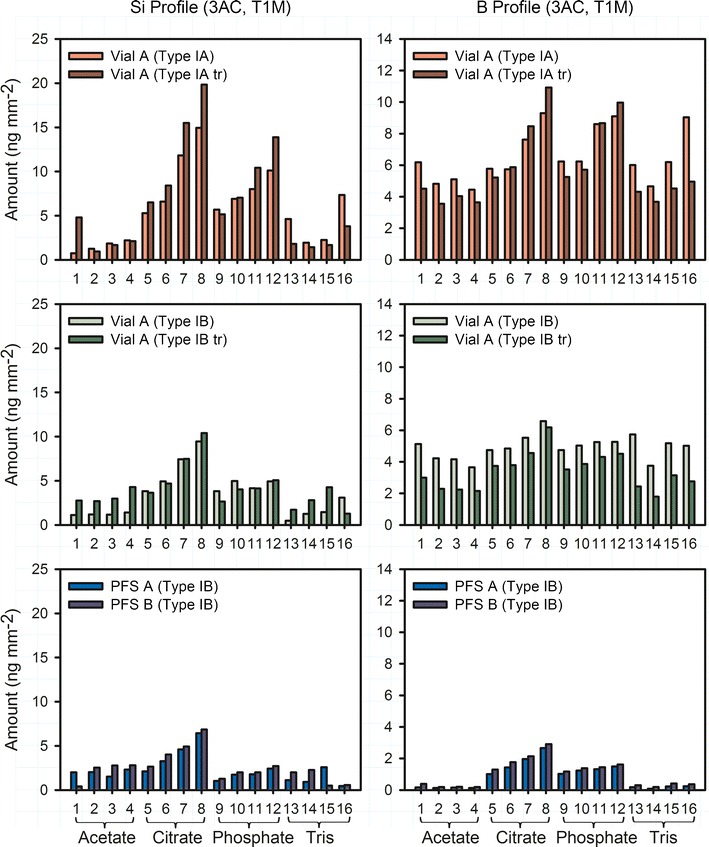
Profiles of dissolved Si and B for PFS and vials after 3 autoclave cycles and 1-month storage at 40°C/75% RH. The buffers used include (1) pH 4.5 acetate, (2) pH 4.5 acetate with NaCl, (3) pH 5.5 acetate, (4) pH 5.5 acetate with NaCl, (5) pH 5.5 citrate, (6) pH 5.5 citrate with NaCl, (7) pH 6.5 citrate, (8) pH 6.5 citrate with NaCl, (9) pH 6.5 phosphate, (10) pH 6.5 phosphate with NaCl, (11) pH 7.5 phosphate, (12) pH 7.5 phosphate with NaCl, (13) pH 7.5 Tris, (14) pH 7.5 Tris with NaCl, (15) pH 8.5 Tris, and (16) pH 8.5 Tris with NaCl
Both similarities and differences are significant between observed silicon and boron release. Similar to silicon release, Type IA, ammonium sulfate-treated and untreated vials from Vendor A released the most boron, followed by Type IB vials from the same vendor. PFS released the least boron. The highest boron release was found for citrate and phosphate solutions. However, for vial configurations, notable amounts of boron were released for all formulation conditions, in contrast to the observed pattern of silicon release. Neither vials nor PFS reached the theoretical Si/B ratio (~9.0 for Type IA glass and ~10.5 for Type IB glass) at time 1 month.
Figure 4 shows the profiles of dissolved silicon, boron, and aluminum for PFS after 1 cycle of autoclave and 6-month storage at 40°C/75% RH. Citrate buffer showed the highest level of silicon and boron release, followed by phosphate buffer. No obvious difference was observed between PFS A and B. The average Si/B and Si/Al ratio of PFS A and B filled with citrate and phosphate buffers at pH 6.5 are shown in Fig. 5. The Si/B ratio increased over time and reached the approximate theoretical ratio (~10.5) of the bulk glass at around 3 months for both buffers (Fig. 5a). Interestingly, Fig. 4c shows that citrate released the highest level of dissolved aluminum, while the dissolved aluminum in phosphate buffer was relatively low and was not much different from that in the acetate and Tris buffers. This decreased level of dissolved aluminum in phosphate buffer is attributed to the limited solubility of aluminum-phosphate complexes as discussed further in the following section. Due to this relatively low aluminum concentration, a much higher Si/Al ratio was observed for phosphate buffer, while the Si/Al ratio for citrate buffer reached the approximate theoretical ratio (~10.8) of the bulk glass at around 3 months (Fig. 5b).
Fig. 4.
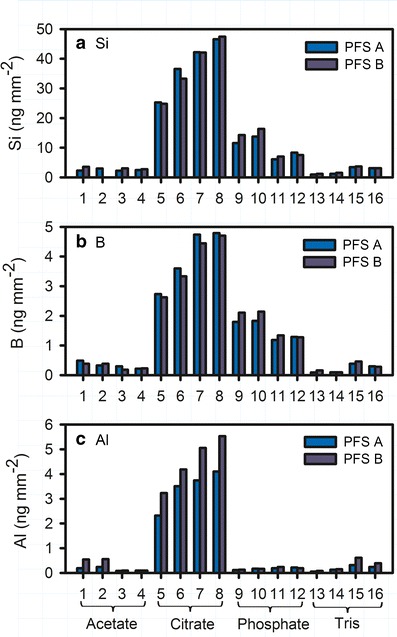
Profiles of dissolved Si (a), B (b), Al (c) for PFS after 1 autoclave cycle and 6-month storage at 40°C/75% RH. The buffers used include (1) pH 4.5 acetate, (2) pH 4.5 acetate with NaCl, (3) pH 5.5 acetate, (4) pH 5.5 acetate with NaCl, (5) pH 5.5 citrate, (6) pH 5.5 citrate with NaCl, (7) pH 6.5 citrate, (8) pH 6.5 citrate with NaCl, (9) pH 6.5 phosphate, (10) pH 6.5 phosphate with NaCl, (11) pH 7.5 phosphate, (12) pH 7.5 phosphate with NaCl, (13) pH 7.5 Tris, (14) pH 7.5 Tris with NaCl, (15) pH 8.5 Tris, and (16) pH 8.5 Tris with NaCl
Fig. 5.
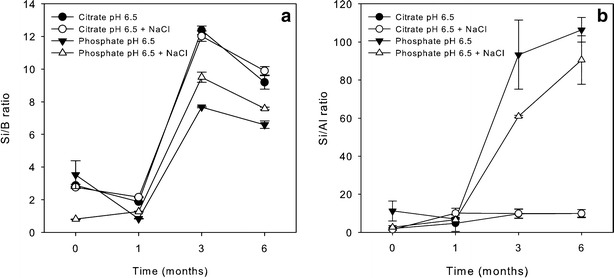
The Si/B ratio (a) and Si/Al ratio (b) over time for PFS stored at 40°C/75% RH after 1 cycle of autoclave
Glutaric Acid Study
As shown in Fig. 6, soluble silicon in the glutaric acid fill solution increased gradually over time for all container types and appeared to level off at around 3 months. PFS released less silicon than vials, and no obvious difference in silicon release was observed for PFS after each forming and annealing step during the manufacturing process.
Fig. 6.
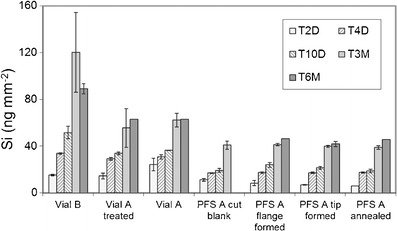
Profiles of dissolved Si for vials and PFS from different steps of the forming process after exposure to pH 11 glutaric acid at 40°C/75% RH
SEM and AFM Analyses
Figure 7 compares Type IA and Type IB vials from Vendor A, ammonium sulfate-treated and untreated Type IB vials from Vendor A. It also compares vials and PFS. Type IA vials showed apparent raised circular regions of the surface on Type IA vials before exposure to solution and circular pits after solution contact. The size distribution of pits after exposure to solution was evaluated using ImageJ. Type IA vial showed an average diameter of 0.53 μm for 25 pits, which covered 7.3% of the total analyzed surface. Type IB showed an average diameter of 0.76 μm for 6 pits, which covered 3.2% of the total surface. Small pits were observed for treated vials before solution contact, which were not observed for the untreated vial. Over time, corrosion of these pre-existing defects resulted in deterioration of the surface, showing a higher level of surface imperfections for treated vials than untreated vials with an average diameter of 0.20 μm for 358 pits, which covered 13.4% of the total analyzed surface of the treated Type IB vial. PFS A displayed a much smoother surface than vials after solution contact.
Fig. 7.
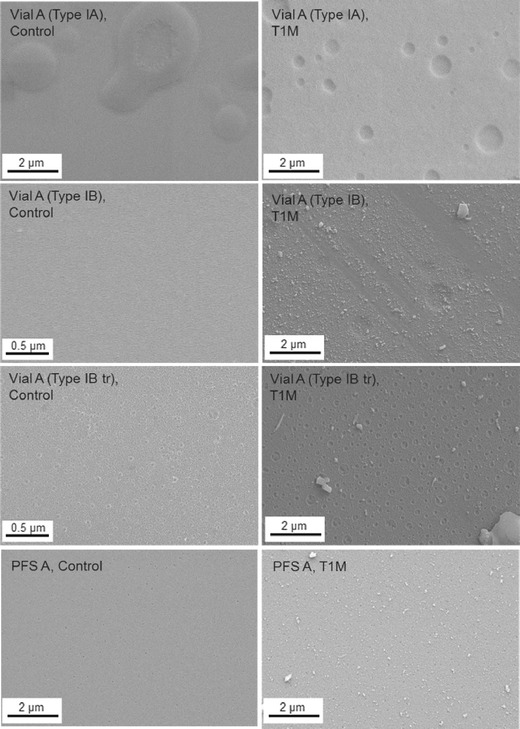
SEM images comparing Type IA and Type IB vials (treated and untreated) from Vendor A and PFS A before and after storage for 1 month at 40°C/75% RH with pH 7.5 phosphate buffer containing 150 mM NaCl. Filled samples were autoclaved for 3 cycles prior to storage
The surface of vials and PFS before and after being exposed to glutaric acid solution was compared using both SEM and AFM. Defects were observed for the control vials from both Vendors while control PFS showed a much smoother surface (data not shown). After exposure to glutaric acid (Fig. 8), vials from Vendor A displayed the largest pits. Vials from Vendor B showed much smaller pits, though the number of pits was larger. A smooth surface was observed for PFS by SEM. AFM results further confirmed that PFS are superior to vials in terms of surface defects, although smaller pits were observed in PFS B.
Fig. 8.
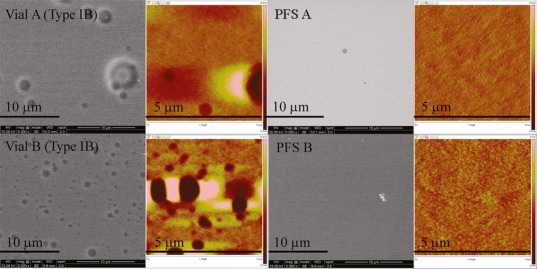
SEM (grayscale) and AFM images (color) of vials and PFS after exposure to pH 11 glutaric acid at 40°C/75% RH for 3 months. The depth scale for AFM images is from −20 to 20 nm for Vial A Type IB, −10 to 10 nm for Vial B Type IB, and −5 to 5 nm for PFS A and B
D-SIMS Analyses
The surface of the glass was evaluated using D-SIMS, and the first 20–30 nm of inner surface of containers was determined to differ in composition from the bulk glass. Figure 9 compares Type IB vials and PFS and shows that the boron and calcium were concentrated at the surface for vials prior to fluid contact, but not for the PFS. An accumulation of sodium was also observed for vials from both vendors, while a much smaller accumulation of sodium was observed for PFS B, but no accumulation was observed for PFS A. After solution contact, the depletion of boron, calcium, and sodium was observed for vials from both vendors, and a lesser extent of sodium depletion was found for PFS B. Different profiles were also observed for the containers from the two different glass sources after solution contact that were not dependent on container type, where an accumulation of aluminum was observed for Vendor A glass, while an accumulation of potassium was found for Vendor B glass.
Fig. 9.
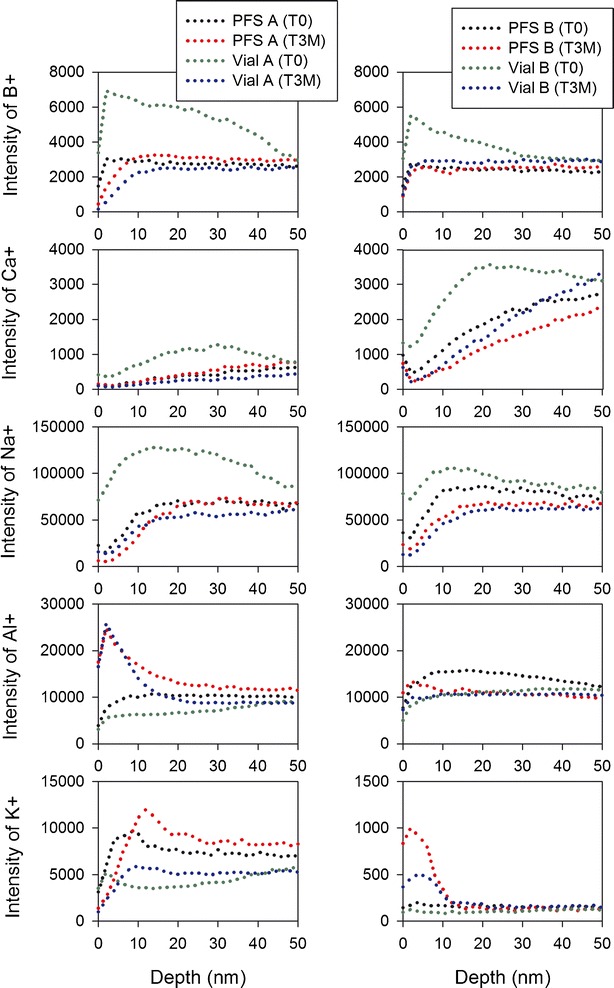
Comparison of elemental profiles for Type IB vials and PFS from both Vendor A (left) and B (right) glass prior to solution contact and after exposure to pH 11 glutaric acid at 40°C/75% RH for 3 months
DISCUSSION
Hydrolytic Resistance Testing
The hydrolytic resistance testing was performed to understand the resistance to water attack of containers as defined by the amount of their alkali release. Ammonium sulfate is typically added prior to the annealing step during a vial manufacturing process to react with the sodium near the glass surface, producing sodium sulfate, which is highly water soluble and is removed in a subsequent washing step. While ammonium sulfate treatment is well known to be used to dealkalize the glass surface, some previous studies have shown a greater degree of surface pitting with ammonium sulfate-treated vials and found that these vials were more prone to delamination than untreated vials which might be caused by significant extraction of the alkali oxides (1,2). The hydrolytic resistance testing shows that PFS performed similar to treated vials and outperformed untreated vials, without the potential impact of ammonium sulfate treatment on glass durability. This is due to the fact that the temperatures used to form PFS are less than those used to form vials since heating is known to promote the migration of alkali oxides from the silica network to the glass surface (2).
pH Measurements
The pH shift is consistent with the hydrolytic resistance testing. Type IA glass has less Na2O and K2O than Type IB glass in bulk, which could contribute to the lower alkali release from Type IA vials. In addition, the larger pH shift observed for Type IA vials when filled with NaOH and KOH may result from a higher level of silicic acid due to the higher initial SiO2 content of Type IA glass compared with Type IB glass. However, the glass chemistry at the inner surface of containers is different from the bulk according to the D-SIMS data; therefore, the impact of the bulk glass chemistry should be evaluated carefully.
Overall, the observed pH shift can be explained by known mechanisms. With low or neutral pH solutions, alkali leaching is the dominant corrosion mechanism. The alkali atoms held by weak ionic forces within the silicone oxide tetrahedron matrix have sufficient mobility to be extracted into the aqueous solutions (2). It is a diffusion-controlled ion-exchange process, resulting in an increase in solution pH over time. With high pH solutions, the dissolution of the silicate network is dominant while leaching occurs at the same time. The dissolution of the silicate network produces silicic acid, resulting in a decrease in pH over time (1).
Methylene Blue Staining
Methylene blue, a cationic dye, interacts with glass via adsorption dominated by an ion-exchange mechanism (13,14). Pure silica tetrahedrons are very brittle, and oxides of sodium, aluminum, potassium, calcium, magnesium, barium, and boron are added to improve the workability of the glass (2). When in contact with glass, methylene blue can replace the ions such as Na+ as well as H+ in the SiO4 network by ion exchange. Methylene blue staining has been used for investigating glass corrosion mechanisms (15), the removal of pollutants (16), and has been studied with glass fibers (17), clay minerals (18), kaolinite (19), etc. (14).
The heating of glass during the forming process can facilitate the migration of alkali borates from the silica network to the surface, causing a localized enrichment. This enrichment results in a higher number of non-bridging oxygens and more cations available for exchange with methylene blue at the surface. Based on bulk glass chemistry alone, Type IA borosilicate glass has a lower concentration of alkali available for exchange than Type IB glass; however, the higher processing temperature required for transforming Type IA glass and the even higher temperature required to form vial bottoms can significantly impact the concentration of alkali available at the glass surface. Surface treatments of the glass post-forming can also impact the surface chemistry and thus, susceptibility to staining. For filled containers, corrosion and remodeling of the surface, as well as the redeposition of glass leachables onto the surface, can occur and impact the ability of the methylene blue to penetrate and adsorb.
The greater staining observed for untreated Type IA vials over type IB vials could be due to combined effects of bulk chemistry and processing differences. In this case, the two effects cannot be isolated. However, the as-received PFS were not visibly stained, even though they had the same bulk chemistry as the Type IB vials. This points to a difference in exchangeable sites at the surface due to glass processing differences. The lack of staining for as-received ammonium sulfate-treated vials could be due to the extraction of the alkali oxides from the surface during treatment, resulting in fewer groups available for exchange.
ICP/MS data indicate that leachables were higher for most buffer conditions for Type IA vials than Type IB vials, and vials in general had higher leachables (silicon, boron) than the non-siliconized PFS. This correlates for the most part with the higher staining for Type IA vials > Type IB vials > PFS observed after exposure to fill solutions. These results, however, are not in alignment with hydrolytic testing, where Type IB vials exhibited the highest alkali release. In addition, while exposure of all glass types to citrate buffer led to the highest level of leachables, it also resulted in the least staining among the buffer solutions tested. While the exact reason for this is unknown, citrate is known to complex both silicon and aluminum, enabling higher release into solution but perhaps also leading to blocking or reducing availability of surface silanol groups for exchange with the cationic dye. Through SEM analysis, it was observed that exposure to citrate led to the smoothest surface of the buffer solutions tested. Thus, level of methylene blue staining for containers post-filling is likely dependent on the glass bulk chemistry, processing history, and mechanism of interaction with the formulation constituents. Since the methylene blue staining approach has not been well studied and the results are not well understood for glass after extended exposure to fill solutions, it should be evaluated carefully against other test methods as a delamination screening method for glass containers post filling.
ICP/MS Analyses
Glass durability regarding elemental release in various formulations has been studied previously (6,7,20–22). The observed higher release of silicon induced by citrate over that of phosphate buffer in this study may be due to the fact that the citrate anion is a metal ion chelator whereas the phosphate anion is not. Although hydrolysis reactions can result in the immediate release of alkali metals from the glass surface into the filled solutions, continued alkali release requires the diffusion of the solution into the glass network (23). Therefore, it takes time for the Si/B to reach the theoretical ratio of bulk glass. The Si/B ratio of vials at time 1 month after 3 autoclave cycles is lower than that of non-siliconized PFS due to the elevated released boron observed only for vials. This pattern is observed even for vials made of the same bulk glass as the PFS (Type IB), indicating that the different elemental release is likely due to different surface chemistries caused by the forming process. Ebert discussed three stages of corrosion using boron as a measure of the extent of glass corrosion. Boron release is noted as being a preferred measure of corrosion, since it is contained in very few secondary phases (23). The boron concentration increases at a constant rate at stage I of glass corrosion and then continues to accumulate while the rate keeps dropping to a saturation rate at stage II; stage III occurs when secondary phases precipitate from the solution, leading to the increase of corrosion rate and the continued accumulation of boron in the solution (23). According to this theory, an elevated boron, as well as the lower Si/B ratio than theoretical value, can also result from the occurrence of stage III of glass corrosion.
Aluminum phosphate, as well as some aluminum-phosphate complexes, is known to be very insoluble in neutral solutions (24). A rougher surface with deposits was only observed for phosphate-treated PFS and vials by SEM, which could be due to the precipitation of the aluminum complexes formed by phosphate and aluminum released from the glass. Ogava et al. found flake-like particles in the glass vials containing phosphate buffer. These particles were mainly composed of aluminum, phosphorus, and oxygen, but not silicon, resulting from the precipitation of aluminum-phosphate complex formed by the phosphate and aluminum released from glass (24). This can explain the relatively low dissolved aluminum observed in phosphate buffer for PFS at time 6 months after 1 autoclave cycle.
For the glutaric acid study, only silicon release was monitored due to the high pH of the formulation, which favors network dissolution over leaching. The dissolution of glass is known to be impacted by the concentration of dissolved silica (25). Iacocca’s study showed that the silicon concentration for vials containing glutaric acid reached a plateau after two terminal sterilization cycles and 15-day storage at 60°C (7). It took ~3 months at 40°C/75% RH in this study for the dissolved silicon to reach the plateau without autoclave. The glutaric acid study results are consistent with the formulation study, indicating that vials are more sensitive to chemical attack than PFS due to different forming processes. The similar silicon release observed for each manufacturing step of PFS confirms that the syringe manufacturing process, unlike the vial manufacturing process, does not negatively impact the durability of the glass surface. This is further confirmed by the SEM analysis which showed no obvious surface change at each forming step (data not shown).
SEM and AFM Analyses
The largest number of pre-existing defects for the control sulfate-treated vials are attributed to the removal of the sodium-rich regions by ammonium sulfate treatment (1). The raised regions observed for Type IA vials from Vendor A before solution contact could be gaseous inclusions/bubbles formed during the manufacturing process by precipitation during reheating the glasses, known as reboil (26). The nucleation of these gas bubbles during the cooling of the glass cane can lead to crater-like defects (1). Phase separation can also cause droplet-shaped, sodium borate-rich regions (27). The nucleation of these regions leaves a distinct population of surface defects with smaller size in their place (7). Temperature is critical to the formation of gas bubbles and phase separation; therefore, the manufacturing conditions are critical to control the original defects on the glass surfaces.
D-SIMS Analyses
The D-SIMS analyses of containers prior to fluid contact show differences in the surface chemistry between vials and PFS. More boron, calcium, and sodium were present at the surface of vials, indicating the vial forming process promoted the migration of these ions to the glass surface. After being exposed to glutaric acid, the enriched boron, calcium, and sodium were depleted for vials due to leaching. Iacocca et al. mentioned that the forming and growth of sodium-rich phases could be controlled by lower manufacturing temperatures (1). Therefore, these phases, if any, should be smaller and closer when lower temperatures were used during the manufacturing processes (1). The D-SIMS leaching profiles show that the level of sodium depletion after being exposed to glutaric acid is in the order of PFS A < PFS B < Vial B (Type IB) < Vial A (Type IB), which is consistent with the SEM results (Fig. 8) showing the same order of pit size. This suggests that the observed surface defects can be attributed to the depletion of sodium. In addition, the depletion of boron and calcium can also cause surface defects. The D-SIMS analyses further showed different profiles for the glass from the two different sources that were independent of container type, which could be due to the subtle difference in glass composition between these two Vendors.
CONCLUSIONS
This study compares the effects of bulk glass chemistry, glass transformation processes, and surface treatment on surface durability of PFS in comparison to vials against delamination. The experimental data showed that PFS outperform vials for most test conditions and perform equivalently for the remaining. Glass defects linked to the forming process are found for vials that are known historically to impact surface durability, while the PFS manufacturing process was not found to negatively impact the glass durability. Some differences in corrosion behavior were linked to differences in bulk glass chemistry and were independent of type of converted container. The solution formulation plays an important role in extent and mechanism of corrosion. In particular, the impact to the level of released elements found for the test solutions is buffer > pH > salt. Among the investigated buffers, citrate and phosphate were found to be the most aggressive buffers at the tested pH ranges. The screening methodology applied in this work can be utilized by drug developers to assess and refine product formulations and to select suitable containers for specific applications and by container manufacturers to select and test critical process parameters for increased product durability.
Acknowledgments
The authors gratefully acknowledge the support and effort of the following people: Changyun Xiong, Feng Zhang, Richard Evans, and Harry Sugg.
References
- 1.Iacocca RG, Allgeier M. Corrosive attack of glass by a pharmaceutical compound. J Mater Sci. 2007;42(3):801–811. doi: 10.1007/s10853-006-0156-y. [DOI] [Google Scholar]
- 2.Ennis RD, Pritchard R, Nakamura C, Coulon M, Yang TY, Visor GC, et al. Glass vials for small volume parenterals: influence of drug and manufacturing processes on glass delamination. Pharm Dev Technol. 2001;6(3):393–405. doi: 10.1081/PDT-100002248. [DOI] [PubMed] [Google Scholar]
- 3.FDA. Advisory to drug manufacturers: formation of glass lamellae in certain injectable drugs. 2011. http://www.fda.gov/Drugs/DrugSafety/ucm248490.htm. Accessed 05 Nov 2013.
- 4.Gin S, Godon N, Mestre JP, Vernaz EY. Experimental investigation of aqueous corrosion of R7T7 nuclear glass at 90°C in the presence of organic species. Appl Geochem. 1994;9(3):255–269. doi: 10.1016/0883-2927(94)90036-1. [DOI] [Google Scholar]
- 5.Fearn S, McPhail DS, Oakley V. Room temperature corrosion of museum glass: an investigation using low-energy SIMS. Appl Surf Sci. 2004;231–232:510–514. doi: 10.1016/j.apsusc.2004.03.205. [DOI] [Google Scholar]
- 6.Guadagnino E, Zuccato D. Delamination propensity of pharmaceutical glass containers by accelerated testing with different extraction media. PDA J Pharm Sci Technol. 2012;66(2):116–125. doi: 10.5731/pdajpst.2012.00853. [DOI] [PubMed] [Google Scholar]
- 7.Iacocca RG, Toltl N, Allgeier M, Bustard B, Dong X, Foubert M, et al. Factors affecting the chemical durability of glass used in the pharmaceutical industry. AAPS PharmSciTech. 2010;11(3):1340–1349. doi: 10.1208/s12249-010-9506-9. [DOI] [PMC free article] [PubMed] [Google Scholar]
- 8.Sloey C, Gleason C, Philips J. Determining the delamination propensity of pharmaceutical glass vials using a direct stress method. PDA J Pharm Sci Tech. 2013;67(1):35–42. doi: 10.5731/pdajpst.2013.00900. [DOI] [PubMed] [Google Scholar]
- 9.Jiang G, Goss M, Li G, Jing W, Shen H, Fujimori K, et al. Novel mechanism of glass delamination in Type 1A borosilicate vials containing frozen protein formulations. PDA J Pharm Sci Tech. 2013;67(4):323–335. doi: 10.5731/pdajpst.2013.00925. [DOI] [PubMed] [Google Scholar]
- 10.Badkar A, Wolf A, Bohack L, Kolhe P. Development of biotechnology products in pre-filled syringes: technical considerations and approaches. AAPS PharmSciTech. 2011;12(2):564–572. doi: 10.1208/s12249-011-9617-y. [DOI] [PMC free article] [PubMed] [Google Scholar]
- 11.Greystone. Prefilled syringes to 2018—devices, drugs, markets, players and prospects. 2013.
- 12.USP 35 < 660 > Containers—glass for surface glass test https://mc.usp.org/sites/default/files/documents/GeneralChapterPDFs/660ContainersGlass.pdf. Accessed 05 Nov 2013.
- 13.Ramkumar J, Chandramouleeswaran S, Sudarsan V, Vatsa RK, Shobha S, Shrikhande VK, et al. Boroaluminosilicate glasses as ion exchange materials. J Non-Cryst Solids. 2010;50–51:2813–2819. doi: 10.1016/j.jnoncrysol.2010.09.053. [DOI] [Google Scholar]
- 14.Rafatullah M, Sulaiman O, Hashim RAA. Adsorption of methylene blue on low-cost adsorbents: a review. J Hazard Mater. 2010;177:70–80. doi: 10.1016/j.jhazmat.2009.12.047. [DOI] [PubMed] [Google Scholar]
- 15.Cailleteau C, Angeli F, Devreux F, Gin S, Jestin J, Jollivet P, et al. Insight into silicate-glass corrosion mechanisms. Nat Mater. 2008;7:978–983. doi: 10.1038/nmat2301. [DOI] [PubMed] [Google Scholar]
- 16.Zhao M, Tang Z, Liu P. Removal of methylene blue from aqueous solution with silica nano-sheets derived from vermiculite. J Hazard Mater. 2008;158(1):43–51. doi: 10.1016/j.jhazmat.2008.01.031. [DOI] [PubMed] [Google Scholar]
- 17.Chakrabarti S, Dutta BK. On the adsorption and diffusion of methylene blue in glass fibers. J Colloid Interface Sci. 2005;286(2):807–811. doi: 10.1016/j.jcis.2005.01.035. [DOI] [PubMed] [Google Scholar]
- 18.Hang PT, Brindley GW. Methylene blue absorption by clay minerals—determination of surface areas and cation exchange capacities (clay—organic studies XVIII) Clays Clay Minerals. 1970;18(4):203–212. doi: 10.1346/CCMN.1970.0180404. [DOI] [Google Scholar]
- 19.Ghosh D, Bhattacharyya KG. Adsorption of methylene blue on kaolinite. Appl Clay Sci. 2002;20(6):295–300. doi: 10.1016/S0169-1317(01)00081-3. [DOI] [Google Scholar]
- 20.Bacon FR, Raggon FC. Promotion of attack on glass and silica by citrate and other anions in neutral solutions. J Am Ceram Soc. 1959;42(4):199–205. doi: 10.1111/j.1151-2916.1959.tb12947.x. [DOI] [Google Scholar]
- 21.Ledieu A, Devreux F, Barboux P, Sicard L, Spallac O. Leaching of borosilicate glasses. I. experiments. J Non-Cryst Solids. 2004;343:3–12. doi: 10.1016/j.jnoncrysol.2004.06.006. [DOI] [Google Scholar]
- 22.Borchert SJ, Ryan MM, Davison RL, Speed W. Accelerated extractable studies of borosilicate glass containers. J Parenter Sci Technol. 1989;43(2):67–79. [PubMed] [Google Scholar]
- 23.Ebert WL. The effects of the glass surface area/solution volume ratio on glass corrosion: a critical review. National Technical Information Service; 1995.
- 24.Ogawa T, Miyajima M, Wakiyama NKT. Effects of phosphate buffer in parenteral drugs on particle formation from glass vials. Chem Pharm Bull. 2013;61(5):539–545. doi: 10.1248/cpb.c12-01025. [DOI] [PubMed] [Google Scholar]
- 25.Geisler T, Janssen A, Scheiter D, Stephan T, Berndt J, Putnis A. Aqueous corrosion of borosilicate glass under acidic conditions: a new corrosion mechanism. J Non-Cryst Solids. 2010;356(28–30):1458–1465. doi: 10.1016/j.jnoncrysol.2010.04.033. [DOI] [Google Scholar]
- 26.Shelby JE. Introduction to glass science and technology, 2nd ed. Royal Society of Chemistry; 2005.
- 27.Varshneya AK. Fundamentals of inorganic glasses. Academic Press; 1994.


