

Abstract
The goal of this article is to discuss the classification of video recordings and images when applied to dissolution testing in USP apparatus 1 and 2. Three use cases are presented. The first case presents the use and classification of video as RBE (review by exception) data under GAMP 5. The second case presents the use of video in formulation development in a research and development environment. The third case presents a feasibility study using readily available computer vision software to recognize and measure objects in the dissolution vessel, setting the groundwork for the use of image analysis as a quantitative tool. The classification of video as “electronic data”, requiring 21 CFR part 11 compliance, versus its classification as a RBE data under GAMP 5, likely depends upon its use case. Another goal of this article is to establish a position on the use of video monitoring technology as a tool for dissolution testing that is fit for purpose and compliant with regulations regarding video data management and information.
Key words: computer vision, dissolution, GAMP, USP, video monitoring
INTRODUCTION
Dissolution testing as described in chapter <711> of the USP, has been a regulatory requirement for batch release of a wide variety pharmaceutical products for several decades. As part of the recommendations for the development and validation of dissolution methods, the USP mentions in chapter <1092>, that “visual observations are often helpful for understanding the source of variability and whether the dissolution test itself is contributing to the variability” (1). Others in the industry have also noted the usefulness of visual observations when automated systems are employed for routine testing (2).
Human observation of entire dissolution experiments is resource intensive, and impractical, particularly in cases where dissolution runs span multiple work shifts. Due to the usefulness of visual observations, a variety of home-built, and some commercially available video-monitoring systems have been employed to capture dissolution experiments. Several of these systems have been based on security camera systems, allowing for multiple cameras to simultaneously collect video information from each of the six or more dissolution vessels run during a typical test.
From a GxP standpoint, standardization is desirable, and a presentation and discussion of the fit-for-purpose criteria to apply to these systems is currently lacking in the context of the pharmaceutical industry. Purposes vary. Some choose to use the video monitoring system as a way to investigate atypical and out of specification results (OOS) in routine quality control testing. This can be particularly useful to determine root causes for and provide evidence to explain unexpected results as part of formal laboratory investigations. In these cases, the system may only require resolution sensitive enough to capture the presence or absence of the tablet in a vessel. Others have used video monitoring during method development, to look more closely at the behavior of the dosage form during the dissolution test and correlate these behaviors to different formulation choices. Also worth considering, is that while the field of computer vision continues to evolve, we have yet to see video monitoring applied to capture critical quality attributes as part of quality testing, or applied as part of a QbD approach to formulation design.
From a regulatory perspective, while the FDA provides guidance regarding the proper handling of electronic data under 21CFR11, and regarding various types of experimental data collected during dissolution testing, there has not yet been a specific public discussion with regard to video monitoring used for dissolution testing and the classification of the video capture.
In cases where a specific guidance does not exist, it is common to evaluate the application of a technology in other fields. A review of regulatory examples from the FDA includes recalls for video equipment in the medical device industry; and video accepted as part of NDA applications during clinical trials (3) where video is directly tied to patient information. However, these examples cannot be applied to dissolution testing in pharmaceutical field, since the level of correlation between video information and patient safety has not yet been established, though perhaps one day, correlations like this may be developed.
The ASTM offers (in C1661-13) a “Standard Guide for Viewing Systems for Remotely Operating Facilities,” and while there are some fully automated dissolution systems which operate unattended, and could therefore be considered as under “remote” operation; this ASTM standard was developed for use in the nuclear industry, where there is a concern for operator and public safety. The ASTM F2926-12 “Standard Guide for Selection and Operation of Vessel-mounted Camera Systems,” although not specifically addressing the use of dissolution vessels, offers some useful precedent, in that specific mention is given to the consideration of the camera operating specifications as being fit-for-purpose in so far as they are able to discriminate adequately between the substances they are intended to detect. This latter ASTM guidance is important, and perhaps others not mentioned here, since this sets a precedent for the consideration of video collection such as resolution, which could logically be extended to the use of video monitoring for dissolution testing.
In this review, we collect and discuss three cases for the implementation of video monitoring with dissolution testing. These cases come from a pharmaceutical innovator, a generic manufacturer, and an instrumentation provider. The examples presented are also purposefully chosen to illustrate use cases where the classification of the video capture might fall into different regulatory categories: laboratory observation, RBE (4) (review by exception) data, and electronic data (as defined under 21 CFR 11). It is our hope that this will help to form a framework for future regulatory discussion regarding the classification of video capture as well as set some of the criteria to be considered.
MATERIALS AND METHODS
In this study, three different camera systems were used to capture video of dissolution experiments on a variety of dissolution systems. For case 1: in which video capture was used for out of specification (OOS) reporting, Dedicated Micros DM/SDAV16x90A—SD Advanced—16 channel digital video recorders were used with Watec WAT-230 Vivid (effective pixels: 380 K(N), 440 K(P))—miniature board cameras equipped with a mixture of Watec 1920BC-5 and Watec 3820–5 lenses. For case 2 where image and video capture were used during dissolution method development, a Canon PowerShot Pro 1 (180 × 180 dpi, 2,272 × 1,704 pixel resolution) was used. For case 3 where video was used in a computer vision feasibility study, a system comprised of an Everfocus 8-channel DVR recorder equipped with 6 mini SPC 500 cameras with 704 × 576 pixel resolution were used.
Cameras were mounted relative to the dissolution vessel providing both side and bottom views. Mounted positions were fixed throughout the dissolution runs. Digital video recordings were collected continuously or by manually starting and stopping the DVR; no automated or remote start/stop signals were used in this study.
Case 1: in the case of out of specification results reporting, video recordings were manually reviewed and individual images captured to document root cause. Individual image captures with time/date stamps entered into electronic OOS reports.
Case 2: for video recording used during dissolution method development, video segments were manually reviewed and qualitative assessments made of dosage form behaviors during the test.
Case 3: for the computer vision feasibility study, multiple images were extracted from the video record and a camera calibration was performed using a standard checkerboard pattern and tools available from OpenCV (5), an open source library of programming functions designed for computer vision, and free for both academic and commercial use.
The camera calibration procedure is designed to be both accurate and easy to perform. The first step involves manually obtaining images of the checkerboard pattern from a variety of views. For best results, it is important to get images at multiple scales and angles. The checkerboard pattern is planar and can be easily created by printing the image provided by the software and affixing it to a flat, rigid surface. The second step of estimating the camera model parameters is automatically performed by the software. To obtain units in millimeters, the size of the square in the checkerboard pattern can be manually measured and given as input to the software. The quality of the calibration can be assessed by examining the resulting reprojection error, which should be less than a single pixel. After calibration, both the pinhole camera model parameters and lens distortion coefficients are set. The camera is then ready for use to obtain quantitative measurements from images.
USP compliant dissolution systems from Vankel (VK 7000) and Sotax (AT and AT MD) equipped with 1-L vessels and baskets or paddles per USP <711> were used.
For the computer vision feasibility study, camera video capture was evaluated through various combinations of air, water, and glass in order to simulate different types of dissolution equipment as well as different sections of a typical dissolution run. In addition to USP compendial 1-L vessels, compendial mini-vessel described in the Chinese Pharmacopeia and a non-compendial flat-bottom mini-vessel were also used in this part of the study.
RESULTS AND DISCUSSION
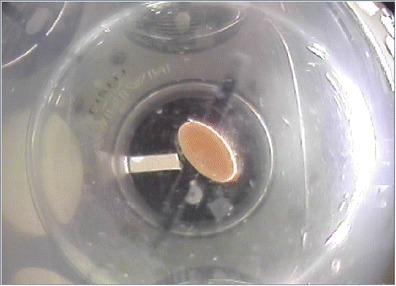
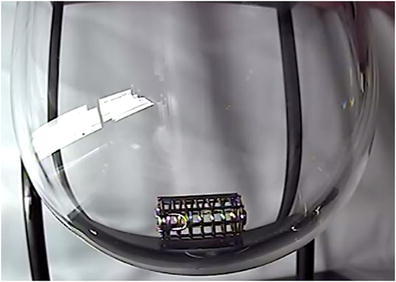
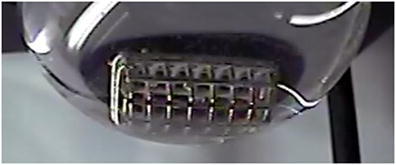
In case 1, where the video-monitoring system was used to capture OOS as supportive evidence for OOS reporting, cameras were mounted with an upward view into the vessel, as well as an overall system view, as shown in Fig. 1. As can be seen by the comparison of Figs. 2, 3, 4, and 5b, using such a system, one can easily identify the presence or absence of the dosage forms in the vessel, as well as their relative placement in the vessel.
Fig. 1.

Overall video-monitoring system view
Fig. 2.
Comparison of video-monitoring system
Fig. 3.

Using such a system, one can easily identify the presence or absence of the dosage forms in the vessel
Fig. 4.

Using such a system, one can also identify their relative placement in the vessel
Fig. 5.
Another comparative example of the video-monitoring system
In situations where various dosage strengths differ in color, color video capture has been used to differentiate between dosage strengths for OOS reporting. Also, as seen in Fig. 1, cameras providing an overview of the system could be used for laboratory investigations where analyst error plays a role. This view is also useful to identify and troubleshoot system issues that are not readily observable with the vessel view cameras.
Varying light conditions and varying degrees of focal quality can be seen in these images. Despite these variations, it is still possible, upon manual review of the video capture, to make judgments regarding the criteria for which the system was designed. The system could therefore be considered fit-for-purpose.
In case 2, where the video-monitoring system was used to capture information used to make formulation decisions during research and development, camera views from the bottom and side were taken. In Fig. 6, we see a capsule formulation where half of the capsule has dissolved. In this image, the orientation of the remaining capsule shell showed some correlation to the dissolution results observed. Due to the type of behavior that was being observed, this led to changes in the sinker type chosen. It is important to note here that in order to be fit for use, the resolution of the video images collected needed to be sufficient in order to resolve the orientation of the capsule in the vessel. Hence, a higher resolution is required for case 2 than what is required for case 1.
Fig. 6.
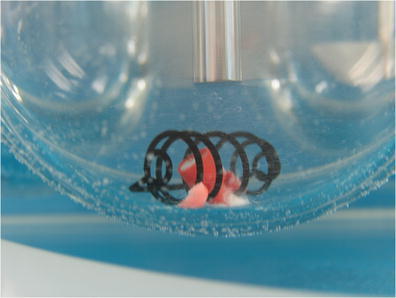
Capsule formulation where half of the capsule has dissolved
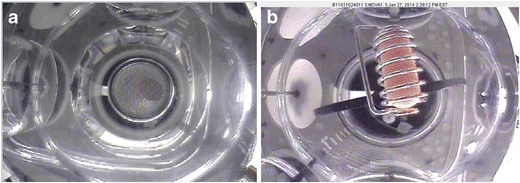
In case 3, we consider a system designed for the implementation of computer vision, as well as doing a comparison between video capture designed for different equipment types and for use during different parts of the dissolution experiment. In the images collected for this case study, consideration was also taken for use of computer vision to measure objects in the vessel.
For measurement of objects in the vessel, a calibration of the camera was required. In Fig. 7, on the left we see an uncorrected video image of a standard checkerboard pattern used for camera calibration. On the right in Fig. 7, we see a corrected video image, post calibration.
Fig. 7.
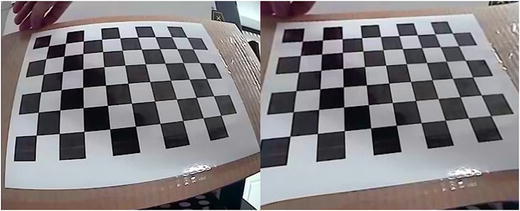
Uncorrected video image of a standard checkerboard pattern used for camera calibration
For USP 1,2 dissolution baths there are two different methods of heating available on the market today. Some systems heat by use of a water bath, while others use electric heating jackets. Video captured on these different equipment designs would therefore pass through materials of differing refractive index.
In addition to the 1-L USP vessel, there are also a variety of other vessels commonly in use. To model this, images of a USP (harmonized) JP sinker were collected in three styles of vessels: 1 L, Chinese Phar mini-vessels, and flat-bottom mini-vessels.
First, a JP sinker was placed in each of the vessels and images were recorded through air, with no water in the dissolution vessel. Figures 8, 9, and 10 show typical results in each vessel type. As can be seen, reflections and lighting could produce interferences, but some degree of reflection, as long as it does not obscure the area of interest is permissible.
Fig. 8.
Typical result in each vessel type
Fig. 9.

Reflections and lighting could produce interferences
Fig. 10.

Another typical result in each vessel type
Water was then added to each of the vessels and a series of images was collected as shown in Figs. 11, 12, and 13. In this series of images, we see that for the round-bottom vessels, a portion of the view of the JP sinker is obscured when the camera is mounted at an angle approximately 90° to the central axis of the vessel. Additional images taken at an angle of approximately 45° (viewing upward) relative to the vessel axis in the China mini-vessel (Fig. 14), show that the view of the sinker is still truncated.
Fig. 11.

Water was then added to each of the vessels
Fig. 12.

Water was then added to each of the vessels and a series of images was collected
Fig. 13.

For the round bottom vessels, a portion of the view of the JP sinker is obscured when the camera is mounted at an angle approximately 90 degrees to the central axis138 of the vessel
Fig. 14.
Additional images taken at an angle of approximately 45 degrees (viewing upward) relative to the vessel axis in the China mini-vessel
Vessels were then placed in a water bath and the JP sinker was viewed with air in the vessel. Figures 15, 16, and 17 are representative examples. In these images, we see a higher degree of interference from reflections external to the dissolution bath. We also see that distortions due to the different refractive indices make the sinkers appear to be positioned higher in the vessel than they actually are.
Fig. 15.

Representative example
Fig. 16.

Another representative example
Fig. 17.

We see a higher degree of interference from reflections external to the dissolution bath
For the final set of images, the vessels in the water bath were filled with water, and images of the same JP sinker were collected. Figures 18, 19, and 20 are representative examples. In these images, we see that the reflections and distortions are greatly reduced.
Fig. 18.

Representative example (final set of images)
Fig. 19.

Representative example where reflections and distortions are greatly reduced
Fig. 20.

Another representative example
While the distortions and reflections differ from each other in each case, it is possible in all cases to qualitatively identify objects and dosage forms in the vessel. Camera calibration in each of these cases is also possible, and correction factors could be applied to each individual case. Since the dissolution testing is typically done on multiple vessels, to apply computer vision algorithms across a sample set, it is important to be able to standardize and compare images from vessel to vessel as well as multiple results taken from the same vessel on different days. Designing a camera system which uses cameras mounted at the same angle and same distance from each of the different dissolution vessels in the system helps to minimize image to image variability. Another useful tool could be the addition of an in-frame scale. This could be done by placing or mounting an object of known size somewhere in the visual field but outside of the vessel. However, this scale would not be subject to the same distortions as objects inside the vessel. Therefore, an object of known dimensions, such as the paddle, or a sinker of well-defined dimensions, which is located in the vessel, could also serve as an in frame reference.
With quantitative image capture, it would then also be possible to measure product attributes such as flocculent particle size, cone height and angle (using a side view), and diameter of the base (using a bottom view), etc. Quantitation of these visual attributes could then be correlated to quality attributes, with the potential for expanding product performance understanding in some cases.
CONCLUSIONS
Video monitoring can be a useful tool to aid during dissolution method development and out of specification reporting during quality testing. There is future potential through the proper design of video-monitoring systems, and the use of readily available computer vision software, to transition video images from a qualitative, to a quantitative, capture source.
The critical criteria to consider when designing a vide-monitoring system which will be fit-for-use for collecting quantitative data are the following: resolution of the camera relative to the objects to be captured and whether qualitative or quantitative evaluation of the images is to be applied. Adequate lighting should be supplied, and efforts made to reduce interferences from reflections.
The greatest image distortions during dissolution runs were found in systems collected through air and into the vessel; however, even in this case, although a higher correction factor will be required, it is still feasible to do quantitative work.
From a regulatory perspective, there is currently no official guidance from the USP or FDA regarding the use of video monitoring with dissolution testing. However, from a GAMP 5 perspective, we have shown that specification of the system during the DQ (Design Qualification) will require verification which can be accomplished through a camera calibration. Furthermore, validation of the timestamp and date information assigned to each video image, as well as documentation of the assertion that the video system does not allow editing, could be handled during an IQ/OQ/PQ under either the AIQ USP <1058> or GAMP 5 4Qs model (6).
When video-monitoring systems are used to collect images for out of specification reporting, these images could be categorized as RBE data under GAMP 5. Thereby limiting the amount of manual image review required.
Using computer vision, quantitative automation of image review is possible, and could lead to the identification of critical quality attributes which had not previously been tracked. These newly identified critical quality attributes could then be included in existing QbD processes. Quantitative image analysis could also be used to capture and measure instrument properties and performance, including but not limited to: paddle/basket size, rpm, alignment, wobble, height, etc., to act as a secondary compliance check.
Acknowledgments
No external funding supported this work. It was wholly supported by the individual companies with whom the authors are employed.
Conflict of Interest
Authors declare no conflict of interest in this work, in so far as this article endorses no particular brands in respect to others.
Glossary of Terms
- ASTM
American Society for Testing and Materials
- Camera calibration
The process of establishing a relationship between camera pixels in an image and a real unit of length measurement. This allows captured images to be corrected for distortions due to such things are lens curvature.
- Computer vision
A field of study and research that includes image (and video) capture, processing, and analysis.
- FDA
Food and Drug Administration
- IQ/OQ/PQ
Installation qualification/operational qualification/performance qualification
- NDA
New drug application
- GxP
An abbreviation of GMP, GLP, etc., which in turn stands for “Good Manufacturing Practices,” “Good Laboratory Practices,” etc.
- GAMP
“Good Automated Manufacturing Practice” is a subcommittee within the ISPE (International Society for Pharmaceutical Engineering). It also refers to guide that they publish (see reference #4).
- QbD
Quality by design
- USP
United States Pharmacopeia
References
- 1.USP Chapter <1092>.
- 2.Kasis A, et al. Unlocking the secrets of automation in the pharmaceutical laboratory, American Laboratory, Oct. 2008.
- 3.Donoghue M. NDA 203985, Feb. 2012.
- 4.GAMP 5: a risk-based approach to compliant GxP computerized systems. © Copyright ISPE 2008.
- 5.Bradski, G. Programmer’s toolchest; the openCV library-openCV is an open-source, computer-vision library for extracting and processing meaningful data from images. Dr Dobb’s Journal-Software Tools for the Professional Programmer 25.11 (2000): 120–126.
- 6.Burgess C, McDowall RD. 38(1) Stimuli to the revision process. An integrated and harmonized approach to analytical instrument qualification and computerized system validation—a proposal for an extension of analytical instrument qualification <1058>.