


Abstract
The σ54 promoters are unique in prokaryotic genome and responsible for transcripting carbon and nitrogen-related genes. With the avalanche of genome sequences generated in the postgenomic age, it is highly desired to develop automated methods for rapidly and effectively identifying the σ54 promoters. Here, a predictor called ‘iPro54-PseKNC’ was developed. In the predictor, the samples of DNA sequences were formulated by a novel feature vector called ‘pseudo k-tuple nucleotide composition’, which was further optimized by the incremental feature selection procedure. The performance of iPro54-PseKNC was examined by the rigorous jackknife cross-validation tests on a stringent benchmark data set. As a user-friendly web-server, iPro54-PseKNC is freely accessible at http://lin.uestc.edu.cn/server/iPro54-PseKNC. For the convenience of the vast majority of experimental scientists, a step-by-step protocol guide was provided on how to use the web-server to get the desired results without the need to follow the complicated mathematics that were presented in this paper just for its integrity. Meanwhile, we also discovered through an in-depth statistical analysis that the distribution of distances between the transcription start sites and the translation initiation sites were governed by the gamma distribution, which may provide a fundamental physical principle for studying the σ54 promoters.
INTRODUCTION
Promoter is a region of DNA that determines the transcription of a particular gene. In prokaryotes, it is the σ factors of RNA holoenzyme that recognize and bind to the promoter sequences during gene transcription (1). Accordingly, the types of prokaryotic promoters are defined by the types of σ factors. At present, the known σ factors belong to two main families: one is σ70, which regulates the transcription of the majority of housekeeping genes under normal conditions (2); the other is σ54, which is in charge of the transcription of the specific genes in response to environmental changes (3).
Although both the σ70 and σ54 promoters usually contain two basic regulatory elements (4), their consensus sequences and locations are quite different. For σ70, one of its basic regulatory elements is with the consensus sequence TATAAT located at around -10bp upstream from the transcription start site (TSS), and the other is with TTGACA at around -35bp. However, for σ54, the corresponding two elements are with TGC[AT][TA] at around -12bp (Figure 1) and with [CT]TGGCA[CT][GA] at around -24bp, respectively (5). Interestingly, the holoenzyme of σ54 promoters in initiating RNA synthesis (6) will depend on enhancer-binding proteins (Figure 1).
Figure 1.

A schematic illustration to show the basic structure of σ54 promoter and its biological process.
These promoters will transcript the genes to control numerous ancillary processes and environmental responsive processes (7), including the expression of chemotaxis transducers, assembly of motility organs (8), nitrogen fixation (9), arginine catabolism (10), alginate biosynthesis (11), flagellar assembly (5) and so forth. Several special bacteria such as Escherichia coli, Salmonella typhimurium and Pseudomonas putida (12) extensively use σ54 promoter-dependent transcription to regulate the metabolisms necessary for their survival. Therefore, it is crucial to in-depth understand the subsequent steps of gene expression and establish the network of gene transcription so as to reveal the mechanism involved in σ54 promoters transcription. The correct identification of σ54 promoters is the first step for understanding their regulatory mechanisms; it is also important for discovering those genes missed by the wet-experimental evidences (13).
Although the biochemical experimental approaches can provide the details for σ54 promoters, the wet-experimental technique is time-consuming and expensive. With the avalanche of biological sequences generated in the post-genomic era, it is highly desirable to develop computational methods to identify σ54 promoters in prokaryotic genomes. Although phylogenetic footprinting takes the advantage of relative conservation of motifs among related species (14,15), these motifs are short and not fully conserved among species (16,17), which may lead to a lot of false positives. Furthermore, it is time-consuming for phylogenetic tree to identify promoters. Accordingly, it would be a feasible avenue to resort to the machine learning-based approaches, which have been proved to be quite powerful and efficient in dealing with various biological problems.
Actually, over the past three decades, based on the feature of promoter sequences, a series of algorithms, such as increment of diversity with quadratic discriminant (18), partial least squares (19), position weight matrix (20), hidden Markov model (21), artificial neural network (22) and support vector machine (SVM) (23) have been developed to identify prokaryotic promoters. Although these methods have made considerable contributions to the progresses in recognizing prokaryotic promoters, they mainly focused on the σ70 promoters because more experimental data were available for this kind of promoters. With the development of high-throughput sequencing technology, the accumulation of experimental data on the σ54 promoters has also provided us with a feasible avenue to develop computational methods for identifying the σ54 promoters (23,24). For instance, de Avila et al. (25) recently developed the DNA duplex stability-based method for the recognition and classification of σ54 promoter sequences and achieved the overall accuracy of 78.8%.
Although the aforementioned methods could yield quite encouraging results, further developments in this area are definitely needed due to the following reasons. (i) The data sets constructed in these methods were too small to reflect the statistical profile of σ54 promoters. (ii) No cutoff threshold (26) was imposed to winnow the redundant samples or those with high sequence similarity with others in a same subset data set. (iii) The DNA local properties that might have some intrinsic correlation with the promoters and play an important role in identifying them were totally ignored (27), needless to say how to use them to incorporate the global sequence order information. (iv) No web-server whatsoever was provided for these methods, and hence their usage is quite limited, particularly for the broad experimental scientists.
The present study was devoted to enhance the prediction power and quality in identifying the σ54 promoters from the aforementioned four aspects.
As demonstrated by a series of recent publications (28–32) and summarized in a comprehensive review (33), to develop a really useful predictor for a biological system, one needs to go through the following five steps: (i) select or construct a valid benchmark data set to train and test the predictor; (ii) represent the samples with an effective formulation that can truly reflect their intrinsic correlation with the target to be predicted; (iii) introduce or develop a powerful algorithm to conduct the prediction; (iv) properly perform cross-validation tests to objectively evaluate the anticipated prediction accuracy; (v) establish a user-friendly web-server for the predictor that is accessible to the public. Below, let us elaborate how to deal with these five steps one-by-one.
MATERIALS AND METHODS
Benchmark data set
To construct a high quality benchmark data set, only experimentally confirmed σ54 promoter sequences and TSSs were collected. Thus, 92 samples were obtained from the RegulonDB 8.0 (http://regulondb.ccg.unam.mx/) (34) and 74 from Barrios et al. (1). Subsequently, by mapping the  σ54 promoters into their genomes using BLAST program, kept were only those samples whose primary sequences having the length of 81 bp from
  to +20 bp with the TSS at their between (i.e. the site of 0 bp).
The construction of negative data set is very important for training the predictor. In this work, the non-promoter sequences or negative samples were extracted from the coding regions and intergenic regions of E.coli K-12. To assure no potential TSS in the negative samples, the following procedure was considered. We initially selected non-promoter sequences from the middle regions of long coding sequences. Because the convergent intergenic regions are the transcription terminal regions of both proximate genes flanking the intergenic regions, the negative samples for the non-promoter sequences were extracted from convergent intergenic regions. The non-promoter sequence samples are also 81 bp long. The hypothetical non-TSSs are located at the 61st position, so the non-promoter samples have the same profile as the real promoter samples. Sequences with other IUPAC code letters, such as ‘‘N,’’ ‘‘W,’’ ‘‘S’’ have been filtered out from both positive and negative data sets.
As elucidated in (35), a data set containing many redundant samples with high similarity would be lack of statistical representativeness. A predictor, if trained and tested by a biased benchmark data set, might yield misleading results with an overestimated accuracy (36). To get rid of the redundancy and avoid bias, the CD-HIT software (37) was utilized by setting its cutoff threshold to winnow those DNA fragments which had  pairwise sequence identity with any other in a same subset data set.
Finally, we obtained 161 positive and 161 negative sample for the benchmark data set S, as can be formulated by
 |
(1) |
where the subset  contains only positive samples or promoter sequences,
  only negative samples or non-promoter sequences, while
  represents the ‘union’ in the set theory. The corresponding detailed sequences are given in the Supporting Information S1.
Formulate DNA segments with pseudo nucleotide composition
Suppose a DNA segment consists of L nucleic acid residues; i.e.
 |
(2) |
where R1 represents the first nucleic acid residue at position 1, R2 the second nucleic acid residue at position 2 and so forth. Now the problem is how to express the DNA segment as an input for statistical prediction. Actually, one of the most challenging problems in computational biology is how to effectively formulate a biological sequence with a discrete model or a vector, yet still keep considerable sequence order information. This is because all the existing operation engines, such as optimization approach (38), covariance discriminant (CD) (39), neural network (40), SVM (41), random forest (42), conditional random field (43), nearest neighbor (NN) (44); K-nearest neighbor (KNN) (45), OET-KNN (46), Fuzzy K-nearest neighbor (47), ML-KNN algorithm (48) and SLLE algorithm (49), can only handle vector but not sequence samples. However, a vector defined in discrete model may lose all the sequence-order information.
One way to deal with such a dilemma is to represent the DNA segment with the k-tuple nucleotide composition (18), a vector with 4k components; i.e.
 |
(3) |
where  is the normalized occurrence frequency of the i-th k-tuple nucleotide in the DNA segment. As we can see from Equation (3), by increasing the value of k, although the coverage scope of sequence order will be gradually increased, the dimension of the vector D will be rapidly increased as well. For example, when k = 13, its dimension would become
  , causing the so-called ‘high-dimension disaster’ (50) or overfitting problem that will significantly reduce the deviation tolerance or cluster-tolerant capacity (51) so as to lower down the success rate of prediction. Therefore, the k-tuple nucleotide composition approach can only incorporate the local or short-range sequence-order information, but certainly not the global or long-range sequence-order information.
Actually, similar problem also occurred in computational proteomics, where in order for incorporating the global or long-range sequence order information for proteins, the pseudo amino acid composition (52,53) or Chou's PseAAC (54) was propose. Since the concept of PseAAC was proposed in 2001 (52), it has been penetrating into almost all the fields of protein attribute predictions (see, e.g. (55–57) and a long list of publications cited in (58). Because it has been widely used, recently three types of open access soft-ware, called ‘PseAAC-Builder’ (59), ‘propy’ (60) and ‘PseAAC-General’ (58), were established: the former two are for generating various modes of special PseAAC, while the third one for those of general PseAAC.
Encouraged by the successes of introducing the PseAAC approach into computational proteomics, recently Chen et al. (28) proposed the ‘pseudo dinucleotide composition’ or PseDNC to identify recombination spots of DNA. Along such a direction, we are to propose a more general formulation to incorporate the global or long-range sequence order information of DNA and use it to identify the σ54 promoters. The new formulation is called ‘pseudo k-tuple nucleotide composition’ or PseKNC, as given by
 |
(4) |
in which
 |
(5) |
where  have the same meaning as those in Equation (3), while
  is the j-th tire correlation factor that reflects the sequence order correlation between all the j-th most contiguous dinucleotides along a DNA sequence (see Supplementary Figure S1 in Supporting Information S2), as formulated by
 |
(6) |
In the above two equations,  is the number of the total counted ranks or tiers of the correlations along a DNA sequence, and w the weight factor. Their concrete values as well as the final value for k will be further discussed later. The correlation function
  in Equation (6) is defined by
 |
(7) |
where μ is the number of local DNA structural properties considered that is equal to 6 in the current study as will be explained below;  , the numerical value of the
 DNA local structural property for the dinucleotide
  at position i and
  the corresponding value for the dinucleotide
  at position
  , as will be given below.
DNA local structural property parameters
Many evidences have showed that DNA local structural properties play important roles in a series of biological processes, such as protein–DNA interactions (61), formation of chromosomes (62), nucleosome occupancy (63) and meiotic recombination (28). As an important and special regulator, promoters usually take possession of some distinct DNA structural properties to allow special regulatory protein binding. Several models (23,62,64) have been developed to predict the eukaryotic and prokaryotic promoters by using the basic physical properties. It was shown in these models that the physicochemical properties did play a crucial role in promoter recognition. Recently, the report by Duran et al. (65) strongly supports the hypothesis that an ancient regulatory mechanism encoded by the intrinsic physical properties of the DNA may contribute to the complexity of transcription regulation in the human genome.
Illuminated by Duran et al.'s work (65), here the DNA local structure characteristics are used to define PseKNC. Generally speaking, the spatial arrangements of two successive base pairs can be characterized by six quantities, of which three are the local translational parameters and the other three the local angular parameters (see Supplementary Figure S2 in Supporting Information S2), as formulated by
 |
(8) |
The six structural parameters of dinucleotides have been calculated by Goni et al. (61) based on the long atomistic molecular dynamics (MD) simulations in water, and their concrete values are given in Supplementary Table S1 of Supporting Information S3, which will be used to calculate the global or long-range sequence-order effects for the promoter sequences via Equations (6) and (7).
Note that before substituting the values of physicochemical property into Equation (7), they were all subjected to a standard conversion as described by the following equation:
 |
(9) |
where the symbol < > means taking the average of the quantity therein over the 16 different combinations of A, C, G, T for  , and SD means the corresponding standard deviation (26). The converted values obtained by Equation (9) will have a zero mean value over the 16 different dinucleotides, and will remain unchanged if going through the same conversion procedure again. Listed in Supplementary Table S2 of Supporting Information S3 are the values of
 obtained via the standard conversion of Equation (9) from those of Supplementary Table S1.
Support vector machine (SVM)
SVM is a machine-learning algorithm based on the statistical learning theory and has been successfully used in the realm of bioinformatics (see, e.g. (41,66,67)). The basic idea of SVM is to transform the input data into a high dimensional feature space and then determine the optimal separating hyperplane. A brief introduction about the formulation of SVM was given in (66,68). For more details about SVM, see a monograph (69). In the current study, the Libsvm package designed by Lin's lab (70) was used to implement SVM, which can be freely downloaded from http://www.csie.ntu.edu.tw/∼cjlin/libsvm/.
The DNA samples as formulated by Equation (4) were used as inputs for the SVM. It was observed that the radial basis function yielded better prediction results than the other kernel functions and hence was used in the current study. In the SVM operation engine, the regularization parameter C and the kernel width parameter γ were optimized via an optimization procedure using a grid search approach defined by
 |
(10) |
Performance evaluation
In evaluating the accuracy of a statistical predictor, two things are important. One is how to test the predictor, and the other is what kind metrics should be used to measure the accuracy.
Use jackknife cross-validation to test the prediction
As summarized in a review (71), three cross-validation test methods are often used in literature. They are independent data set test, sub-sampling (or K-fold cross-validation) test, and jackknife test. However, among the three methods, the jackknife test is deemed the least arbitrary and most objective because it can always yield a unique outcome for a given benchmark data set as elucidated in (33) and demonstrated by the equations (28)–(32) therein. Accordingly, the jackknife test has been increasingly used and widely recognized by investigators to examine the accuracy of various predictors (see, e.g. (55,56,72–75)). Accordingly, the jackknife test was also used to examine the performance of the model proposed in the current study.
Use a set of four metrics to measure the prediction quality
To provide a more intuitive and easier-to-understand method to measure the prediction quality, the following set of four metrics based on the formulation used by Chou (76) in studying signal peptide prediction was adopted. According to Chou's formulation, the sensitivity, specificity, overall accuracy and Matthews correlation coefficient can be expressed as (28,43,75,77)
 |
(11) |
where N+ is the total number of the σ54 promoter sequences investigated while  the number of σ54 promoter sequences incorrectly predicted as the non-σ54 promoter sequences; N– the total number of the non-σ54 promoter sequences investigated while
  the number of the non-σ54 promoter sequences incorrectly predicted as the σ54 promoter sequences.
According to Equation (11) we can easily see the following. When  meaning none of the σ54 promoter sequences was mispredicted to be a non-σ54 promoter sequences, we have the sensitivity Sn = 1; while
  meaning that all the σ54 promoter sequences were mispredicted to be the non-σ54 promoter sequences, we have the sensitivity Sn = 0. Likewise, when
  meaning none of the non-σ54 promoter sequences was mispredicted, we have the specificity Sp = 1; while
  meaning all the non-σ54 promoter sequences were incorrectly predicted as σ54 promoter sequences, we have the specificity Sp = 0. When
  meaning that none of the σ54 promoter sequences in the positive data set
  and none of the non-σ54 promoter sequences in the negative data set
  was incorrectly predicted, we have the overall accuracy Acc = 1; while
  meaning that all the σ54 promoter sequences in the positive data set and all the non- σ54 promoter sequences in the negative data set were mispredicted, we have the overall accuracy Acc = 0. The Matthews correlation coefficient MCC is usually used for measuring the quality of binary (two-class) classifications. When
  meaning that none of the σ54 promoter sequences in the positive data set and none of the non-σ54 promoter sequences in the negative data set was mispredicted, we have MCC = 1; when
  and
and  we have MCC = 0 meaning no better than random prediction; when
  and
and  we have MCC = –1 meaning total disagreement between prediction and observation. As we can see from the above discussion, it is much more intuitive and easier-to-understand when using Equation (11) to examine a predictor for its four metrics, particularly for its Mathew's correlation coefficient. It is instructive to point out that the metrics as defined in Equation (11) are valid for single-label systems only; for multi-label systems (78–81), a set of more complicated metrics should be used as given in (48).
Feature selection
With the increase of k and λ, the dimension of DPseKNC of Equation (4) used to represent the samples of DNA segments will increase rapidly, leading to the high-dimension disaster (50,82) in the following three unfavorable aspects: (i) the overfitting disadvantage that will make the predictor with a serious bias and extremely low capacity for generalization; (ii) the information redundancy or noise that will bring about the error of misrepresentation resulting in very poor prediction accuracy; (iii) unnecessarily increasing the computational time.
To deal with the high-dimension disaster, we utilized the feature selection technique to optimize the features included. Doing so not only can acquire a deeper insight into the intrinsic properties of promoter sequences, but also can improve the understandability, scalability and accuracy of the prediction model (83).
In the present study, we performed feature selection using the wrapper-type feature selection algorithm called F-score (84), by which the F-score of the i-th feature is defined by
 |
(12) |
where n+ is the total number of the positive samples, n– the total number of the negative samples,  is the mean value of the i-th feature of the entire positive samples,
  that of the entire negative samples, and
  the mean value of the total samples,
  represents the i-th feature of the k-th sample in the positive data set, and
  the i-th feature of the k-th sample in the negative data set.
Obviously, the larger the Fi-score is, the higher discriminative capability the i-th feature will be. Thus, all features can be ranked based on their F-score values. Based on the features thus ranked, we used the incremental feature selection (IFS) to determine the optimal number of feature as described below. The feature subset starts from a feature with the highest F-score. A new feature subset was composed when the feature with the second highest F-score was added. We repeated this process by adding features sequentially from higher to lower rank until all candidate features are added. Thus, the N feature sets thus formed would be composed of N ranked features. The τ-th feature set can be formulated as
 |
(13) |
For each of such N feature sets, an SVM prediction model was constructed and examined by the jackknife test on the benchmark data set. By doing so, we obtained an IFS curve in a 2D Cartesian coordinate system with index τ as the abscissa (or X-coordinate), and the overall success rate as the ordinate (or Y-coordinate). The optimal feature set is expressed as
 |
(14) |
with which the IFS curve reaches its peak. In other words, in the 2D coordinate system, when X = Φ the overall success rate reaches its maximum.
RESULTS AND DISCUSSIONS
Parameter optimization
As we can see from Equations (4) and (5), the results of the current predictor will depend on three parameters, k, λ and w, where k reflects the local or short-range sequence order effect, λ represents the tiers counted for the global or long-range sequence order effect, and w is the factor to reflect the weight imposed between the local and global effects that is usually within the range from 0 to 1. Generally speaking, the greater the k is, the more local sequence-order information the model contains, while the greater the λ is, the more global sequence-order information it contains. However, if k or λ is too large, it would cause the high-dimension disaster as mentioned above. Therefore, our searching for the optimal values of the three parameters were carried out in the following regions
 |
(15) |
As we can see from Equation (15), a total of  individual combinations (or points in the 3D parameter space) needed to be considered for finding the optimal parameter combination. This was actually a routine but tedious process to optimize the model via a 3D grid search. To reduce the computational time, we primarily used the 10-fold cross-validation approach to deal with the parameter optimization. Once the optimal values for the three parameters were determined, the rigorous jackknife test was performed to evaluate the success rates of the predictor according to the four metrics as defined in Equation (11). The results thus obtained in identifying σ54 promoters are summarized by
 |
(16) |
Feature optimization
As we can see from Equation (16), when  and
and  meaning when the 7-tuple nucleotide composition and 40 additional components (cf. Equations (4) and (5)) were used to incorporate the local and global sequence order informations, respectively, an optimal state was found for the current model. On the other hand, as we can see from Equation (4), the dimension for the PseKNC vector with
  and
and  would be
  , which is still too large to avoid the high-dimension problems mentioned above.
Therefore, it is necessary to select the key ones from the 16 424 components according to the procedures as described in Section 2.6, where the F-score was calculated through a simple python script, called ‘fselect.py’, which can be freely downloaded from http://www.csie.ntu.edu.tw/∼cjlin/libsvmtools/.
By means of the above feature selection procedure, the number of components for the PseKNC vector was reduced from 16 424 to 2056, of which 2036 belonged to the local sequence order information, while 20 to the global one.
Furthermore, we used the binomial distribution (82) to judge the confidence level (CL) of the 2036 local sequence components. If the CL of a 7-tuple nucleotide was greater than 90%, its occurrence was not a random event (82), and hence the component corresponding to such a heptamer was kept; otherwise, left out. By doing so, the 2036 local sequence components were further reduced to 263.
Finally, the key components for the PseKNC vector were reduced to  , of which 263 reflecting the short-range or local sequence order effects, while 20 for the long-range or global sequence order effect. The details about the 283 key components are given in Supporting Information S4.
The predictor obtained via the above procedures is called ‘iPro54-PseKNC’, where ‘i’ means identify, ‘Pro54′ means ‘σ54 promoter’, and ‘PseKNC’ means ‘pseudo k-tuple nucleotide composition’.
The final jackknife test results obtained by iPro54-PseKNC on the benchmark data set  (see Supporting Information S1) are as follows
 |
(17) |
Furthermore, to show the performance of the current model across the entire range of SVM decision values, the ROC (receiver operating characteristic) curve was also calculated by the jackknife tests. It was found that the area under the ROC curve (or AUROC) was 0.9825, indicating that the model is quite robust.
Features analysis
To provide an overall and intuitive view, the following normalized function was introduced to scale the F-score of the i-th feature
 |
(18) |
where Fmin and Fmax are the minimum and maximum F-score of all the features concerned. Thus, we have  .
.
To analyze the contributions of different heptamers in the prediction model, a heat map (85) was provided (Figure 2), which is a graphical representation of a matrix where the elements represent the features and are encoded using different colors according to their  values. As we can see from Figure 2a, although there exist 47 = 16 384 different heptamers, the majority of them have very small
  values, indicating that the corresponding features are irrelevant with the promoter recognition. By analyzing the relevant heptamers, we have found that they possess some consensus motifs. For example, the heptamers TGGCACG, CTGGCAC and TGGCACA are with the F-scores ranking top three among all the features and with the confidence level of
  always occurring around the -24 element. Around the -12 element, we have also found the regulatory sequences TTGCTTT, TATTGCT, ATTGCTT are with the CL > 98.44%. All these observations are fully in accordance with the reports from (1,24,25,86,87).
Figure 2.

A heat map to describe the F-scores of (a) the 16 384 different heptamers, and (b) the 40 different global factors as defined in the second sub-equation of Equation (5). The color scale is ranged from blue (low) through green and yellow to red (high). See the main text for further explanation. A higher resolution version can be found at http://lin.uestc.edu.cn/server/iPro54PseKNC/heatmap.jpg.
Meanwhile, the heat map graphical technique was also used to analyze the long-rang factors (cf. the second sub-equation of Equation (5)). As we can see from Figure 2b, when λ = 2, 8, 9, 10, 14, 16, 17, 18, 20, 21, 23, 24, 25, 26, 27, 29, 30, 31, 38 and 39, the corresponding  values are much higher than the remaining ones, indicating that such 20 factors are more important in reflecting global sequence order effects for identifying the σ54 promoters, particularly the three long-range factors with λ =17, 23 and 24.
To further investigate the sequence mode in σ54 promoters, the MEME (Multiple Em for Motif Elicitation) (88) was used to discover the consensus motifs in σ54 promoters. As we can see from Figure 3, the consensus sequence [CT]TGGCA[CT][GA]NNNN[TC]TGC[AT][TA] was found by MEME. By comparing with the optimized heptamers obtained from the feature selection technique, it is exciting to see that the -24 and -12 elements obtained by MEME are fully consistent with the feature selection findings, clearly demonstrating that the feature selection technique is very useful for the feature analysis, and that the optimized features reported here are appropriate for σ54 promoter prediction.
Figure 3.

The MEME frequency plot to show consensus motifs of the -24 elements and -12 elements of σ54 promoters.
In order for in-depth analyzing the optimized heptamers, 60 heptamers were singled out as the most important features that had  . Of the 60 heptamers, 50 are often presented in the σ54 promoter sequences (Figure 4a, b, c), and the other 10 are not (Figure 4d). In other words, the 50 heptamers are positively correlated with σ54 promoters while the other 10 heptamers are negatively correlated with σ54 promoters. Interestingly, 23 of the 50 positive correlation heptamers are -24 elements (Figure 4a), while 12 of the 50 positive correlation heptamers are -12 elements (Figure 4b). The remaining 15 positive correlation heptamers (Figure 4c) maybe play other important roles in the interaction between RNAP with promoter sequences. It is instructive to note that the positive correlated heptamers are AT-rich, whereas the negative correlation heptamers are GC-rich elements, implying that the structure of promoters will affect RNA polymerase binding. This is because the lack of GC-rich elements often results in the unstable local secondary structure, which can be opened by RNA holoenzyme (89). Of course, it would also be possible that many additional unknown factors might exist to enhance or inhibit the promoter's activity. And this will be a new research point in future work.
Figure 4.

A histogram to show the different heptamers between the σ54 promoters and the non-σ54 promoters: (a) heptamers belonging to the -24 element; (b) those belonging to the -12 element; (c) those belonging to neither the -24 element nor the -12 element; (d) those barely appearing in the σ54 promoters.
A question might be raised as asking why heptamers could affect predictive performance so much. This question can be addressed by noting the following three facts: (i) most of transcription factor binding sites are sequences with length ≥7; (ii) a large portion of the whole set of heptamers are non-motifs that can be excluded by feature selection technique; (iii) it has been reported that the distance of regulatory heptamer elements is conserved in promoters (90).
Distance distribution between TSS and TIS
It is instructive to calculate the distances between TSS and translation initiation site (TIS) of all σ54 promoters and plotted them into a histogram (Figure 5) to exhibit their distribution. We have found that 80% of TSSs are located within 150 bp upstream from TISs, and the maximum distance is 402 bp. The mean of the distances between TSSs and TISs is about 90 bp while the standard deviation is about 76 bp.
Figure 5.

A probability distribution curve to describe the distance between transcription start site (TSS) and translation initiation site (TIS) of σ54 promoters. It has been found that the gamma distribution with 1.7 as its shape parameter and 52.5 as its scale parameter can best fit the distance between TSS and TIS.
According to modern genetics, the driving force of nucleotide sequence evolution is the random mutation of bases on the basis of the natural selection (91). The information stored in genomes is maximized under a set of constraint conditions. Hence, the distance distribution from TSS to TIS should also obey the maximum information principle by maximizing the entropy under certain constraints. The information entropy of the distance distribution  can be expressed as
 |
(19) |
For any probability distribution, we have the normalization constraint; i.e.
 |
(20) |
In the natural world, the total of all distances between TSS and TIS should be a constant, suggesting that the arithmetic mean of these distances should also be a constant. Thus we have the second constraint for  as given by
 |
(21) |
According to the z-curve theory (92), any points in the z-curve of a DNA sequence will be located in a sphere on the 3D space, suggesting that the distance will obey a geometric constraint as well. Thus, the geometric mean of the distance distribution will impose the third constraint on  . Moreover, the geometric mean can avoid the influence of the rare event that TSS is too far away from TIS. To convert multiplication to addition, let us calculate the geometric mean via the logarithm function; i.e.
 |
(22) |
Now, according to Lagrange multiplier method, we have
 |
(23) |
where δ is the operator to take the partial derivative on the variable right after it, while C1, C2 and C3 are the undetermined coefficients. From Equation (23), it follows
 |
(24) |
where the coefficients C1, C2 and C3 can be determined via the three constraints as given by Equations (20)–(22). By using the constraint of Equation (20), we obtain
 |
(25) |
where  ,
,  , and
, and  is gamma function. Thus, the distribution function
  can be expressed as
 |
(26) |
The above equation indicates that  is a gamma distribution function with the shape shown in Figure 5. Its shape parameter is
  and scale parameter
  .
.
Now we can draw the conclusion that, when the information entropy reaches its maximum, the distance distribution from TSS to TIS of σ54 promoters must obey a gamma distribution. This is a very interesting discovery, which can actually provide a fundamental physical principle for the study of σ54 promoters.
It was reported that the gamma distribution could also be used to describe the distributions of protein length (93), hexamer occurrence frequency in microbial genomes (94) and codon-pair frequency (95). Our finding is fully consistent with these reports.
Life is a special occasion, which always avoids the minimum and maximum. In view of this, the gamma distribution is very likely a kind of basic distribution in life. We anticipate that the current report will stimulate more experiments to prove such a deduction.
Prediction of σ54 promoters in prokaryotic genome
In order to further test the prediction accuracy of our method in genome, we collected six σ54 promoters with experimental-mapped TSS from updated RegulonDB. They are independent from train data set. As mentioned before, the maximum distance between TSS and TIS is 402 bp. It has been also reported that the accuracy of TIS in prokaryotic genome is higher than 90%. Based on the two points, by using the BLAST program, we mapped the six σ54 promoters into their genomes and extracted six sequence fragments, of which each fragment has the length of 500 bp from −480 to +19 bp with the TIS at their between (i.e. the site of 0 bp).
Subsequently, we searched for the σ54 promoters using iPro54-PseKNC in the six fragments. By using the sliding window method (96) with a window size of 81bp and a step of 1bp, each fragment will be divided into 500−81 = 419 subsequences corresponding to 419 potential TSS positions located in the 61th positions. Then we calculated the probability belonging to the promoters of each subsequence. The probabilities with positions were drawn in Figure 6. We noticed that, in five of its six panels (i.e. Figure 6a,b,c,e,f), the probabilities around the true TSSs are close to 1, suggesting that these regions are easily bound by RNAp and other regulators due to the occurrence of some consensus sequences. Thus, they can be regarded as correctly predicted σ54 promoters. The distances between the probability peaks with true TSSs are only 33bp, 18bp, 1bp, 18bp and 30bp (Figure 6a,b,c,e,f), respectively. For the promoter nifAp (Figure 6d), we noticed that the distance between the predictive probability peak and the true TSS is 300bp. However, TSSs usually do not occur in coding regions. If we only consider the prediction in intergenic regions, the position (Figure 6d) with a probability peak is only 42bp, which is not far from the true TSS. Compared with the previous work (97) in which a site was deemed as a true TSS when it was predicted locating at the region upstream 150bp or downstream 50bp of a true TSS, our method is much more accurate and catch the real features of σ54 promoters.
Figure 6.
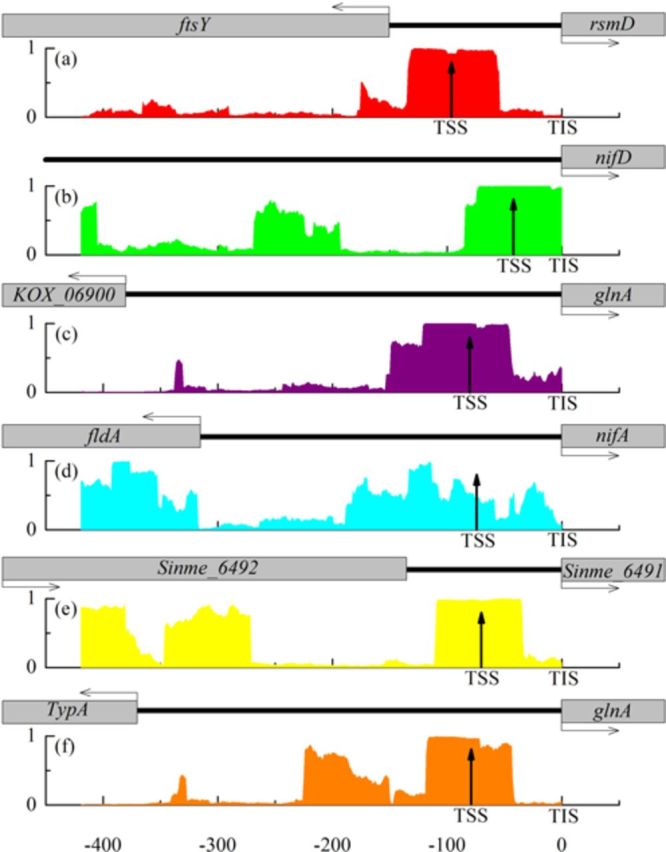
The predicted results by iPro54-PseKNC on the six experimental-confirmed σ54 promoters. (a) Promoter name: rsmDp; specie: Escherichia coli K-12 MG1655; gene name: rsmD; TIS position: 3602416 in the forward strand; TSS position: 3602320. (b) Promoter name: nifDp; specie: Bradyrhizobium japonicum USDA 110; gene name: nifD; TIS position: 1907825 in the forward strand; TSS position: 1907783. (c) Promoter name: glnAp; specie: Klebsiella oxytoca KCTC 1686; gene name: glnA; TIS position: 1445478 in the reverse strand; TSS position: 1445558. (d) Promoter name: nifAp; specie: Klebsiella oxytoca KCTC 1686; gene name: nifA; TIS position: 5380473 in the forward strand; TSS position: 5380399. (e) Promoter name: P1; specie: Sinorhizobium meliloti AK83; gene name: Sinme_6491; TIS position: 1208909 in the reverse strand; TSS position: 1208979. (f) Promoter name: glnAp; specie: Salmonella enterica subsp. serovar Heidelberg str. CFSAN002069; gene name: glnA; TIS position: 4657888 in the reverse strand; TSS position: 4657967. The up arrows represent true TSSs. The gray square frames represent the genes, in which the horizontal arrows represent the directions of transcriptions. The thick blank lines represent the intergenic regions.
Moreover, we also collected 20 σ54 promoters of 10 different species from Genbank. Although the -24 and -12 elements of these promoters had been mapped, their TSSs are not be found by experiments yet. Using BLAST program we mapped these promoters into their genomes and extracted 20 sequence fragments, each of which has the length of 500 bp from −480 to +19 bp with the TIS at their between (i.e. the site of 0 bp). Subsequently, we used iPro54-PseKNC to scan the 20 DNA fragments with the similar procedure, and the results thus obtained are given in Supporting Information S5. It can be clearly seen from there that the probabilities around -24 and -12 elements for most of the promoters are very close to 1, once again indicating that iPro54-PseKNC is indeed a very powerful high throughput tool for predicting σ54 promoters.
Web-server guide or protocol
For the convenience of the vast majority of experimental scientists, a web-server for the iPro54-PseKNC predictor was established. Furthermore, a step-by-step guide on how to use the web-server to is given as follows.
Step 1. Open the web server at http://lin.uestc.edu.cn/server/iPro54-PseKNC and you will see the top page of iPro54-PseKNC on your computer screen, as shown in Figure 7. Click on the Read Me button to see a brief introduction about the predictor and the caveat when using it.
Figure 7.

A semi-screenshot for the top page of the iPro54-PseKNC web-server at http://lin.uestc.edu.cn/server/iPro54-PseKNC.
Step 2. Either type or copy/paste the query DNA sequences into the input box at the center of Figure 7. The input sequence should be in the FASTA format. Example sequences in FASTA format can be seen by clicking on the Example button right above the input box.
Step 3. Click on the Submit button to see the predicted result. If you use the three sequence samples in the Example window as an input, after clicking the Submit button, you will see the following outcomes shown on the screen of your computer. (i) The Example-1 query sequence contains 81 bp and is identified belonging to ‘promoter’. (ii) The Example-2 query sequence contains 81 bp and is identified belonging to ‘non-promoter’. (iii) The Example-3 query sequence contains 500 bp and hence has  sub-sequences, of which only those from #265–266 and those from #306–385 are ‘promoter’ but all the others are ‘non-promoter’. All these results are fully consistent with the experimental observations. It only takes about few seconds for the above computation before the predicted results appear on your computer screen.
Step 4. Click on the Data button to download the benchmark data sets used to train and test the iPro54-PseKNC predictor.
Step 5. Click on the Citation button to find the relevant papers that document the detailed development and algorithm of iPro54-PseKNC.Caveats. Each of the input query sequences must be 81 bp or longer and only contains valid characters: ‘A’, ‘C’, ‘G’, ‘T’.
CONCLUSION
Using the k-tuple nucleotide composition and pseudo oligonucleotide composition to incorporate, respectively, the local and global sequence-order informations, a predictor called iPro54-PseKNC was developed for identifying the σ54 promoters. In the predictor, the feature selection technique was used to winnow out the key features. It was observed that the key features thus obtained did really represent the regulatory motifs in σ54 promoter sequences.
The rates achieved by the predictor were over 90%, 97%, 93% and 0.87 in sensitivity, specificity, accuracy and Matthews correlation coefficient, respectively. These results were derived by the rigorous jackknife tests on a stringent benchmark data set in which none of the DNA fragment samples had  pairwise sequence identity to any other in a same subset.A basic physical principle for the study of σ54 promoters was revealed through an in-depth statistical analysis that the distribution of distances between the transcription start sites and the translation initiation sites were governed by the gamma distribution, which may become a fundamental physical principle for the study of σ54 promoters.
SUPPLEMENTARY DATA
Supplementary Data are available at NAR Online.
Acknowledgments
The authors are very much indebted to the three anonymous reviewers, whose constructive comments are very helpful for strengthening the presentation of this paper.
FUNDING
National Nature Scientific Foundation of China [61202256, 61301260, 61100092]; the Fundamental Research Funds for the Central Universities [ZYGX2012J113, ZYGX2013J102]; the Nature Scientific Foundation of Hebei Province [C2013209105]. Funding for open access charge: National Nature Scientific Foundation of China [61202256, 61301260, 61100092]; the Fundamental Research Funds for the Central Universities [ZYGX2012J113, ZYGX2013J102]; the Nature Scientific Foundation of Hebei Province [C2013209105].
Conflict of interest statement. None declared.
REFERENCES
- 1.Barrios H., Valderrama B., Morett E. Compilation and analysis of sigma(54)-dependent promoter sequences. Nucleic Acids Res. 1999;27:4305–4313. doi: 10.1093/nar/27.22.4305. [DOI] [PMC free article] [PubMed] [Google Scholar]
- 2.Lonetto M., Gribskov M., Gross C.A. The sigma 70 family: sequence conservation and evolutionary relationships. J. Bacteriol. 1992;174:3843–3849. doi: 10.1128/jb.174.12.3843-3849.1992. [DOI] [PMC free article] [PubMed] [Google Scholar]
- 3.Helmann J.D., Chamberlin M.J. Structure and function of bacterial sigma factors. Ann. Rev. Biochem. 1988;57:839–872. doi: 10.1146/annurev.bi.57.070188.004203. [DOI] [PubMed] [Google Scholar]
- 4.Hawley D.K., McClure W.R. Compilation and analysis of Escherichia coli promoter DNA sequences. Nucleic Acids Res. 1983;11:2237–2255. doi: 10.1093/nar/11.8.2237. [DOI] [PMC free article] [PubMed] [Google Scholar]
- 5.Arora S.K., Ritchings B.W., Almira E.C., Lory S., Ramphal R. A transcriptional activator, FleQ, regulates mucin adhesion and flagellar gene expression in Pseudomonas aeruginosa in a cascade manner. J. Bacteriol. 1997;179:5574–5581. doi: 10.1128/jb.179.17.5574-5581.1997. [DOI] [PMC free article] [PubMed] [Google Scholar]
- 6.Maingon R., Feliciangeli D., Ward R., Chance M., Adamson R., Rodriguez N., Convit J., Petralanda I., Hernandez A., Segovia M. Molecular approaches applied to the epidemiology of leishmaniasis in Venezuela. Arc. Inst. Pasteur Tunis. 1993;70:309–324. [PubMed] [Google Scholar]
- 7.Bernardo L.M., Johansson L.U., Skarfstad E., Shingler V. sigma54-promoter discrimination and regulation by ppGpp and DksA. J. Biolog. Chem. 2009;284:828–838. doi: 10.1074/jbc.M807707200. [DOI] [PubMed] [Google Scholar]
- 8.Wigneshweraraj S., Bose D., Burrows P.C., Joly N., Schumacher J., Rappas M., Pape T., Zhang X., Stockley P., Severinov K., et al. Modus operandi of the bacterial RNA polymerase containing the sigma54 promoter-specificity factor. Mol. Microbiol. 2008;68:538–546. doi: 10.1111/j.1365-2958.2008.06181.x. [DOI] [PubMed] [Google Scholar]
- 9.Kustu S., Santero E., Keener J., Popham D., Weiss D. Expression of sigma 54 (ntrA)-dependent genes is probably united by a common mechanism. Microbiol. Rev. 1989;53:367–376. doi: 10.1128/mr.53.3.367-376.1989. [DOI] [PMC free article] [PubMed] [Google Scholar]
- 10.Gardan R., Rapoport G., Debarbouille M. Expression of the rocDEF operon involved in arginine catabolism in Bacillus subtilis. J. Mol. Biol. 1995;249:843–856. doi: 10.1006/jmbi.1995.0342. [DOI] [PubMed] [Google Scholar]
- 11.Zielinski N.A., Maharaj R., Roychoudhury S., Danganan C.E., Hendrickson W., Chakrabarty A.M. Alginate synthesis in Pseudomonas aeruginosa: environmental regulation of the algC promoter. J. Bacteriol. 1992;174:7680–7688. doi: 10.1128/jb.174.23.7680-7688.1992. [DOI] [PMC free article] [PubMed] [Google Scholar]
- 12.Cases I., Ussery D.W., de Lorenzo V. The sigma54 regulon (sigmulon) of Pseudomonas putida. Environ. Microbiol. 2003;5:1281–1293. doi: 10.1111/j.1462-2920.2003.00528.x. [DOI] [PubMed] [Google Scholar]
- 13.Li Q.Z., Lin H. The recognition and prediction of sigma70 promoters in Escherichia coli K-12. J. Theor. Biol. 2006;242:135–141. doi: 10.1016/j.jtbi.2006.02.007. [DOI] [PubMed] [Google Scholar]
- 14.Janky R., van Helden J. Evaluation of phylogenetic footprint discovery for predicting bacterial cis-regulatory elements and revealing their evolution. BMC Bioinformatics. 2008;9:37. doi: 10.1186/1471-2105-9-37. [DOI] [PMC free article] [PubMed] [Google Scholar]
- 15.Satija R., Pachter L., Hein J. Combining statistical alignment and phylogenetic footprinting to detect regulatory elements. Bioinformatics. 2008;24:1236–1242. doi: 10.1093/bioinformatics/btn104. [DOI] [PubMed] [Google Scholar]
- 16.Abeel T., Saeys Y., Bonnet E., Rouze P., de Peer Y. Generic eukaryotic core promoter prediction using structural features of DNA. Genome Res. 2008;18:310–323. doi: 10.1101/gr.6991408. [DOI] [PMC free article] [PubMed] [Google Scholar]
- 17.Abeel T., Saeys Y., Rouze P., Van de Peer Y. ProSOM: core promoter prediction based on unsupervised clustering of DNA physical profiles. Bioinformatics. 2008;24:i24–i31. doi: 10.1093/bioinformatics/btn172. [DOI] [PMC free article] [PubMed] [Google Scholar]
- 18.Lin H., Li Q.Z. Eukaryotic and prokaryotic promoter prediction using hybrid approach. Theory Biosci. 2011;130:91–100. doi: 10.1007/s12064-010-0114-8. [DOI] [PubMed] [Google Scholar]
- 19.Song K. Recognition of prokaryotic promoters based on a novel variable-window Z-curve method. Nucleic Acids Res. 2012;40:963–971. doi: 10.1093/nar/gkr795. [DOI] [PMC free article] [PubMed] [Google Scholar]
- 20.Wu Q., Wang J., Yan H. An Improved Position Weight Matrix method based on an entropy measure for the recognition of prokaryotic promoters. Int. J. Data Min. Bioinform. 2011;5:22–37. doi: 10.1504/ijdmb.2011.038575. [DOI] [PubMed] [Google Scholar]
- 21.Mallios R.R., Ojcius D.M., Ardell D.H. An iterative strategy combining biophysical criteria and duration hidden Markov models for structural predictions of Chlamydia trachomatis sigma66 promoters. BMC Bioinformatics. 2009;10:271. doi: 10.1186/1471-2105-10-271. [DOI] [PMC free article] [PubMed] [Google Scholar]
- 22.Demeler B., Zhou G.W. Neural network optimization for E. coli promoter prediction. Nucleic Acids Res. 1991;19:1593–1599. doi: 10.1093/nar/19.7.1593. [DOI] [PMC free article] [PubMed] [Google Scholar]
- 23.Zuo Y.C., Li Q.Z. The hidden physical codes for modulating the prokaryotic transcription initiation. Physica A: Stat. Mechanics Appl. 2010;389:4217–4223. [Google Scholar]
- 24.Ranawana R., Palade V. A neural network based multi-classifier system for gene identification in DNA sequences. Neural Comput. Appl. 2005;14:122–131. [Google Scholar]
- 25.de Avila E.S.S., Forte F., I T.S.S., Andrighetti T., G J.L.G., Longaray Delamare A.P., Echeverrigaray S. DNA duplex stability as discriminative characteristic for Escherichia coli sigma- and sigma- dependent promoter sequences. Biologicals. 2014;42:22–28. doi: 10.1016/j.biologicals.2013.10.001. [DOI] [PubMed] [Google Scholar]
- 26.Chou K.C., Shen H.B. Review: Recent progresses in protein subcellular location prediction. Anal. Biochem. 2007;370:1–16. doi: 10.1016/j.ab.2007.07.006. [DOI] [PubMed] [Google Scholar]
- 27.Zhou X., Li Z., Dai Z., Zou X. Predicting promoters by pseudo-trinucleotide compositions based on discrete wavelets transform. J. Theor. Biol. 2013;319:1–7. doi: 10.1016/j.jtbi.2012.11.024. [DOI] [PubMed] [Google Scholar]
- 28.Chen W., Feng P.M., Lin H. iRSpot-PseDNC: identify recombination spots with pseudo dinucleotide composition. Nucleic Acids Res. 2013;41:e69. doi: 10.1093/nar/gks1450. [DOI] [PMC free article] [PubMed] [Google Scholar]
- 29.Liu B., Zhang D., Xu R., Xu J., Wang X., Chen Q. Combining evolutionary information extracted from frequency profiles with sequence-based kernels for protein remote homology detection. Bioinformatics. 2014;30:472–479. doi: 10.1093/bioinformatics/btt709. [DOI] [PMC free article] [PubMed] [Google Scholar]
- 30.Xu Y., Wen X., Wen L.S., Wu L.Y., Deng N.Y. iNitro-Tyr: Prediction of nitrotyrosine sites in proteins with general pseudo amino acid composition. PLoS One. 2014;9:e105018. doi: 10.1371/journal.pone.0105018. [DOI] [PMC free article] [PubMed] [Google Scholar]
- 31.Guo S.H., Deng E.Z., Xu L.Q., Ding H., Lin H., Chen W. iNuc-PseKNC: a sequence-based predictor for predicting nucleosome positioning in genomes with pseudo k-tuple nucleotide composition. Bioinformatics. 2014;30:1522–1529. doi: 10.1093/bioinformatics/btu083. [DOI] [PubMed] [Google Scholar]
- 32.Chen W., Feng P.M., Deng E.Z., Lin H. iTIS-PseTNC: a sequence-based predictor for identifying translation initiation site in human genes using pseudo trinucleotide composition. Anal. Biochem. 2014;462:76–83. doi: 10.1016/j.ab.2014.06.022. [DOI] [PubMed] [Google Scholar]
- 33.Chou K.C. Some remarks on protein attribute prediction and pseudo amino acid composition (50th Anniversary Year Review) J. Theor. Biol. 2011;273:236–247. doi: 10.1016/j.jtbi.2010.12.024. [DOI] [PMC free article] [PubMed] [Google Scholar]
- 34.Salgado H., Peralta-Gil M., Gama-Castro S., Santos-Zavaleta A., Muniz-Rascado L., Garcia-Sotelo J.S., Weiss V., Solano-Lira H., Martinez-Flores I., Medina-Rivera A., et al. RegulonDB v8.0: omics data sets, evolutionary conservation, regulatory phrases, cross-validated gold standards and more. Nucleic Acids Res. 2013;41:D203–D213. doi: 10.1093/nar/gks1201. [DOI] [PMC free article] [PubMed] [Google Scholar]
- 35.Chou K.C. Some remarks on protein attribute prediction and pseudo amino acid composition. J. Theor. Biol. 2011;273:236–247. doi: 10.1016/j.jtbi.2010.12.024. [DOI] [PMC free article] [PubMed] [Google Scholar]
- 36.Ding H., Guo S.H., Deng E.Z., Yuan L.F., Guo F.B., Huang J., Rao N., Chen W., Lin H. Prediction of Golgi-resident protein types by using feature selection technique. Chemometrics Intell. Lab. Syst. 2013;124:9–13. [Google Scholar]
- 37.Li W., Godzik A. Cd-hit: a fast program for clustering and comparing large sets of protein or nucleotide sequences. Bioinformatics. 2006;22:1658–1659. doi: 10.1093/bioinformatics/btl158. [DOI] [PubMed] [Google Scholar]
- 38.Zhang C.T. An optimization approach to predicting protein structural class from amino acid composition. Protein Sci. 1992;1:401–408. doi: 10.1002/pro.5560010312. [DOI] [PMC free article] [PubMed] [Google Scholar]
- 39.Chen W., Lin H., Feng P.M., Ding C., Zuo Y.C. iNuc-PhysChem: A Sequence-Based Predictor for Identifying Nucleosomes via Physicochemical Properties. PLoS One. 2012;7:e47843. doi: 10.1371/journal.pone.0047843. [DOI] [PMC free article] [PubMed] [Google Scholar]
- 40.Feng K.Y., Cai Y.D. Boosting classifier for predicting protein domain structural class. Biochem. Biophys. Res. Commun. 2005;334:213–217. doi: 10.1016/j.bbrc.2005.06.075. [DOI] [PubMed] [Google Scholar]
- 41.Feng P.M., Chen W., Lin H. iHSP-PseRAAAC: Identifying the heat shock protein families using pseudo reduced amino acid alphabet composition. Anal. Biochem. 2013;442:118–125. doi: 10.1016/j.ab.2013.05.024. [DOI] [PubMed] [Google Scholar]
- 42.Kandaswamy K.K., Martinetz T., Moller S., Suganthan P.N., Sridharan S., Pugalenthi G. AFP-Pred: A random forest approach for predicting antifreeze proteins from sequence-derived properties. J. Theor. Biol. 2011;270:56–62. doi: 10.1016/j.jtbi.2010.10.037. [DOI] [PubMed] [Google Scholar]
- 43.Xu Y., Ding J., Wu L.Y. iSNO-PseAAC: Predict cysteine S-nitrosylation sites in proteins by incorporating position specific amino acid propensity into pseudo amino acid composition. PLoS One. 2013;8:e55844. doi: 10.1371/journal.pone.0055844. [DOI] [PMC free article] [PubMed] [Google Scholar]
- 44.Cai Y.D. Predicting subcellular localization of proteins in a hybridization space. Bioinformatics. 2004;20:1151–1156. doi: 10.1093/bioinformatics/bth054. [DOI] [PubMed] [Google Scholar]
- 45.Xiao X., Min J.L., Wang P. iGPCR-Drug: A web server for predicting interaction between GPCRs and drugs in cellular networking. PLoS One. 2013;8:e72234. doi: 10.1371/journal.pone.0072234. [DOI] [PMC free article] [PubMed] [Google Scholar]
- 46.Shen H.B. Predicting protein fold pattern with functional domain and sequential evolution information. J. Theor. Biol. 2009;256:441–446. doi: 10.1016/j.jtbi.2008.10.007. [DOI] [PubMed] [Google Scholar]
- 47.Xiao X., Min J.L., Wang P. iCDI-PseFpt: Identify the channel-drug interaction in cellular networking with PseAAC and molecular fingerprints. J. Theor. Biol. 2013;337:71–79. doi: 10.1016/j.jtbi.2013.08.013. [DOI] [PubMed] [Google Scholar]
- 48.Chou K.C. Some Remarks on Predicting Multi-Label Attributes in Molecular Biosystems. Mol. Biosyst. 2013;9:1092–1100. doi: 10.1039/c3mb25555g. [DOI] [PubMed] [Google Scholar]
- 49.Wang M., Yang J., Xu Z.J. SLLE for predicting membrane protein types. J. Theor. Biol. 2005;232:7–15. doi: 10.1016/j.jtbi.2004.07.023. [DOI] [PubMed] [Google Scholar]
- 50.Wang T., Yang J., Shen H.B. Predicting membrane protein types by the LLDA algorithm. Protein Pept. Lett. 2008;15:915–921. doi: 10.2174/092986608785849308. [DOI] [PubMed] [Google Scholar]
- 51.Chou K.C. A key driving force in determination of protein structural classes. Biochem. Biophys. Res. Commun. 1999;264:216–224. doi: 10.1006/bbrc.1999.1325. [DOI] [PubMed] [Google Scholar]
- 52.Chou K.C. Prediction of protein cellular attributes using pseudo amino acid composition. Proteins (Erratum: ibid., 2001, Vol.44, 60) 2001;43:246–255. doi: 10.1002/prot.1035. [DOI] [PubMed] [Google Scholar]
- 53.Chou K.C. Using amphiphilic pseudo amino acid composition to predict enzyme subfamily classes. Bioinformatics. 2005;21:10–19. doi: 10.1093/bioinformatics/bth466. [DOI] [PubMed] [Google Scholar]
- 54.Lin S.X., Lapointe J. Theoretical and experimental biology in one. J. Biomed. Sci. Eng. 2013;6:435–442. [Google Scholar]
- 55.Chen Y.K., Li K.B. Predicting membrane protein types by incorporating protein topology, domains, signal peptides, and physicochemical properties into the general form of Chou's pseudo amino acid composition. J. Theor. Biol. 2013;318:1–12. doi: 10.1016/j.jtbi.2012.10.033. [DOI] [PubMed] [Google Scholar]
- 56.Hajisharifi Z., Piryaiee M., Beigi M., Behbahani M., Mohabatkar H. Predicting anticancer peptides with Chou's pseudo amino acid composition and investigating their mutagenicity via Ames test. J. Theor. Biol. 2014;341:34–40. doi: 10.1016/j.jtbi.2013.08.037. [DOI] [PubMed] [Google Scholar]
- 57.Nanni L., Brahnam S., Lumini A. Prediction of protein structure classes by incorporating different protein descriptors into general Chou's pseudo amino acid composition. J. Theor. Biol. 2014;360:109–116. doi: 10.1016/j.jtbi.2014.07.003. [DOI] [PubMed] [Google Scholar]
- 58.Du P., Gu S., Jiao Y. PseAAC-General: Fast building various modes of general form of Chou's pseudo-amino acid composition for large-scale protein datasets. Int. J. Mol. Sci. 2014;15:3495–3506. doi: 10.3390/ijms15033495. [DOI] [PMC free article] [PubMed] [Google Scholar]
- 59.Du P., Wang X., Xu C., Gao Y. PseAAC-Builder: A cross-platform stand-alone program for generating various special Chou's pseudo-amino acid compositions. Anal. Biochem. 2012;425:117–119. doi: 10.1016/j.ab.2012.03.015. [DOI] [PubMed] [Google Scholar]
- 60.Cao D.S., Xu Q.S., Liang Y.Z. propy: a tool to generate various modes of Chou's PseAAC. Bioinformatics. 2013;29:960–962. doi: 10.1093/bioinformatics/btt072. [DOI] [PubMed] [Google Scholar]
- 61.Goni J.R., Perez A., Torrents D., Orozco M. Determining promoter location based on DNA structure first-principles calculations. Genome Biol. 2007;8:R263. doi: 10.1186/gb-2007-8-12-r263. [DOI] [PMC free article] [PubMed] [Google Scholar]
- 62.Goni J.R., Fenollosa C., Perez A., Torrents D., Orozco M. DNAlive: a tool for the physical analysis of DNA at the genomic scale. Bioinformatics. 2008;24:1731–1732. doi: 10.1093/bioinformatics/btn259. [DOI] [PubMed] [Google Scholar]
- 63.Miele V., Vaillant C., d'Aubenton-Carafa Y., Thermes C., Grange T. DNA physical properties determine nucleosome occupancy from yeast to fly. Nucleic Acids Res. 2008;36:3746–3756. doi: 10.1093/nar/gkn262. [DOI] [PMC free article] [PubMed] [Google Scholar]
- 64.Brick K., Watanabe J., Pizzi E. Core promoters are predicted by their distinct physicochemical properties in the genome of Plasmodium falciparum. Genome Biol. 2008;9:R178. doi: 10.1186/gb-2008-9-12-r178. [DOI] [PMC free article] [PubMed] [Google Scholar]
- 65.Duran E., Djebali S., Gonzalez S., Flores O., Mercader J.M., Guigo R., Torrents D., Soler-Lopez M., Orozco M. Unravelling the hidden DNA structural/physical code provides novel insights on promoter location. Nucleic Acids Res. 2013;41:7220–7230. doi: 10.1093/nar/gkt511. [DOI] [PMC free article] [PubMed] [Google Scholar]
- 66.Chou K.C., Cai Y.D. Using functional domain composition and support vector machines for prediction of protein subcellular location. J. Biol. Chem. 2002;277:45765–45769. doi: 10.1074/jbc.M204161200. [DOI] [PubMed] [Google Scholar]
- 67.Wang S.Q., Yang J. Using stacked generalization to predict membrane protein types based on pseudo amino acid composition. J. Theor. Biol. 2006;242:941–946. doi: 10.1016/j.jtbi.2006.05.006. [DOI] [PubMed] [Google Scholar]
- 68.Cai Y.D., Zhou G.P. Support vector machines for predicting membrane protein types by using functional domain composition. Biophys. J. 2003;84:3257–3263. doi: 10.1016/S0006-3495(03)70050-2. [DOI] [PMC free article] [PubMed] [Google Scholar]
- 69.Furey T.S., Cristianini N., Duffy N., Bednarski D.W., Schummer M., Haussler D. Support vector machine classification and validation of cancer tissue samples using microarray expression data. Bioinformatics. 2000;16:906–914. doi: 10.1093/bioinformatics/16.10.906. [DOI] [PubMed] [Google Scholar]
- 70.Chang C.C., Lin C.J. LIBSVM: A library for support vector machines. ACM Trans. Intell. Syst. Technol. 2011;2:1–27. [Google Scholar]
- 71.Chou K.C., Zhang C.T. Review: Prediction of protein structural classes. Crit. Rev. Biochem. Mol. Biol. 1995;30:275–349. doi: 10.3109/10409239509083488. [DOI] [PubMed] [Google Scholar]
- 72.Mohabatkar H., Mohammad Beigi M., Esmaeili A. Prediction of GABA(A) receptor proteins using the concept of Chou's pseudo-amino acid composition and support vector machine. J. Theor. Biol. 2011;281:18–23. doi: 10.1016/j.jtbi.2011.04.017. [DOI] [PubMed] [Google Scholar]
- 73.Sahu S.S., Panda G. A novel feature representation method based on Chou's pseudo amino acid composition for protein structural class prediction. Comput. Biol. Chem. 2010;34:320–327. doi: 10.1016/j.compbiolchem.2010.09.002. [DOI] [PubMed] [Google Scholar]
- 74.Sun X.Y., Shi S.P., Qiu J.D., Suo S.B., Huang S.Y., Liang R.P. Identifying protein quaternary structural attributes by incorporating physicochemical properties into the general form of Chou's PseAAC via discrete wavelet transform. Mol. Biosyst. 2012;8:3178–3184. doi: 10.1039/c2mb25280e. [DOI] [PubMed] [Google Scholar]
- 75.Qiu W.R., Xiao X., Chou K.C. iRSpot-TNCPseAAC: Identify recombination spots with trinucleotide composition and pseudo amino acid components. Int. J. Mol. Sci. 2014;15:1746–1766. doi: 10.3390/ijms15021746. [DOI] [PMC free article] [PubMed] [Google Scholar]
- 76.Chou K.C. Using subsite coupling to predict signal peptides. Protein Eng. 2001;14:75–79. doi: 10.1093/protein/14.2.75. [DOI] [PubMed] [Google Scholar]
- 77.Xu Y., Shao X.J., Wu L.Y. iSNO-AAPair: incorporating amino acid pairwise coupling into PseAAC for predicting cysteine S-nitrosylation sites in proteins. PeerJ. 2013;1:e171. doi: 10.7717/peerj.171. [DOI] [PMC free article] [PubMed] [Google Scholar]
- 78.Chou K.C., Shen H.B. Euk-mPLoc: a fusion classifier for large-scale eukaryotic protein subcellular location prediction by incorporating multiple sites. J. Proteome Res. 2007;6:1728–1734. doi: 10.1021/pr060635i. [DOI] [PubMed] [Google Scholar]
- 79.Chou K.C., Wu Z.C., Xiao X. iLoc-Hum: Using accumulation-label scale to predict subcellular locations of human proteins with both single and multiple sites. Mol. Biosyst. 2012;8:629–641. doi: 10.1039/c1mb05420a. [DOI] [PubMed] [Google Scholar]
- 80.Shen H.B. Hum-mPLoc: An ensemble classifier for large-scale human protein subcellular location prediction by incorporating samples with multiple sites. Biochem. Biophys. Res. Commun. 2007;355:1006–1011. doi: 10.1016/j.bbrc.2007.02.071. [DOI] [PubMed] [Google Scholar]
- 81.Xiao X., Wang P., Lin W.Z. iAMP-2L: A two-level multi-label classifier for identifying antimicrobial peptides and their functional types. Anal. Biochem. 2013;436:168–177. doi: 10.1016/j.ab.2013.01.019. [DOI] [PubMed] [Google Scholar]
- 82.Ding C., Yuan L.F., Guo S.H., Lin H., Chen W. Identification of mycobacterial membrane proteins and their types using over-represented tripeptide compositions. J. Proteomics. 2012;77:321–328. doi: 10.1016/j.jprot.2012.09.006. [DOI] [PubMed] [Google Scholar]
- 83.Yuan L.F., Ding C., Guo S.H., Ding H., Chen W., Lin H. Prediction of the types of ion channel-targeted conotoxins based on radial basis function network. Toxicol. In Vitro. 2013;27:852–856. doi: 10.1016/j.tiv.2012.12.024. [DOI] [PubMed] [Google Scholar]
- 84.Chen Y.W., Lin C.J. Combining SVMs with Various Feature Selection Strategies. In: Guyon I, Nikravesh M, Gunn S, Zadeh L, editors. Feature Extraction. Vol. 207. Berlin Heidelberg: Springer; 2006. pp. 315–324. [Google Scholar]
- 85.Wilkinson L., Friendly M. The history of the cluster heat map. Am. Statistician. 2009;63:179–184. [Google Scholar]
- 86.de Avila E.S.S., Echeverrigaray S., Gerhardt G.J. BacPP: bacterial promoter prediction–a tool for accurate sigma-factor specific assignment in enterobacteria. J. Theor. Biol. 2011;287:92–99. doi: 10.1016/j.jtbi.2011.07.017. [DOI] [PubMed] [Google Scholar]
- 87.Doucleff M., Pelton J.G., Lee P.S., Nixon B.T., Wemmer D.E. Structural basis of DNA recognition by the alternative sigma-factor, sigma54. J. Mol. Biol. 2007;369:1070–1078. doi: 10.1016/j.jmb.2007.04.019. [DOI] [PMC free article] [PubMed] [Google Scholar]
- 88.Bailey T.L., Elkan C. Fitting a mixture model by expectation maximization to discover motifs in biopolymers. Proc. Int. Conf. Intell. Syst. Mol. Biol. 1994;2:28–36. [PubMed] [Google Scholar]
- 89.Liu L., Li Q.Z., Lin H., Zuo Y.C. The effect of regions flanking target site on siRNA potency. Genomics. 2013;102:215–222. doi: 10.1016/j.ygeno.2013.07.009. [DOI] [PubMed] [Google Scholar]
- 90.Lu J., Luo L., Zhang Y. Distance conservation of transcription regulatory motifs in human promoters. Comput. Biol. Chem. 2008;32:433–437. doi: 10.1016/j.compbiolchem.2008.07.001. [DOI] [PubMed] [Google Scholar]
- 91.Luo L., Bai G. The maximum information principle and the evolution of nucleotide sequences. J. Theor. Biol. 1995;174:131–136. doi: 10.1006/jtbi.1995.0086. [DOI] [PubMed] [Google Scholar]
- 92.Zhang R. A rebuttal to the comments on the genome order index and the Z-curve. Biol. Direct. 2011;6:10. doi: 10.1186/1745-6150-6-10. [DOI] [PMC free article] [PubMed] [Google Scholar]
- 93.Zhang J. Protein-length distributions for the three domains of life. Trends Genet. 2000;16:107–109. doi: 10.1016/s0168-9525(99)01922-8. [DOI] [PubMed] [Google Scholar]
- 94.Hsieh L.C., Luo L., Ji F., Lee H.C. Minimal model for genome evolution and growth. Phys. Rev. Lett. 2003;90:018101. doi: 10.1103/PhysRevLett.90.018101. [DOI] [PubMed] [Google Scholar]
- 95.Wang F.P., Li H. Codon-pair usage and genome evolution. Gene. 2009;433:8–15. doi: 10.1016/j.gene.2008.12.016. [DOI] [PubMed] [Google Scholar]
- 96.Chou K.C., Shen H.B. Signal-CF: a subsite-coupled and window-fusing approach for predicting signal peptides. Biochem. Biophys. Res. Comm. 2007;357:633–640. doi: 10.1016/j.bbrc.2007.03.162. [DOI] [PubMed] [Google Scholar]
- 97.Rangannan V., Bansal M. Identification and annotation of promoter regions in microbial genome sequences on the basis of DNA stability. J. Biosci. 2007;32:851–862. doi: 10.1007/s12038-007-0085-1. [DOI] [PubMed] [Google Scholar]
Associated Data
This section collects any data citations, data availability statements, or supplementary materials included in this article.