Abstract
Optical trapping is a powerful single molecule technique used to study dynamic biomolecular events, especially those involving DNA and DNA-binding proteins. Current implementations usually involve only one of stretching, unzipping, or twisting DNA along one dimension. To expand the capabilities of optical trapping for more complex measurements would require a multidimensional technique that combines all of these manipulations in a single experiment. Here, we report the development and utilization of such a novel optical trapping assay based on a three-branch DNA construct, termed a “Y structure”. This multidimensional assay allows precise, real-time tracking of multiple configurational changes. When the Y structure template is unzipped under both force and torque, the force and extension of all three branches can be determined simultaneously. Moreover, the assay is readily compatible with fluorescence, as demonstrated by unzipping through a fluorescently labeled, paused transcription complex. This novel assay thus allows for the visualization and precision mapping of complex interactions of biomechanical events.
Keywords: Optical tweezers, DNA Y structure, unzipping DNA, DNA torque, single molecule, force spectroscopy
Single molecule optical trapping techniques have enabled significant advancement in the understanding of a wide variety of biomolecular systems, especially those involving DNA and associated binding proteins. Optical trapping traditionally utilizes three complementary implementations to manipulate and measure DNA: stretching, unzipping, or twisting.1−24 While each of these techniques provides unique insights into biomolecular systems, they have only been combined in a limited fashion, with dynamic measurements made along one dimension. Complex biomolecular systems, such as transcription and replication machineries, involve processes that simultaneously stretch, unwind, and twist multiple strands of nucleic acids. Therefore, the next generation of optical trapping techniques will need to extend measurements to multiple dimensions to allow tracking of different configurational changes which occur simultaneously within molecular complexes.
New optical trapping assays should also be enhanced with fluorescence imaging to visualize molecular events on DNA. Previous studies have combined optical trapping with fluorescence,25−32 but force measurements were made along one dimension, and fluorescence visualization of binding events was limited to a resolution of approximately a few hundred base pairs along long stretches of DNA. Future assays should extend fluorescence visualization of proteins to multidimensional DNA configurations and could use fluorescence to establish a low resolution, “big picture” map of protein locations while exploiting high-resolution optical trapping techniques to home in on their precise locations.
In this work, we present a novel multidimensional assay that allows simultaneous stretching, twisting, and unzipping of DNA. This assay, termed the “Y-structure”, utilizes a dual-beam optical trap to extend a three-branch DNA construct. The forces and extensions of all three DNA branches are simultaneously measured, eliminating the constraint of a single axis of tension and allowing multiple configurational changes within a biomolecular system to be resolved independently. The Y structure assay can be readily combined with fluorescence to visualize binding events in all three DNA branches, while DNA unzipping provides near base-pair resolution mapping of both the location of a bound complex and multiple, detailed interactions within a single complex. Thus, this new technique provides a versatile, multidimensional platform for the study of complex biomolecular systems.
The Y Structure
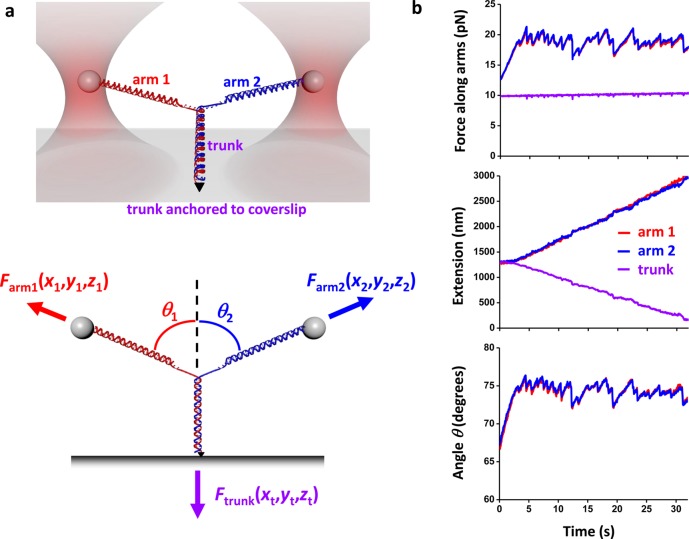
The Y structure, as defined for this work, is a DNA structure with a dynamic three-way junction which resembles a replication fork, where the lengths and tensions of all three DNA branches are determined in real time (Figure 1a). It is composed of three main branches: two DNA arms which are initially fully double stranded and a dsDNA trunk (Supporting Information; Figure S1). The end of the trunk is attached to a microscope coverslip, while the end of one arm is attached to a microsphere held in an optical trap (Trap 1), and the end of the other arm to a second microsphere held in a second, separate trap (Trap 2). Each microsphere can be manipulated separately by its trap and its three-dimensional (3D) force and position are detected. The coverslip is mounted onto an x–y–z piezo stage. This configuration allows for full 3D manipulation of the Y structure and measurements of force and extension in each branch (Supporting Information, Figure S2 and Figure S3).
Figure 1.
Unzipping a Y structure. (a) Experimental configuration. (Top) The initial Y structure consisted of two dsDNA arms which were joined to a dsDNA trunk: one arm was attached to an optically trapped microsphere via a streptavidin/biotin connection; the second arm to a second optically trapped microsphere via a digoxigenin/antidigoxigenin connection; the trunk to a microscope coverslip via a fluorescein/antifluorescein connection. This version of the Y-structure contained a single anchoring point of the trunk via one of its two DNA strands and thus permitted the trunk end to swivel around the anchoring point without any torsional constraint. (Bottom) Y structure geometry and force balance. The trunk dsDNA was mechanically unzipped by pulling on the arms with the two optical traps. The force vector on each arm was independently measured, and thus the force on the trunk was determined by force balance at the junction. The 3D position of each trapped microsphere and the trunk anchoring point were also measured. (b) An example data trace from symmetric unzipping of the trunk of a Y structure under a constant force on the trunk. The force and extension of each branch of the Y-structure as well as the angles of the Y-structure were measured as functions of time. Data were taken at 10 kHz and filtered to 20 Hz.
Unzipping under Tension
Stretching DNA with a bound protein yields valuable information about protein–DNA interaction kinetics, while unzipping DNA provides detailed information about the locations and strengths of interactions. The Y structure makes it possible to combine DNA stretching and unzipping.
Here, we demonstrate DNA unzipping while maintaining a constant tension on the DNA trunk. Unzipping was achieved by two divergent forces, one from each arm, acting symmetrically about the trunk (Figure 1a). The total force on the trunk was feedback controlled to maintain a constant value via modulation of Trap 1 and piezo stage positions. As Trap 1 was moved away from Trap 2, each of the two arms, which began as dsDNA, acquired ssDNA from the trunk as the trunk was unzipped, similar to 1D unzipping33 except that the DNA trunk was under tension.
Figure 1b is an example of data acquired during the symmetric unzipping of a Y structure. As the Y structure was mechanically unzipped, the magnitudes of forces on both arms varied in an essentially identical fashion with the progression of unzipping, while the force on the trunk remained at the set point of 10 pN. The trunk extension decreased with time with concurrent extension increases in both arms. The angles between the arms and the trunk also varied with the progression of unzipping in an essentially identical fashion, further indicating that forces from the two arms were kept nearly symmetric.
In order to understand these mechanical measurements, we extended a previous statistical mechanical model for 1D unzipping34 to the 2D unzipping configuration of the Y-structure (Supporting Information). This generalization takes into account the total free energy of the Y structure: the sequence-dependent DNA base pairing energy in the trunk dsDNA35 and the elastic free energies in both arms and trunk.36−38 The resulting partition function allows the calculation of the equilibrium forces in both arms and the equilibrium fork junction position.
The measured force along the arms versus number of base pairs unzipped agrees well with theory (Figure 2a). This theory indicates that the force variation is solely a result of DNA sequence variations in the trunk, as would also be the case for 1D unzipping. Both measurements and theory show that the unzipping force profile, when the trunk is under tension, is similar to that when the trunk is under no tension, except for an overall increase in force.
Figure 2.
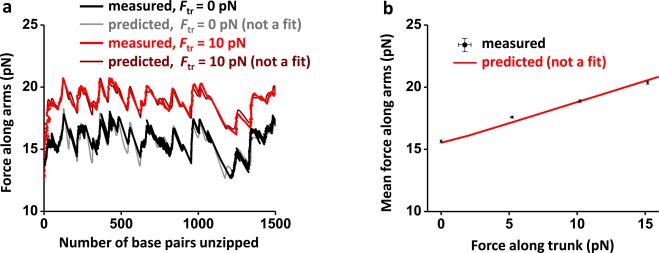
Unzipping a Y structure under different trunk forces. (a) Force along arms versus number of base pairs unzipped under no trunk force (black) and 10 pN trunk force (red). Since the measured forces along the two arms were nearly identical, their mean force was used to make these plots. Theoretical predictions are shown for comparison. Data were taken at 10 kHz and filtered to 20 Hz. (b) Mean force along arms versus force along trunk (black). For each trunk force, force along arms was averaged over the first 1500 bp unzipped. Theoretical prediction is shown in red.
To better characterize this force increase, we determined the force in the arms as a function of the force in the trunk (Figure 2b). The force in the arms increased rather linearly with the force in the trunk. Even the force component perpendicular to the trunk is greater than that of the corresponding 1D unzipping force under the conditions we explored (Figure S4). Our theoretical modeling (Supporting Information) indicates that the presence of a constant tension in the trunk adds a term to the free energy of the Y structure in such a way that it appears that the base-pairing energy of the dsDNA trunk has increased. This “apparent” stabilization of the base pairing in the trunk dsDNA results in an increased unzipping force.
The Y structure also provides a simple method to generate and study a long stretch of ssDNA. After the Y structure has been completely unzipped, one strand of the trunk DNA remains bound to the surface, while the other strand completely detaches. The surface bound ssDNA can then be stretched by an optical trap to determine its force–extension relation (Supporting Information and Figure S5).
Torsion Generation
Due to the helical nature of dsDNA, motor proteins that translocate along DNA will necessarily have to rotate relative to the DNA. Hindrance of relative rotation by cellular constraints and viscous drag leads to torsion build-up that in turn regulates these processes.39,40 Thus, torsion in DNA plays an important role in biological processes that take place on DNA and has been demonstrated to significantly alter activities of bound proteins.23 The Y structure provides a natural way to create and control torsion in the trunk DNA.
In order to demonstrate this feature, we torsionally anchored the end of the trunk to the surface of a coverslip via multiple attachment points (Supporting Information) (Figure 3a). This enabled the introduction of twist to the trunk DNA by unzipping the DNA. During the unzipping of the Y structure, the fork end of the trunk is expected to rotate, converting twist released from base pairing to additional twist in the trunk. This buildup in twist energy should make it progressively more difficult to unzip the trunk.
Figure 3.
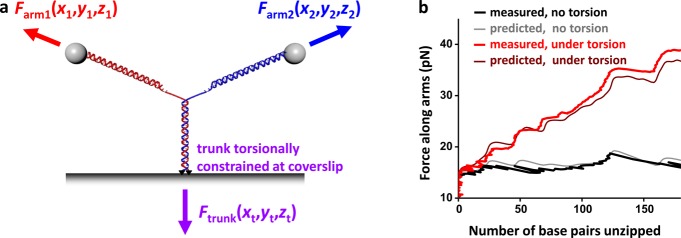
Unzipping a Y structure under torsion. (a) The trunk of the Y structure was torsionally constrained to the microscope coverslip via multiple fluorescein/antifluorescein connections at both DNA strands of the trunk end. This Y structure version prevented the trunk end from swiveling around the anchoring points. (b) Force along arms versus number of base pairs unzipped of either a torsionally constrained or unconstrained trunk, both under 8 pN trunk force. Theoretical predictions are shown for comparison. Data were taken at 10 kHz and filtered to 20 Hz.
Figure 3b shows measurements from unzipping a torsionally constrained trunk which was held under 4 pN of tension, sufficient force to prevent buckling of the trunk DNA in our experiment. As expected, the unzipping force indeed increased rapidly, even upon a small amount of unzipping. The force increase was linear, with respect to the number of base pairs unzipped, and was modulated by variations due to DNA sequence. In comparison, when the trunk was not under torsion, the unzipping force remained essentially constant, aside from the sequence-dependent variations.
To better understand these measurements, we further extended the theoretical model to consider the unzipping of the Y structure under torsion in addition to tension (Figure 3b, Supporting Information). The theory correctly predicts the force increase and the sequence-dependent force variations. It also provides a simple explanation for the linearity in the force increase, which results from the torsional energy’s quadratic dependence on the twist of the trunk.41 The observed increase in the unzipping force with the number of base pairs unzipped is a result of torsional energy build up in the trunk with unzipping, providing an “apparent” progressive stabilization of the base pairing in the trunk (Supporting Information).
Even without DNA unzipping, the Y structure provides a flexible way of generating twist in the trunk. For example, twist may be added to the trunk DNA by the rotation of the two dsDNA arms about the trunk attachment point.
Y Structure in Conjunction with Fluorescence
While unzipping is able to accurately locate a protein already bound to dsDNA, it has not been shown to have the ability to provide real-time information on protein binding and translocation, nor the ability to locate a protein on ssDNA. Fluorescence visualization thus complements unzipping. We have integrated Y structure manipulation with fluorescence in order to combine the high resolution mapping by unzipping with direct visualization by fluorescence.
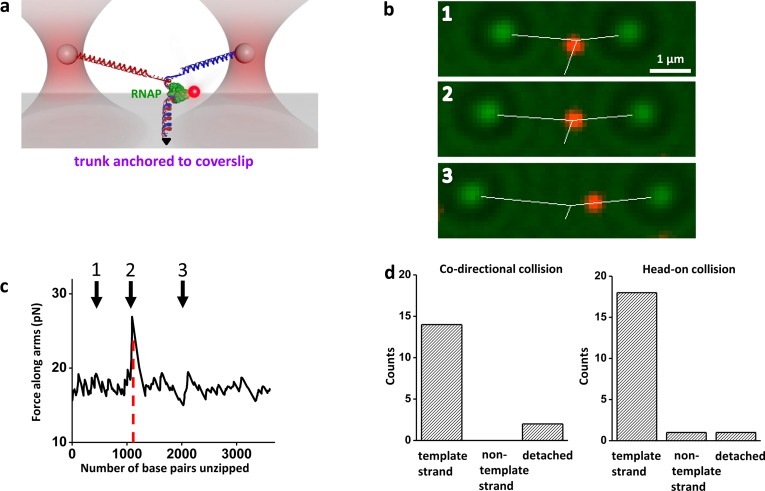
In order to demonstrate this integration, we first formed a paused transcription elongation complex (TEC) on the DNA trunk and then labeled the RNA polymerase (RNAP) with a quantum dot (Figure 4a). In the Y structure configuration, fluorescence visualization allowed a rough localization of the TEC on the dsDNA trunk. To more precisely locate the TEC, we then unzipped through the TEC while simultaneously acquiring optical trapping data, bright field images, and fluorescence images in real time (Figure 4b, Supporting Video 1). The trapping data permitted the determination of the exact geometry of the Y structure DNA in real time. In addition, the force rise in the unzipping data provided the precise location of the TEC on the trunk DNA (Figure 5c).
Figure 4.
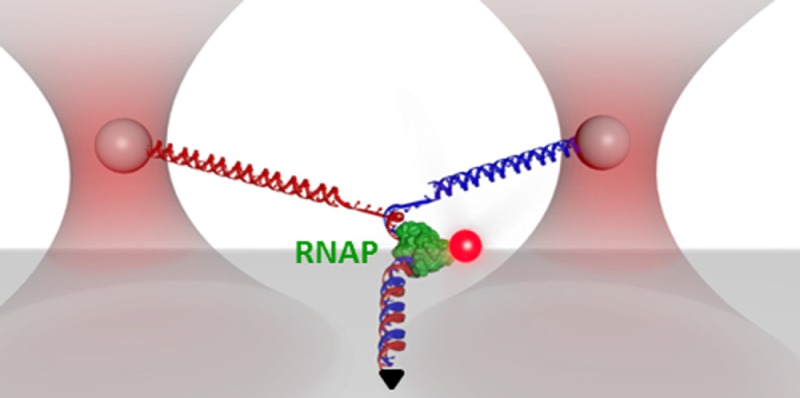
Simultaneous stretching, unzipping, and fluorescence. (a) A cartoon illustrating the experimental configuration. This Y structure contained two arms of different lengths in order to make the two arms easily distinguishable, and a trunk with a paused transcription elongation complex (TEC) formed with an HA-tagged E. coli RNAP. The RNAP was subsequently labeled by anti-HA, which was then labeled by secondary-antibody coated quantum dots. The trunk containing the RNAP was subsequently unzipped under 4 pN of force along the trunk. (b) Snapshots from video images showing the location of the RNAP (red, fluorescence images), the trapped microspheres (green, bright field images), and the real-time measured extensions of three branches of the Y structure (white lines), as the trunk DNA was unzipped through the bound RNAP, here in a head-on collision (Supporting Video 1). The RNAP was bound to the trunk DNA prior to encountering the unzipping fork and visualized by fluorescence. After the unzipping fork passed through the bound RNAP, the RNAP was retained on the template strand (the shorter Y arm). (c) Measured force along arms versus number of base pairs unzipped for the example shown in (b). The red dashed line indicates the expected active site location of the TEC. Arrows correlate the time points for images shown in (b). At time point 2, the TEC was disrupted. Data were taken at 10 kHz and filtered to 20 Hz. (d) Histograms showing RNAP fates upon unzipping. The locations of RNAP after either codirectional or head-on collisions with unzipping were determined by making multiple measurements such as those shown in b and c.
Figure 5.
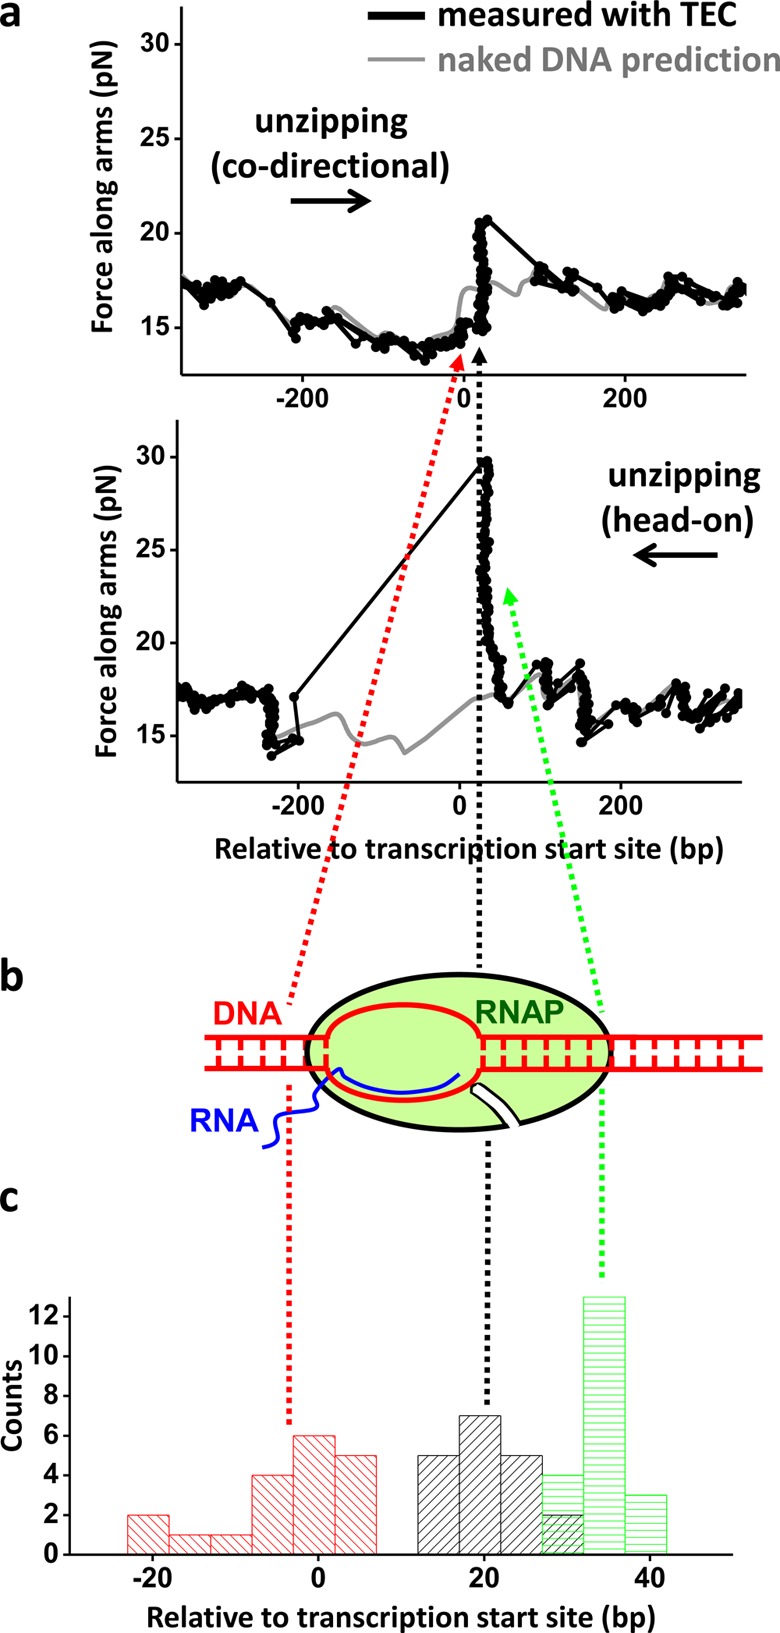
Mapping the structure of the transcription elongation complex (TEC). (a) Unzipping DNA through a TEC from either codirectional collision (top panel) or head-on collision (bottom panel) directions. The TEC was paused at +20 bp from the start site, and the trunk was held at 4 pN of force. The theoretical predictions of the unzipping force of naked DNA are also shown for comparison (gray). Three characteristic locations are highlighted. In the codirectional unzipping direction, the onset of the force drop indicates the presence of the transcription bubble, and the subsequent force rise corresponds to the end of the transcription bubble and the beginning of the dsDNA clamped by RNAP. In the head-on unzipping direction, a force rise corresponds to the onset of the RNAP interaction with the downstream dsDNA. Data were taken at 10 kHz and filtered to 20 Hz. (b) A cartoon of the TEC indicating the locations of the three detectable features discussed above. (c) An RNAP–DNA interaction map of the TEC. Three histograms were obtained by pooling a number of measurements such as those shown in a. They show the locations for the onset of the force drop (red) and the force rise peak (black) in the codirectional unzipping direction, and the force rise peak (green) in the head-on unzipping direction relative to the transcription start site (+1 bp corresponds to the transcription start site). The mean position of each histogram is indicated by a dashed line. The distance between the red and black dashed lines is ∼25 bp which is an overestimate of the actual transcription bubble size (Supporting Information). The distance between the green and black lines is ∼14 bp and provides the length of the downstream dsDNA region tightly clamped by RNAP. Note that the x-axis is zoomed in compared to the plots in a.
Interestingly, fluorescence visualization of the RNAP revealed that, after the DNA was unzipped through the TEC, the RNAP almost exclusively remained bound to the template strand of the DNA (Supporting Information). This occurred regardless of whether the unzipping fork collided with RNAP codirectionally (in the same direction as transcription) or head-on (in the opposite direction to transcription) (Figure 4d). This finding has significant implications for replication–transcription collision (see the Discussion below).
We also show that unzipping provides accurate measurements of the detailed interaction of RNAP with the trunk. When the unzipping fork encountered the RNAP paused at 20 nt after the transcription start site (+20 site), we found that RNAP significantly altered the unzipping force, compared to that of naked DNA (Figure 5). For a codirectional collision, a force reduction appeared 24 ± 8 nt (mean ± SD) upstream of the +20 site, which we interpret as the fork beginning to interact with the transcription bubble (Supporting Information and Figure S6). This was followed by a dramatic increase in unzipping force at the +20 site (±4 nt), which we interpret as the fork encountering the downstream dsDNA that was tightly clamped by the RNAP. These findings from the Y-structure are consistent with our previous findings using 1D unzipping.19 For a head-on collision, a dramatic force rise occurred at 14 ± 3 bp downstream of the +20 site, which we interpret as the fork encountering the far downstream dsDNA that was tightly clamped by the RNAP. These measurements compare well with TEC structure determination from previous biochemical studies.42,43 It is worth noting that a paused TEC at this +20 site is known to backtrack19 and should contribute to the measured heterogeneity in the TEC population. Thus, in addition to locating the TEC to near base pair accuracy, these measurements mapped out detailed interactions and their strengths within the TEC.
Therefore, the combination of unzipping with fluorescence allowed us to (1) visualize RNAP presence on the trunk prior to unzipping, (2) accurately determine its location and its TEC structure on the trunk upon unzipping, and (3) visualize its presence on the ssDNA after unzipping.
Discussion
Previous single molecule studies have been restricted to measuring physical quantities along one dimension, limiting the examination of complex biomolecular systems. Our novel Y structure assay measures forces and extensions on DNA in two dimensions, can impose torsional constraint on DNA, determines the locations of proteins after they dissociate from the template, and is compatible with fluorescence.
Although here we demonstrate the Y structure assay with all three branches composed of DNA, each branch may be composed of DNA, RNA, or RNA–DNA hybrid. In principle, the three-way junction can also be extended to multiple junctions, each of which may be directly measured in 3D, though this would require a proportional increase in the number of traps.
The addition of new measurement axes allows for a plethora of interesting experimental possibilities. The Y structure assay allows a new generation of single molecule studies focused on characterizing interactions of multiple proteins during complex processes such as transcription and replication. The ability to combine stretching, twisting, unzipping, and fluorescent imaging in a single assay provides a versatile system for measuring the complex geometries and protein interactions during these processes.
Acknowledgments
We thank the members of the Wang lab for a critical reading of the manuscript. We especially thank Dr. R. M. Fulbright for the purification of RNA polymerase. We wish to acknowledge graduate traineeship support to J.I. from Cornell University’s Molecular Biophysics Training Grant (T32GM008267), postdoctoral support to R.A.F. from the American Cancer Society (125126-PF-13-205-01-DMC), support to J.P.S from National Science Foundation grant (DMR 1312160), and support to M.D.W. from the National Institutes of Health grant (GM059849) and National Science Foundation grant (MCB-0820293).
Supporting Information Available
Additional discussion, figures, and references plus a video of simultaneous stretching, unzipping, and fluorescence. This material is available free of charge via the Internet at http://pubs.acs.org.
Author Present Address
Benjamin Smith present address: Google Inc., New York, NY 10011.
Author Present Address
Michael A. Hall present address: Microsoft Inc., Redmond, WA 98052.
Author Present Address
Jing Jin present address: GenScript Inc., Nanjing, PRC.
The authors declare no competing financial interest.
Funding Statement
National Institutes of Health, United States
Supplementary Material
References
- Cui Y.; Bustamante C. Proc. Natl. Acad. Sci. U.S.A. 2000, 971127–32. [DOI] [PMC free article] [PubMed] [Google Scholar]
- Bennink M. L.; Leuba S. H.; Leno G. H.; Zlatanova J.; de Grooth B. G.; Greve J. Nat. Struct. Biol. 2001, 87606–10. [DOI] [PubMed] [Google Scholar]
- Brower-Toland B. D.; Smith C. L.; Yeh R. C.; Lis J. T.; Peterson C. L.; Wang M. D. Proc. Natl. Acad. Sci. U.S.A. 2002, 9941960–5. [DOI] [PMC free article] [PubMed] [Google Scholar]
- Gemmen G. J.; Sim R.; Haushalter K. A.; Ke P. C.; Kadonaga J. T.; Smith D. E. J. Mol. Biol. 2005, 351189–99. [DOI] [PubMed] [Google Scholar]
- Brower-Toland B.; Wacker D. A.; Fulbright R. M.; Lis J. T.; Kraus W. L.; Wang M. D. J. Mol. Biol. 2005, 3461135–46. [DOI] [PubMed] [Google Scholar]
- Mihardja S.; Spakowitz A. J.; Zhang Y.; Bustamante C. Proc. Natl. Acad. Sci. U.S.A. 2006, 1034315871–6. [DOI] [PMC free article] [PubMed] [Google Scholar]
- van Mameren J.; Modesti M.; Kanaar R.; Wyman C.; Peterman E. J.; Wuite G. J. Nature 2009, 4577230745–8. [DOI] [PMC free article] [PubMed] [Google Scholar]
- Forget A. L.; Kowalczykowski S. C. Nature 2012, 4827385423–7. [DOI] [PMC free article] [PubMed] [Google Scholar]
- Yin H.; Wang M. D.; Svoboda K.; Landick R.; Block S. M.; Gelles J. Science 1995, 27052421653–7. [DOI] [PubMed] [Google Scholar]
- Wang M. D.; Schnitzer M. J.; Yin H.; Landick R.; Gelles J.; Block S. M. Science 1998, 2825390902–7. [DOI] [PubMed] [Google Scholar]
- Wuite G. J.; Smith S. B.; Young M.; Keller D.; Bustamante C. Nature 2000, 4046773103–6. [DOI] [PubMed] [Google Scholar]
- Smith D. E.; Tans S. J.; Smith S. B.; Grimes S.; Anderson D. L.; Bustamante C. Nature 2001, 4136857748–52. [DOI] [PubMed] [Google Scholar]
- Adelman K.; Yuzenkova J.; La Porta A.; Zenkin N.; Lee J.; Lis J. T.; Borukhov S.; Wang M. D.; Severinov K. Mol. Cell 2004, 146753–62. [DOI] [PubMed] [Google Scholar]
- Dame R. T.; Noom M. C.; Wuite G. J. Nature 2006, 4447117387–90. [DOI] [PubMed] [Google Scholar]
- Noom M. C.; van den Broek B.; van Mameren J.; Wuite G. J. Nat. Methods 2007, 4121031–6. [DOI] [PubMed] [Google Scholar]
- Koch S. J.; Shundrovsky A.; Jantzen B. C.; Wang M. D. Biophys. J. 2002, 8321098–105. [DOI] [PMC free article] [PubMed] [Google Scholar]
- Koch S. J.; Wang M. D. Phys. Rev. Lett. 2003, 912028103. [DOI] [PubMed] [Google Scholar]
- Hall M. A.; Shundrovsky A.; Bai L.; Fulbright R. M.; Lis J. T.; Wang M. D. Nat. Struct Mol. Biol. 2009, 162124–9. [DOI] [PMC free article] [PubMed] [Google Scholar]
- Jin J.; Bai L.; Johnson D. S.; Fulbright R. M.; Kireeva M. L.; Kashlev M.; Wang M. D. Nat. Struct Mol. Biol. 2010, 176745–52. [DOI] [PMC free article] [PubMed] [Google Scholar]
- Dumont S.; Cheng W.; Serebrov V.; Beran R. K.; Tinoco I. Jr.; Pyle A. M.; Bustamante C. Nature 2006, 4397072105–8. [DOI] [PMC free article] [PubMed] [Google Scholar]
- Johnson D. S.; Bai L.; Smith B. Y.; Patel S. S.; Wang M. D. Cell 2007, 12971299–309. [DOI] [PMC free article] [PubMed] [Google Scholar]
- Sun B.; Johnson D. S.; Patel G.; Smith B. Y.; Pandey M.; Patel S. S.; Wang M. D. Nature 2011, 4787367132–5. [DOI] [PMC free article] [PubMed] [Google Scholar]
- Ma J.; Bai L.; Wang M. D. Science 2013, 34061401580–3. [DOI] [PMC free article] [PubMed] [Google Scholar]
- Sheinin M. Y.; Li M.; Soltani M.; Luger K.; Wang M. D. Nat. Commun. 2013, 4, 2579. [DOI] [PMC free article] [PubMed] [Google Scholar]
- Ishijima A.; Kojima H.; Funatsu T.; Tokunaga M.; Higuchi H.; Tanaka H.; Yanagida T. Cell 1998, 922161–71. [DOI] [PubMed] [Google Scholar]
- Lang M. J.; Fordyce P. M.; Block S. M. J. Biol. 2003, 216. [DOI] [PMC free article] [PubMed] [Google Scholar]
- Dijk M. A.; Kapitein L. C.; Mameren J.; Schmidt C. F.; Peterman E. J. J. Phys. Chem. B 2004, 108206479–84. [DOI] [PubMed] [Google Scholar]
- Brau R. R.; Tarsa P. B.; Ferrer J. M.; Lee P.; Lang M. J. Biophys. J. 2006, 9131069–77. [DOI] [PMC free article] [PubMed] [Google Scholar]
- Galletto R.; Amitani I.; Baskin R. J.; Kowalczykowski S. C. Nature 2006, 4437113875–8. [DOI] [PubMed] [Google Scholar]
- Hohng S.; Zhou R.; Nahas M. K.; Yu J.; Schulten K.; Lilley D. M.; Ha T. Science 2007, 3185848279–83. [DOI] [PMC free article] [PubMed] [Google Scholar]
- Comstock M. J.; Ha T.; Chemla Y. R. Nat. Methods 2011, 84335–40. [DOI] [PMC free article] [PubMed] [Google Scholar]
- Heller I.; Sitters G.; Broekmans O. D.; Farge G.; Menges C.; Wende W.; Hell S. W.; Peterman E. J.; Wuite G. J. Nat. Methods 2013, 109910–6. [DOI] [PubMed] [Google Scholar]
- Bockelmann U.; EssevazRoulet B.; Heslot F. Phys. Rev. Lett. 1997, 79224489–4492. [Google Scholar]
- Bockelmann U.; Essevaz-Roulet B.; Heslot F. Phys. Rev. E 1998, 5822386–2394. [Google Scholar]
- Huguet J. M.; Bizarro C. V.; Forns N.; Smith S. B.; Bustamante C.; Ritort F. Proc. Natl. Acad. Sci. U.S.A. 2010, 1073515431–6. [DOI] [PMC free article] [PubMed] [Google Scholar]
- Marko J. F.; Siggia E. D. Macromolecules 1995, 28268759–8770. [Google Scholar]
- Smith S. B.; Cui Y.; Bustamante C. Science 1996, 2715250795–9. [DOI] [PubMed] [Google Scholar]
- Wang M. D.; Yin H.; Landick R.; Gelles J.; Block S. M. Biophys. J. 1997, 7231335–46. [DOI] [PMC free article] [PubMed] [Google Scholar]
- Koster D. A.; Crut A.; Shuman S.; Bjornsti M. A.; Dekker N. H. Cell 2010, 1424519–30. [DOI] [PMC free article] [PubMed] [Google Scholar]
- Forth S.; Sheinin M. Y.; Inman J.; Wang M. D. Annu. Rev. Biophys. 2013, 42, 583–604. [DOI] [PMC free article] [PubMed] [Google Scholar]
- Marko J. F. Phys. Rev. E: Stat. Nonlinear Soft Matter Phys. 2007, 762 Pt 1021926. [DOI] [PubMed] [Google Scholar]
- Lee D. N.; Landick R. J. Mol. Biol. 1992, 2283759–77. [DOI] [PubMed] [Google Scholar]
- Zaychikov E.; Denissova L.; Heumann H. Proc. Natl. Acad. Sci. U.S.A. 1995, 9251739–43. [DOI] [PMC free article] [PubMed] [Google Scholar]
Associated Data
This section collects any data citations, data availability statements, or supplementary materials included in this article.


