Abstract
Objective:
This paper provides a detailed description of the Nucleus 6 system, and clinically evaluates user performance compared to the previous Nucleus 5 system in cochlear implant recipients. Additionally, it clinically evaluates a range of Nucleus 6 and Nucleus 5 programs to determine the performance benefits provided by new input processing technologies available in SmartSound iQ.
Design
Speech understanding tests were used to clinically validate the default Nucleus 6 program, by comparing performance outcomes against up to five custom Nucleus 5 or Nucleus 6 programs in a range of listening environments. Clinical comparisons between programs were conducted across the following listening environments; quiet, speech weighted noise (co-located and spatially separated noise), and 4-talker babble (co-located and spatially separated noise).
Study sample
Twenty-one adult cochlear implant recipients participated.
Results
Significant speech understanding benefits were found with the default Nucleus 6 program compared to the participants’ preferred program using their Nucleus 5 processor and compared to a range of custom Nucleus 6 programs. All participants successfully accepted and upgraded to the new default Nucleus 6 SmartSound iQ program.
Conclusion
This study demonstrates the acceptance and clinical benefits of the Nucleus 6 cochlear implant system and SmartSound iQ.
Keywords: Cochlear implant, clinical evaluation, speech perception, Nucleus 6, automatic scene classification, directional microphones, noise reduction, wind noise reduction, speech reception threshold
Abbreviations
- ACE
Advanced combination encoder
- ADRO
Adaptive dynamic range optimization
- ANOVA
Analysis of variance
- ASC
Automatic sensitivity control
- CI
Cochlear implant
- CNC
Consonant-vowel nucleus-consonant
- SCAN
Automatic scene classifier system
- SmartSound iQ
Input processing suite for Nucleus 6
- SNR
Signal-to-noise ratio
- SNR-NR
Signal-to-noise ratio noise reduction
- SRT
Speech reception threshold
- SWN
Speech weighted noise
- S0N0
Speech from 0°, noise from 0°
- S0N3
Speech from 0°, noise from 90°, 180°, and 270°
- WNR
Wind noise reduction
The multi-channel cochlear implant (CI) has had extraordinary success in providing hearing for both adult and paediatric hearing-impaired recipients. Today, most CI recipients are able to achieve open-set speech recognition in quiet. The first devices were designed to provide an aid to lip-reading, but surpassed initial expectations by delivering some limited open set speech understanding (Dowell et al, 1985). Over time, further refinements led to rapid and significant improvements in open-set speech understanding (Skinner et al, 1994). These early improvements were largely attributed to the development of new stimulation strategies, moving from feature extraction based strategies to the modern vocoder based strategies (Loizou, 2006). The current advanced combination encoder (ACE™) stimulation strategy has delivered excellent open-set speech understanding in quiet (Skinner et al, 2002; Gifford et al, 2008). Speech understanding in noise remains a challenge for CI recipients (Nelson et al, 2003; Balkany et al, 2007; Cullington & Zeng, 2008; Dorman et al, 2008; Wolfe et al, 2009).
To address the challenges of listening comfort and speech understanding in noisy environments, SmartSound® was released with the Freedom® processor by Cochlear Limited in 2005 (Patrick et al, 2006). SmartSound incorporated a range of input processing technologies including automatic sensitivity control, channel- specific adaptive dynamic range optimization, and both moderately directional and adaptive directional microphones (Patrick et al, 2006). A further release called SmartSound2 in the Nucleus® 5 system included an additional highly directional microphone technology (Wolfe et al, 2012). The most recent release, SmartSound iQ in the Nucleus 6 system, additionally includes an automatic scene classifier, a CI specific background noise reduction technology, and a wind noise reduction technology. This paper describes the new technologies in SmartSound iQ and compares the performance in quiet and in noise of the Nucleus 6 sound processor using SmartSound iQ with the previous generation Nucleus 5 system.
Automatic sensitivity control (ASC), adaptive dynamic range optimization (ADRO), and Whisper™, are SmartSound technologies designed to ensure signals are comfortable and audible. ASC is a slow acting compressor designed to automatically turn down sound in a noisy environment, and was first introduced in the body-worn mini sound processor in 1989 (Seligman & Whitford, 1995; Patrick et al, 2006). ADRO was introduced in 2002 and is a pre-processing technology that continuously adjusts the gain in each channel to place the signal optimally within the electrical hearing dynamic range (Blamey, 2005). This ensures sounds are always presented at a comfortable and audible listening level across each of the frequency channels of the CI. ADRO provides significant speech understanding improvements and recipients report good sound quality (James et al, 2002; Muller-Deile et al, 2008). Whisper is a fast-acting compression circuit that gives recipients increased access to soft or distant sounds by boosting soft signals by 10 dB. In one study when using Whisper, subjects improved 17% on average for single syllable word understanding in quiet (McDermott et al, 2002).
Two noise reduction technologies have been introduced with SmartSound iQ; CI specific signal-to-noise ratio noise reduction (SNR-NR) to reduce background noise, and wind noise reduction (WNR) to improve listening comfort in windy environments.
SNR-NR is designed specifically for CI sound processors to attenuate constant background noises irrespective of their direction (Mauger et al, 2012). This technology assesses the listening environment and detects the background noise level in each frequency channel. It then estimates the SNR in each channel for each analysis frame. The channels with poor SNRs indicative of background noise are attenuated, whereas channels with positive SNRs, typically dominated by speech, are retained. This technology updates its SNR estimate and the gain it applies for each frequency channel and analysis frame to reduce background noise levels even during speech. Noise reduction has previously been shown to provide 2.1 dB improvement in speech-weighted noise (SWN), 1.1 dB in cocktail party noise, and 1.2 dB in city noise (Dawson et al, 2011). Significant speech understanding improvements were also found from noise reduction in conjunction with all directional microphone settings in SWN (Hersbach et al, 2012). Recent studies have shown that noise reduction technologies designed for hearing aids may be optimized to provide further benefit for CI users (Mauger et al, 2012). A CI-specific noise reduction technology was therefore developed and has shown significant improvement in sentence perception of 7 percentage points for words in SWN compared to those developed for hearing aids (Mauger et al, 2012). Listening quality in SWN, 20-talker babble, and 4-talker babble was also found to be significantly improved compared to no noise reduction and noise reduction designed for hearing aids (Mauger et al, 2012).
Annoyance from wind noise is a common complaint from hearing aid and CI recipients. Wind noise is even more problematic with directional microphone systems compared to omnidirectional microphones. Studies have shown that between 1 and 14 dB of noise in frequencies below 400 Hz (Chung et al, 2009; Chung & McKibben, 2011; Chung, 2012) and distortions to microphone directionality (Chung, 2012) can be caused by wind noise. Methods to reduce wind noise include switching from a directional to omnimicrophone pattern, attenuating low frequency noise (Chung, 2004), or possibly through the use of background noise reduction technologies (Chung, 2012).
One pilot study has investigated wind noise reduction in Nucleus CI sound processors (Goorevich et al, 2012). In this study wind noise was detected by measuring the correlation between the two microphone inputs. When wind was detected, the microphone directionality was switched to a low-directionality microphone optimized for use in wind. Further to this, specifically designed low-level narrow-band compressors were then activated to reduce the effect of wind noise in the low frequency channels while leaving mid and high frequency channels generally unchanged. This method of wind detection and reduction indicated positive speech understanding and listening quality results (Goorevich et al, 2012).
Directional microphones work by retaining signals from in front of a listener, while attenuating distracting sounds from other directions. Adaptive directional microphones are able to change the direction of maximum attenuation depending on the direction of noise sources. In practice, this helps hearing-impaired listeners in challenging listening situations, such as in restaurants, offices, and classrooms. In contrast, omnidirectional microphones do not provide attenuation of signals from any direction.
It is well established that directional microphone technologies provide superior speech understanding benefits when compared to omnidirectional microphones for individuals with hearing impairment (Chung et al, 2006; Chung & Zeng, 2009).
Cochlear’s first commercial sound processor, the wearable sound processor (WSP I), contained a hardware directional microphone, which had a sub-cardioid pattern providing a moderate free-field attenuation of 5 dB at 180°. This directional microphone was achieved through having two ports leading to a single microphone to create a fixed directional polar pattern, known as a dual-port directional microphone. In 1997 Cochlear released the body-worn Audallion BEAMformer, capable of using directional microphone technology to strongly attenuate noise to the rear and side directions. This system included two dual-port microphones located on two behind-the-ear devices that could be used to create a strong directional microphone (Figueiredo et al, 2001; Spriet et al, 2007). This dual-microphone system was superior to the dual-port microphones as input processing could use the two microphones to create a range of strong directionality patterns. Dual-port microphones are restricted to one fixed moderate strength polar pattern. The disadvantage of the Audallion system was the body-worn hardware configuration. The Nucleus Freedom sound processor overcame this disadvantage as it contained two microphones in a single ear level sound processor. This processor had one dual-port fixed directional microphone and one omnidirectional microphone. The dual-port microphone provided the same moderately directional microphone pattern used in all previous processors and was therefore called Standard directionality. Input processing used the dual-port microphone and the additional omnidirectional microphone to provide a strongly directional microphone called BEAM, which could adapt its maximum attenuation to the direction of competing noise (Spriet et al, 2007). CI users changed programs manually on their sound processor in order to change the microphone directionality. BEAM provided between 6 dB and 16 dB improvement in speech reception thresholds (SRTs) compared to Standard directionality in certain listening environments, offering enormous performance benefits for hearing in noise (Spriet, et al, 2007). The SRT in this study was defined as the signal-to-noise ratio (SNR) where 50% of the speech was correctly understood.
The Nucleus 5 sound processor was released in 2009 and contained two omnidirectional microphones. Removal of the dual-port microphone reduced the processor size without limiting the range of possible polar patterns. Input processing using the two omnidirectional microphones was used to create three directional microphone options. Two were similar to the directional microphones available in Freedom, being Standard (moderately directional microphone) and BEAM (adaptive directional microphone). A third was a new fixed highly directional microphone called zoom, which had a super-cardioid pattern providing 20-dB free-field attenuation at 120°. One study comparing the Nucleus 5 zoom directional microphone to the Freedom Standard and Nucleus 5 Standard directional microphones showed SRT improvements of 8.6 and 7.8 dB respectively (Wolfe et al, 2012). CI users wishing to utilize different microphone polar patterns for different noise situations could use either the processor or a remote assistant to manually change programs.
A suite of SmartSound technologies are available on the current Nucleus 5 sound processor (e.g. ASC, ADRO, Whisper, zoom, & BEAM). These technologies are typically provided to recipients via a number of different listening programmes that can be changed using a remote assistant or via the processor buttons. Up to four programs are provided according to the listening environment: Everyday, Noise, Focus, and Music. A number of factors including dexterity issues, the need to change programs manually, the uncertainty of when to change programs, the possibility of selecting a sub-optimal program in certain listening environments, or not having access to some technologies on their processor could result in many users not achieving their best hearing performance at all times. Using different directional microphones such as Standard, zoom, and BEAM require user activation and deactivation through program selection. Some SmartSound technologies (e.g. ASC and ADRO) are able to automatically adjust, driven through measures such as signal level. More accurate and sophisticated automatic program selection may provide additional benefit to Nucleus CI recipients.
In the hearing-aid industry, there are a range of technologies which analyse a user’s listening environment to determine audio characteristics for automatic program selection, such as the levels and types of noise and the presence of speech (Allegro et al, 2001). One of the key listening environment analysis technologies used in state-of-the art hearing aids involves environmental classification whereby the acoustic input or audio signal is categorized into one or more scenes. An example set of such scenes might include Speech, Speech in Noise, Noise, and Music (Allegro et al, 2001; Buchler et al, 2005). Automatic scene classification technologies can minimize user interaction via automatic programs that select appropriate input processing technologies for each listening environment (Hamacher et al, 2005). Recent CI pilot research has shown that this type of automatic scene classification and program selection, which operates without user interaction can benefit users (Case et al, 2011; Goorevich et al, 2012).
The implementation of SCAN in the Nucleus 6 system occurs in three stages; feature extraction, environment classification, and program selection. The first stage analyses the microphone input signal, extracting a number of specific signal features to assist with classification. For example, determining the amount of modulation in the input signal permits the classification of mainly speech alone as opposed to mainly noise environments. By additionally extracting pitch and tonal information, the detection of noise versus music environments becomes possible. The second stage uses the extracted features in a rules based classifier structure with the extracted features as input, to determine the most probable listening environment from a closed set of scenes (Speech in Noise, Speech, Noise, Wind, Quiet, and Music). The rules for the classifier structure were founded on large sets of training data during the development of SmartSound iQ. The third stage of SCAN uses the determined scene to decide if and when to apply a change to the current program. Program changes are applied slowly so as to avoid abrupt and disruptive listening changes for the recipient.
The Nucleus 6 sound processor is the first commercial CI system to incorporate environmental scene classification for the automatic selection of input sound processing technologies. The SmartSound iQ scene classifier technology is called SCAN. SCAN classifies the sound environment into one of six scenes (Speech in Noise, Speech, Noise, Wind, Quiet, and Music).
The Nucleus 6 sound processor offers the dual omnidirectional microphone technology, with full range of microphone directionality patterns. However, the addition of SmartSound iQ and SCAN offers automatic detection of a user’s listening environment, and selection of appropriate microphone directionality without the need for multiple processor programs and manual program changes.
The default program, SCAN, incorporates the automatic selection of the most appropriate microphone directionality pattern and activates the WNR technology based on the determined environment. The three microphone directionalities are activated depending on the detected scene. Standard microphone directionality is activated in the Quiet, Speech, and Music scenes, zoom is activated in the Noise scene, and BEAM is activated in the Speech in Noise scene. WNR is activated in the Wind scene. Other technologies such as ADRO, ASC and SNR-NR are available in all scenes.
In addition to controlling the input processing technologies selected for each scene, the automatic scene classifier stores the current scene classification on the sound processor as well as displaying it on the new CR230 remote assistant. This data log of scene information on the Nucleus 6 sound processor can be reviewed offline by a clinician for troubleshooting, or program optimization. Data Logging in Nucleus 6 introduces an industry-first tool to assist in the clinical care and counseling of recipients. By providing the clinician with information on key recipient behavior and experience, this tool can help with therapy compliance and progress, provide feedback for counseling and device use, support in troubleshooting, and may guide recipient fitting (Botros et al, 2013). Data Logging in Nucleus 6 reports the average daily time a recipient has used the device; the listening environment experienced since last clinic visit in the form of scene; the loudness of listening environments in the form of a histogram; the recipient use of programs, volume and sensitivity settings; and the use of assistive listening devices such as FM, telecoil, or other audio accessories. This information provides clinicians and care givers an objective insight to aid recipient care and counseling.
Materials and Methods
Research participants
A total of 21 research participants implanted with a Cochlear Nucleus CI system participated in the study. Research participants were recruited and tested in Sydney (n = 13) and Melbourne (n = 8), Australia. The study was approved in Sydney by the Royal Prince Alfred Hospital, Human Research Ethics Committee (X11-0191 & HREC/11/RPAH/277), and in Melbourne by the Royal Victorian Eye and Ear Hospital, Human Research Ethics Committee (07/754H/12). All participants in the study gave written informed consent as approved by the respective Human Research Ethics committees. The inclusion criteria for all research participants were; at least 18 years old, implanted with either the Freedom or CI500 series implant, at least three months CI experience after activation, post-lingual onset of bilateral severe-to-profound sensory-neural hearing loss with no congenital components to the hearing loss, native Australian English speaker, willingness to participate and to comply with all requirements of the protocol, and able to score 30% or more at + 15 dB SNR in an open-set test with their CI alone. There was no in-kind or monetary incentive for participation in this study. Biographical details and implant type for each subject are shown in Table 1. All were experienced users, with duration of CI use ranging from 1 to 10 years. Four participants were tested as bilateral CI users. In these cases both ears were fitted with the same processor type, and both processors were used in testing. For participants with any useful residual hearing in the contralateral ear, any hearing device was removed and the ear was occluded.
Table 1.
Biographical data of research participants. The Nucleus 5 program that research participants preferred to use in noise environments is displayed in the right column. Participants 1 to 13 were tested in Sydney, and participants 14 to 21 were tested in Melbourne.
|
Implant type |
||||||
|---|---|---|---|---|---|---|
| Participant | Gender | Age (years) | Implant use (years) | Left | Right | Preferred CP810 program in noise |
| 1 | M | 77 | 7 | CI24RE(straight) | ZOOM+ ADRO+ ASC | |
| 2 | M | 82 | 8 | CI24RE(CA) | ZOOM+ ADRO+ ASC | |
| 3 | F | 69 | 1 | xCI512 | BEAM+ ADRO+ ASC | |
| 4 | F | 75 | 5 | CI24RE(straight) | CI512 | ZOOM+ ADRO+ ASC |
| 5 | F | 54 | 7 | CI24RE(CA) | CI24RE (CA) | ZOOM+ ADRO+ ASC |
| 6 | M | 90 | 3 | CI512 | ZOOM+ ADRO+ ASC | |
| 7 | F | 75 | 5 | HybridL24 | ADRO+ ASC | |
| 8 | M | 83 | 3 | CI24RE(CA) | BEAM+ ADRO+ ASC | |
| 9 | F | 67 | 3 | CI24RE(straight) | ZOOM+ ADRO+ ASC | |
| 10 | F | 54 | 3 | CI24RE(CA) | ZOOM+ ADRO+ ASC | |
| 11 | M | 70 | 4 | CI24RE(CA) | ZOOM+ ADRO+ ASC | |
| 12 | F | 66 | 1 | CI24RE(CA) | ZOOM+ ADRO+ ASC | |
| 13 | M | 65 | 3 | CI512 | CI24RE (CA) | ZOOM+ ADRO+ ASC |
| 14 | M | 68 | 3 | CI24RE(CA) | ZOOM+ ADRO+ ASC | |
| 15 | M | 73 | 6 | CI24RE(CA) | ADRO+ ASC | |
| 16 | M | 54 | 4 | CI24RE(CA) | BEAM+ ADRO+ ASC | |
| 17 | F | 51 | 10 | CI24RE(CA) | CI24RE (straight) | NONE |
| 18 | F | 49 | 3 | CI24RE(CA) | ZOOM+ ADRO+ ASC | |
| 19 | F | 67 | 2 | CI512 | BEAM+ ADRO+ ASC | |
| 20 | M | 55 | 8 | CI24RE(CA) | ADRO+ WHISPER | |
| 21 | F | 79 | 3 | CI24RE(CA) | BEAM+ ADRO+ ASC | |
Study design
The study used a repeated measures, single-subject design in which subjects served as their own controls. Each research participants (13 from Sydney, and eight from Melbourne) completed all five test sessions.
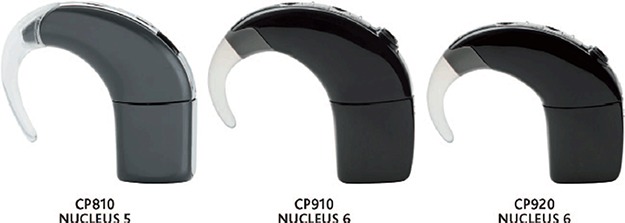
Performance of CI recipients was compared with a Nucleus 5 sound processor versus the new Nucleus 6 sound processor with SmartSound iQ. A range of programs were tested in quiet and noise, each containing different technologies as shown in Table 2. With the Nucleus 5 sound processor (CP810), recipients used the Everyday default program in quiet and their preferred listening program in noise as shown in Table 1. The Nucleus 6 sound processor (CP900 series sound processor, Figure 1) was evaluated using the default automatic SCAN program, as well as a number of custom programs including None (SmartSound iQ off), Standard (ADRO+ ASC), Whisper, zoom, and BEAM (Table 2).
Figure 1.
The Nucleus 5 (CP810) processor (left) and the Nucleus 6 processors (CP900 series) used in this study. The CP810 and CP910 (middle) processors have an accessory port. The CP920 processor (right) does not have an accessory port and is smaller in height.
Table 2.
Description of the technologies used in each program. A tick designates the use of the specific technology in a program. For the Nucleus 5 Preferred program, research participants selected the program they would use in a noisy situation. Research participants selected their preferred Nucleus 5 program in noise, with this possible choice designated by a tilde (∼). Individual program selections are displayed in Table 1.
|
Audibility |
Microphone directionality |
Difficult environments |
Automation SCAN | ||||||||
|---|---|---|---|---|---|---|---|---|---|---|---|
| System | Program | AGC | ASC | ADRO | Whisper | Standard | zoom | BEAM | SNR-NR | WNR | |
| Nucleus 5 | Everyday | ✓ | ✓ | ✓ | ✓ | ||||||
| Nucleus 5 | Preferred | ✓ | ∼ | ∼ | ∼ | ∼ | ∼ | ∼ | |||
| Nucleus 6 | None | ✓ | ✓ | ||||||||
| Nucleus 6 | Whisper | ✓ | ✓ | ✓ | ✓ | ||||||
| Nucleus 6 | Standard | ✓ | ✓ | ✓ | ✓ | ||||||
| Nucleus 6 | zoom | ✓ | ✓ | ✓ | ✓ | ||||||
| Nucleus 6 | BEAM | ✓ | ✓ | ✓ | ✓ | ||||||
| Nucleus 6 | SCAN | ✓ | ✓ | ✓ | ✓ | ✓ | ✓ | ||||
At the beginning of each study, all participants were provided with a Nucleus 6 processor, and had at least two weeks of use with this processor before their first test session. During the acclimatization period and during the study, four programs were provided on the Nucleus 6 processor. Three were recipients most used programs from their previous processor and the fourth was the default Nucleus 6 program SCAN. This allowed research participants to gain exposure to a range of sound processing technologies before their first test session.
Test procedures in quiet and noise
Five test sessions were conducted (Table 3), spaced approximately one week apart. These sessions were used to assess performance in quiet and in noise and in different spatial configurations.
Table 3.
Test session summary. Speech material, masking noise, and speaker configurations used in the five test sessions.
| Session | Speech | Noise | Speaker configuration |
|---|---|---|---|
| 1 | words | – | Speech 0° |
| 2 | sentences | SWN | Speech 0°, Noise 0° |
| 3 | sentences | 4TB | Speech 0°, Noise 0° |
| 4 | sentences | SWN | Speech 0°, Noise 90°, 180°, 270° |
| 5 | sentences | 4TB | Speech 0°, Noise 90°, 180°, 270° |
Open set monosyllabic words were presented in quiet at 50 dB SPL. These words were based on the original consonant-vowel Nucleus-consonant (CNC) words by Peterson and Lehiste (1962). Despite different words being used, the CNC structure was maintained and lists contained the same number of words (50 per list) and frequency of occurrence of phonemes. Two lists of Australian CNC words (100 words) were presented for each treatment condition.
Speech understanding in noise was assessed using the Australian sentence test in noise (Dawson et al, 2013). The test is an adaptive speech in noise test used to determine the SRT, defined as the SNR for 50% sentence understanding. The sentence material was developed and recorded for Australian use and is similar to the Bamford-Kowal-Bench sentences (Bench et al, 1979). Short open-set BKB-like sentences spoken by an Australian female were presented at 65 dB SPL in the presence of continuous background noise. The noise level of which was adapted based on the subject’s response. Background noise was presented for 12 seconds before the first sentence. The noise level was increased if 50% or more of the morphemes in the sentence were repeated correctly; otherwise the noise level was reduced. The noise level was adjusted by 4 dB for the first four sentences, and by 2 dB for the remaining sixteen sentences. Following each adjustment was a three second period of noise at the new level and a beep cue before the next sentence was presented. The SRT was calculated as the mean SNR for sentences 5–20 and also the SNR at which sentence 21 would have been presented based on the subject’s response to sentence 20.
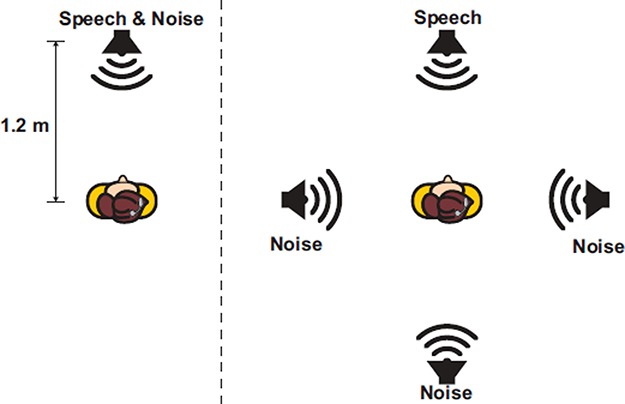
Noise testing was conducted using both SWN which had the international long-term average speech spectra (Byrne et al, 1994) and 4-talker babble noise. Both noise types were tested in two different spatial configurations (Figure 2), with the signal at 0° and the noise at 0° (S0N0), and with the signal at 0° and the noise at 90°, 180°, and 270° (S0N3). One SRT sentence list was presented per condition. The S0N3 condition is a booth recreation of a situation such as a CI user talking to someone seated across a restaurant table, while people at other tables to the side and behind the CI user are also having conversations. All speech and noise configurations had the speaker location at 1.2 m from the listening position. The sound field produced by each loud-speaker was calibrated at the position of the listener, using 1/3 octave narrowband noise centered at 1000 Hz presented at 65 dB. Each noise type was calibrated so that 65 dB referred to the total sound pressure level produced when all contributing maskers were presented, measured at the listening position without the listener present. For the three noise configuration, the levels of the individual maskers were reduced to ensure the total noise level was consistent (Hersbach et al, 2012).
Figure 2.
Speaker configurations. The left diagram shows the speech and noise presented in front of the listener (S0N0). The right diagram shows the speech presented in front of the listener and the noise at 90°, 180°, and 270° (S0N3).
When the Nucleus 6 SCAN program was tested, the automatic scene classifier scene selection was displayed on the Remote Assistant. This scene was only viewed by the audiologist and recorded prior to the first sentence and at the conclusion of each sentence in the list.
Data analysis
To determine the effect of program, group analysis used a repeated measures one-way analysis-of-variance (ANOVA) with post-hoc Newman-Keuls comparisons. An alpha value of 0.05 was used to determine significance. All comparisons used a two-tailed analysis.
To determine the effect of program for individual subjects, 95% two-tailed confidence limits were established for quiet, SWN and 4-talker babble. A 95% critical difference score of 12.8 percentage points has previously been reported for Australian CNC words by Hersbach et al (2012) for two lists per condition under comparison, and was also used in this study. A 95% critical difference score of 2.99 dB was calculated by Dawson et al (2013) for the adaptive speech test conducted in 4-talker babble, and was used in this study. No previous studies have described the critical difference for this test conducted in SWN. To calculate a critical difference in SWN a retrospective analysis of data from 25 individuals with a total of 115 test-retest pairs was performed. A standard deviation of difference scores of 1.86 dB was found. This standard deviation was then multiplied by 1.96 to derive a two-tailed critical difference of 3.66 dB at the 95% confidence level.
Results
Speech in quiet
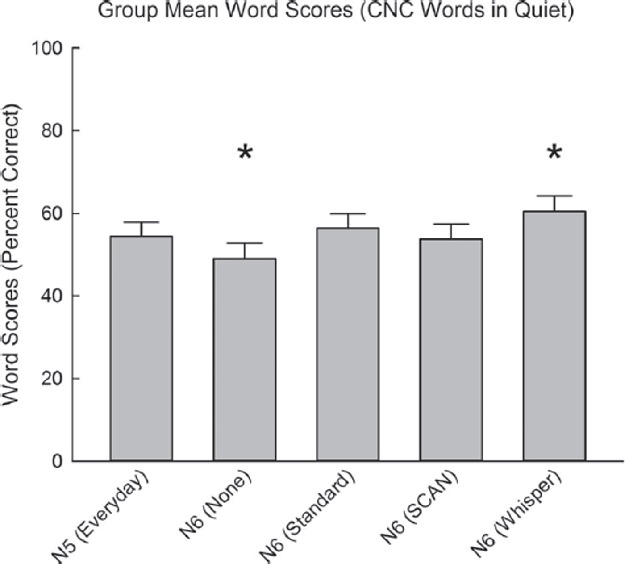
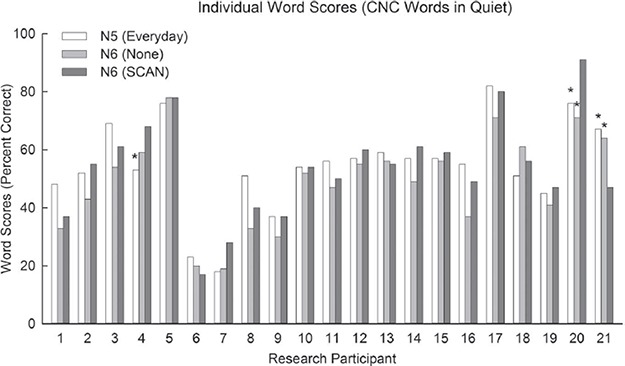
Group mean scores for all programs tested were 54.4%, 49.0%, 56.4%, 53.8%, and 60.4% correct for the Nucleus 5 Everyday, Nucleus 6 None, Standard, SCAN and Whisper programs, respectively (Figure 3). A repeated-measures one-way ANOVA showed a significant effect of program type (F(4,80) = 12.5, p < 0.001). Post-hoc comparisons showed significant decreases in word scores for the Nucleus 6 None compared to the Nucleus 6 SCAN and Nucleus 5 Preferred programs (p < 0.005), and Nucleus 6 Standard and Whisper programs (p < 0.001). The Nucleus 6 Whisper program had a significant increase in word score compared to the Nucleus 5 Everyday program (p < 0.01), Nucleus 6 SCAN, and None programs (p < 0.001), and Nucleus 6 Standard program (p < 0.05). No significant differences were found between the Nucleus 5 Everyday, Nucleus 6 Standard, and SCAN programs. Individual results for CNC words in quiet comparing the Nucleus 5 Everyday, Nucleus 6 None, and Nucleus 6 SCAN are shown in Figure 4. Given the calculated critical difference of 12.8 percentage points, two individuals showed an improvement and one individual showed a decrement in performance with Nucleus 6 SCAN compared to Nucleus 5 Preferred. One individual showed an improvement and one individual showed a decrement with Nucleus 6 SCAN compared to Nucleus 6 None.
Figure 3.
Mean group word perception scores in quiet for subjects preferred Nucleus 5 program, and Nucleus 6 None, Standard, SCAN, and Whisper programs. Significance compared to all other programs is shown by a large asterisk. Error bars show standard error for each program.
Figure 4.
Individual word perception scores in quiet for the Nucleus 5 Standard program, Nucleus 6 None, and Nucleus 6 SmartSound iQ default program SCAN. Significant differences between Nucleus 5 Preferred and Nucleus 6 SCAN are shown by an asterisk above the Nucleus 5 Preferred bar. Likewise, a significant difference between Nucleus 6 None and Nucleus 6 SCAN are shown by an asterisk above the Nucleus 6 None bar.
Speech in SWN with S0N0 speaker configuration
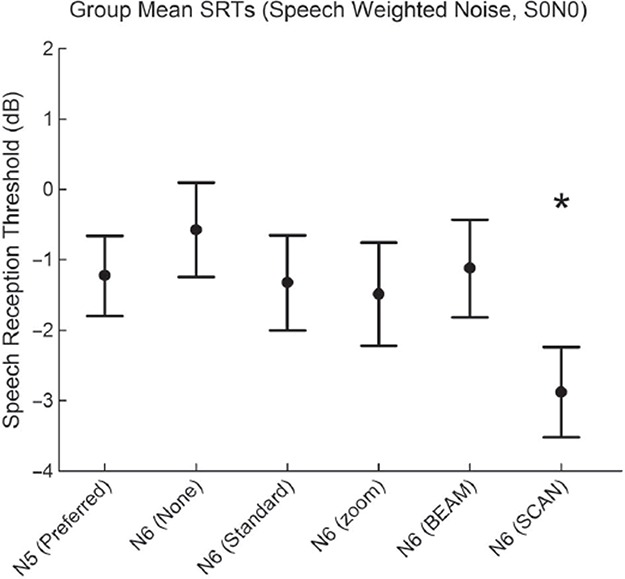
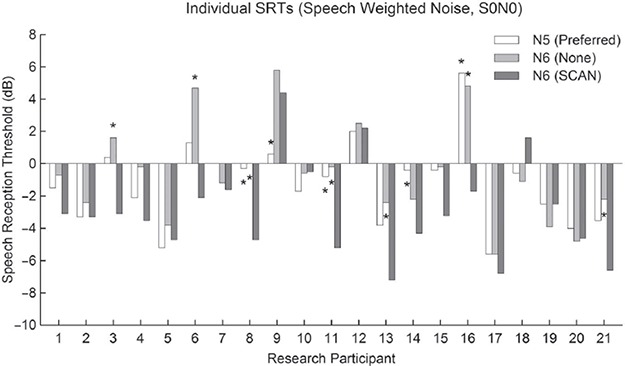
Group mean SRT scores of − 1.2 dB, − 0.6 dB, − 1.3 dB, − 1.5 dB, − 1.1 dB, and − 2.9 dB were found for the Nucleus 5 Preferred, Nucleus 6 None, Standard, zoom, BEAM, and SCAN programs respectively (Figure 5). A repeated measures one-way ANOVA showed a significant effect of program type (F(5,100) = 6.5, p < 0.001). Post-hoc comparisons showed a significant improvement of Nucleus 6 SCAN compared to all other programs; Nucleus 5 Preferred (p < 0.01), Nucleus 6 None (p < 0.001), Standard (p < 0.01), zoom (p < 0.01), and BEAM (p < 0.001). No significant difference was found between any of the other programs. Individual SRT scores in SWN (S0N0) for Nucleus 5 Preferred, Nucleus 6 None, and Nucleus 6 SCAN programs are shown in Figure 6. Given the calculated critical difference of 3.66 dB, four individuals showed an improvement and one individual showed a decrement with Nucleus 6 SCAN compared to Nucleus 5 Preferred. Seven individuals showed an improvement with Nucleus 6 SCAN compared to Nucleus 6 None.
Figure 5.
Mean SRT scores for SWN in the S0N0 speaker configuration. Nucleus 6 SCAN shows a significant improvement in speech understanding compared to all other programs, and is shown by a large asterisk. Error bars show standard error for each program.
Figure 6.
Individual SRT scores for SWN with the S0N0 speaker configuration for the Nucleus 5 Preferred, Nucleus 6 None, and Nucleus 6 SCAN programs. Significant differences between Nucleus 5 Preferred and Nucleus 6 SCAN are shown by an asterisk above the Nucleus 5 Preferred bar. Likewise, a significant difference between Nucleus 6 None and Nucleus 6 SCAN is shown by an asterisk above the Nucleus 6 None bar.
Speech in 4-talker babble with S0N0 speaker configuration
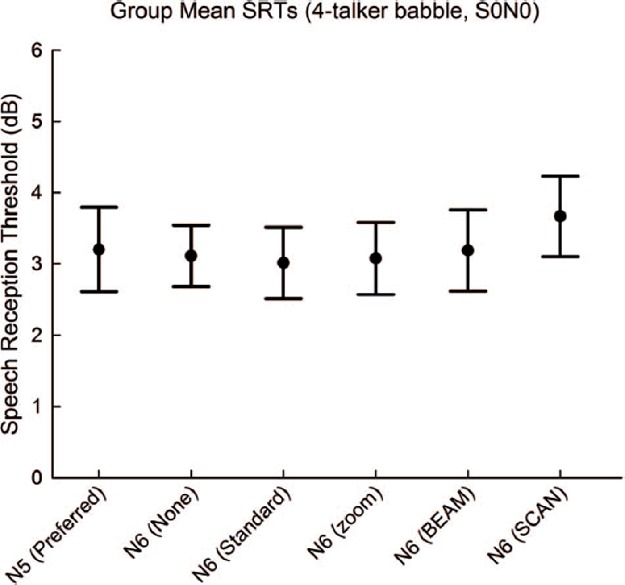
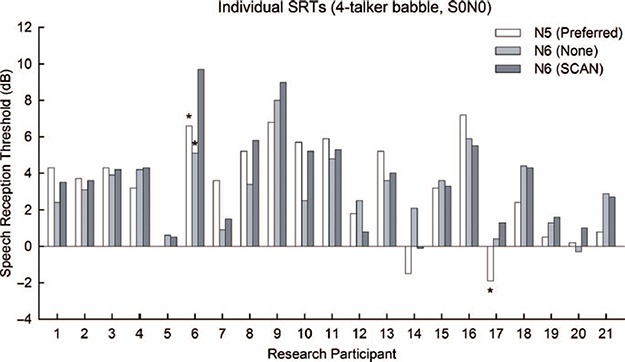
Group mean SRT scores in 4-talker babble (S0N0) are shown in Figure 7. A repeated measures one-way ANOVA found no significant difference between programs (F(5,100) = 0.94, p = 0.46). Individual SRT scores in 4-talker babble (S0N0) for Nucleus 5 Preferred, Nucleus 6 None, and Nucleus 6 SCAN programs are shown in Figure 8. Given the calculated critical difference of 2.99 dB, two individuals showed a decrement with Nucleus 6 SCAN compared to Nucleus 5 Preferred. One individual showed a decrement with Nucleus 6 SCAN compared to Nucleus 6 None.
Figure 7.
Mean SRT scores for 4-talker babble in the S0N0 speaker configuration. No difference was found between any of the programs. Error bars show standard error for each program.
Figure 8.
Individual SRT scores in 4-talker babble with the S0N0 speaker configuration for the Nucleus 5 Preferred program, Nucleus 6 None program, and Nucleus 6 SCAN programs. Significant differences between Nucleus 5 Preferred and Nucleus 6 SCAN are shown by an asterisk above the Nucleus 5 Preferred bar. Likewise, a significant difference between Nucleus 6 None and Nucleus 6 SCAN is shown by an asterisk above the Nucleus 6 None bar.
Speech in SWN with S0N3 speaker configuration
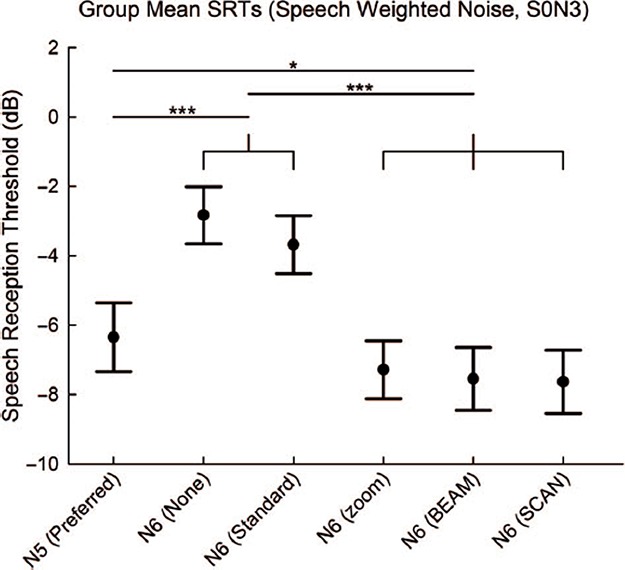
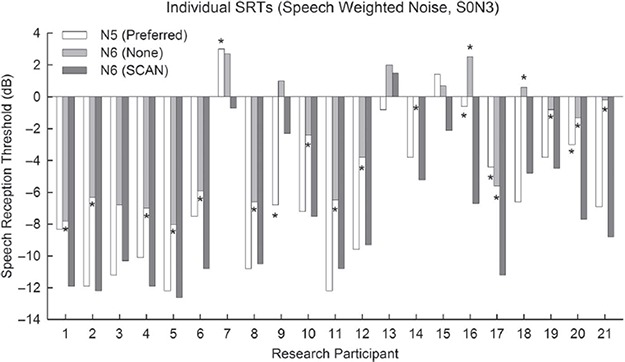
Group mean SRT scores of − 6.3 dB, − 2.8 dB, − 3.7 dB, − 7.3 dB, − 7.5 dB, and − 7.6 dB were found for Nucleus 5 Preferred, Nucleus 6 None, Standard, zoom, BEAM, and SCAN, respectively (Figure 9). A repeated measures one-way ANOVA showed a significant effect of program type (F(5,100) = 40.8, p < 0.001). Post-hoc comparisons showed significant differences between Nucleus 6 SCAN, BEAM, and zoom programs compared to the Nucleus 5 Preferred program (p < 0.05) and Nucleus 6 None and Standard programs (p < 0.001). A significant difference between the Nucleus 5 Preferred program and both the Nucleus 6 None and Standard programs was found (p < 0.001). No significant differences were found between the Nucleus 6 zoom, BEAM, and SCAN programs or between the Nucleus 6 None and Standard programs. Individual SRT scores in SWN (S0N3) for Nucleus 5 Preferred, Nucleus 6 None and Nucleus 6 SCAN programs are shown in Figure 10. Given the calculated critical difference of 3.66 dB, four individuals showed an improvement and one individual showed a decrement with Nucleus 6 SCAN compared to Nucleus 5 Preferred. Sixteen individuals showed an improvement with Nucleus 6 SCAN compared to Nucleus 6 None.
Figure 9.
Mean SRT scores for SWN in the S0N3 speaker configuration. Significant improvements are shown by bars above the programs with significant differences indicated by asterisks (*p < 0.05, ***p < 0.001). Error bars show standard error for each program.
Figure 10.
Individual SRT scores in SWN with the S0N3 speaker configuration for the Nucleus 5 Preferred, Nucleus 6 None, and Nucleus 6 SCAN programs. A significant difference between Nucleus 5 Preferred and Nucleus 6 SCAN is shown by an asterisk above the Nucleus 5 Preferred bar. Likewise, a significant difference between Nucleus 6 None and Nucleus 6 SCAN is shown by an asterisk above the Nucleus 6 None bar.
Speech in 4-talker babble with S0N3 speaker configuration
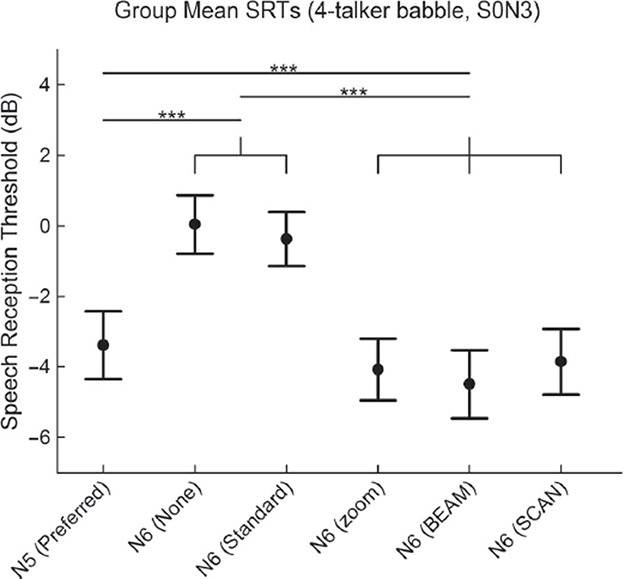
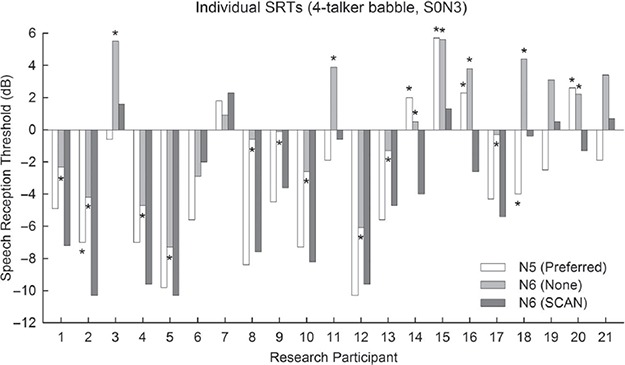
Group mean SRT scores of − 3.4 dB, 0.0 dB, − 0.4 dB, − 4.1 dB, − 4.5 dB, and − 3.9 dB were found for Nucleus 5 Preferred, Nucleus 6 None, Standard, zoom, BEAM, and SCAN programs respectively (Figure 11). A repeated measures one-way ANOVA showed a significant effect of program (F(5,100) = 34.4, p < 0.001). Post-hoc comparisons showed significant differences for the Nucleus 6 SCAN, BEAM and zoom programs compared to the Nucleus 5 Preferred program (p < 0.001) and the Nucleus 6 None and Standard programs (p < 0.001). A significant difference between the Nucleus 5 Preferred program and both the Nucleus 6 None and Standard programs was found (p < 0.001). No significant differences were found between the Nucleus 6 zoom, BEAM, and SCAN programs or between the Nucleus 6 None and Standard programs. Individual SRT scores in 4-talker babble (S0N3) for Nucleus 5 Preferred, Nucleus 6 None, and Nucleus 6 SCAN programs are shown in Figure 12. Given the calculated critical difference of 2.99 dB, five individuals showed an improvement and two individuals showed a decrement with Nucleus 6 SCAN compared to Nucleus 5 Preferred. Seventeen individuals showed an improvement with Nucleus 6 SCAN compared to Nucleus 6 Preferred.
Figure 11.
Mean SRT scores for 4-talker babble in the S0N3 speaker configuration. Significant improvements are shown by bars above the programs with significant differences indicated by asterisks (***p < 0.001). Error bars show standard error for each program.
Figure 12.
Individual SRT scores in 4-talker babble with the S0N3 speaker configuration for the Nucleus 5 Preferred, Nucleus 6 None, and Nucleus 6 SCAN programs. A significant difference between Nucleus 5 Preferred and Nucleus 6 SCAN is shown by an asterisk above the Nucleus 5 Preferred bar. Likewise, a significant difference between Nucleus 6 None and Nucleus 6 SCAN is shown by an asterisk above the Nucleus 6 None bar.
SCAN scene classification
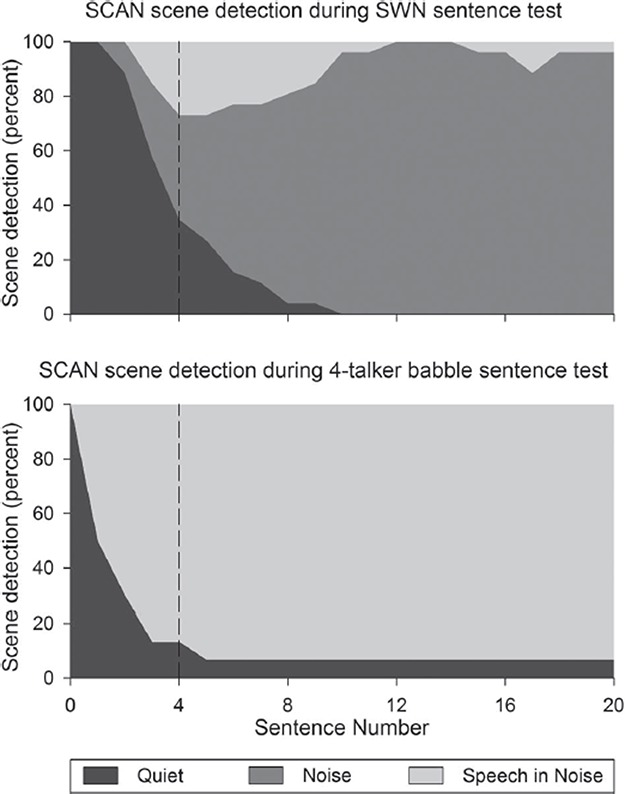
The scene selections as displayed on the remote assistant during S0N0 SWN and 4-talker babble testing were recorded. The scene selected across the research group by SCAN before the first sentence and after each of the 20 sentences is shown in Figure 13. Before the first sentence was presented, SCAN selected the Quiet scene as expected in quiet booth conditions. After presentation of the first four sentences in SWN, used to establish a suitable test SNR, SCAN remained in the Quiet scene for 34% of recipients, and detected a Noise scene for 38% and Speech in Noise scene for 27% of recipients. After presentation of the first four sentences in 4-talker babble, SCAN detected a Quiet scene for 13% of recipients, and a Speech in Noise scene for 87% of recipients. At the completion of the eighth sentence, SCAN was detecting a Noise scene for 77% of recipients in SWN and detecting a Speech in Noise scene for 93% of recipients in 4-talker babble.
Figure 13.
Percentage of research participants processors detecting each of the three scenes; Quiet, Noise, and Speech in Noise. The horizontal axis shows the sentence number during the 20 sentence SRT tests, and the vertical axis shows the percentage of scenes selected by the automatic program selection technology SCAN. All processors started in the quiet program before testing. A dashed line indicates the end of the fourth sentence, where the SNR is expected to be nearing subjects SRT.
Discussion
This study compared performance with the Nucleus 5 sound processor versus the new Nucleus 6 sound processor using SmartSound iQ. Speech perception was tested in quiet, and in SWN and 4-talker babble noise in both co-located and spatially separated speech and noise environments. In all noise conditions tested, group mean results showed the default Nucleus 6 SmartSound iQ program, SCAN, to provided equivalent or improved speech understanding compared to all other programs evaluated.
Speech testing in quiet showed a decrease in performance from the Nucleus 6 None program and an increase in performance from the Nucleus 6 Whisper program compared to the other programs. This is expected, since SmartSound iQ new technologies are designed primarily to address performance in noise environments. An average decrease of 7 percentage points for words was found with Nucleus 6 None compared to the Nucleus 6 Standard program, most likely due to ADRO not being activated. The Nucleus 6 Whisper program showed significantly better outcomes compared to all other Nucleus 5 and Nucleus 6 programs tested in quiet, with a mean 4 percentage point improvement compared to the Nucleus 6 Standard program. This performance increase is expected since Whisper has been shown to provide improved speech perception in quiet by increasing the output level of low level inputs (McDermott et al, 2002). Given this finding, it is suggested that the feasibility of integrating Whisper into the automatic scene classifier SCAN be considered.
In SWN with the speech and noise co-located (S0N0), a 1.7 dB mean improvement in SRT was found for Nucleus 6 SCAN compared to the Nucleus 5 Preferred program (Figure 5). The main difference between the two programs in this condition is the use of the SNR-NR technology, which reduces diffuse background noise (Mauger et al, 2012). Recipients upgrading from Nucleus 5 to Nucleus 6 can expect to benefit from access to SNR-NR in a range of noise environments like traffic noise and 20-talker babble, as shown in previous noise reduction studies (Dawson et al, 2011; Mauger et al, 2012). A slightly larger group benefit of 2.3 dB was shown with Nucleus 6 SCAN program compared to Nucleus 6 None program because in addition to SNR-NR being disabled, both ADRO and ASC were also disabled in this program. Due to the dynamic range similarity between 4-talker babble and the target speech no improvement in this condition was expected.
Single channel noise reduction technologies, which remove background noise, have shown significant improvements of 2.1 dB with no input processing (Dawson et al, 2011) and of 1.4 dB with ADRO and ASC (Hersbach et al, 2012) in SWN environments. The higher mean improvement in this study is possibly due to SNR-NR being optimized for CI use, with such CI specific implementations known to outperform noise reduction technologies developed for hearing aids (Mauger et al, 2012). In a previous noise reduction study by Dawson et al (2011) it was reported that a 1-dB improvement in SRT testing was equivalent to 12.3 percentage point improvement in fixed noise level testing in SWN. The 2.3-dB improvement in this study with SNR-NR compared to no input processing would therefore represent an approximate 28 percentage point sentence understanding improvement for fixed level noise testing.
No significant change was found with SNR-NR tested in spatially separated SWN (Figure 9). In a study by Hersbach et al (2012), significant additive benefits of SNR-NR in conjunction with a range of directional microphones were reported. Differences between the dynamically changing location and number of noise sources, as well as research participant performance levels may have contributed to the different outcomes in these two studies.
Figures 9 and 11 demonstrate the benefit of having the Nucleus 6 SCAN program enabled. Here a 4.0 dB mean improvement in SWN (Figure 9) and a 3.5 dB mean improvement in 4-talker babble (Figure 11) was found with Nucleus 6 SCAN compared to the Nucleus 6 Standard program. Even greater SRT mean improvements of 4.8 dB in SWN and a 3.9 dB in 4-talker babble were found with Nucleus 6 SCAN compared to the Nucleus 6 None program. SmartSound iQ delivers benefit in these noise environments in a number of ways. The directional microphones are automatically activated providing significant benefit with the highly directional microphone (zoom) in noise scenes and with the adaptive directional microphone (BEAM) in speech in noise scenes (Figure 13). SNR-NR is also expected to contribute to performance improvements in this spatially separated SWN condition. It is important to remember that the Standard directional microphone used as a baseline condition in this study is a moderate directional microphone, and would therefore still provide performance benefit compared to omnidirectional microphones.
Nucleus 6 SCAN was tested alongside three directional microphones patterns (Standard, zoom, and BEAM), implemented via custom programs. In all tests, no decrement was shown with Nucleus 6 SCAN compared to the best performing custom directional microphone program.
The results with Nucleus 6 SCAN in this study show that automatic scene classification and program selection represent a significant step towards improving patient outcomes in varying noise situations. This is the first study, to our knowledge, to use automatic scene classification and program selection in CI recipients. Further development of such technologies may reduce the need for multiple programs, minimize patient interaction with their sound processor, and have more recipients using input processing technologies effectively. Successful automation of the current technologies suggests that SCAN could be further expanded to detect a wider range of scenes and control a greater range of input processing technologies.
Clinical implications
This study’s findings show that SmartSound iQ provides benefit in a range of noise types and spatially separated noise environments by utilizing different technologies to suit specific listening conditions. The amount of benefit that is potentially available to recipients upgrading to Nucleus 6 greatly depends on their existing SmartSound user profile: whether that be an active user, a passive user, or a non SmartSound user.
Active SmartSound users are those experienced CI recipients who understand the purpose of the multiple listening programs available to them, and manually switch between them on a frequent basis. In this study, active users would be akin to participants evaluated with the Nucleus 5 Preferred program in noisy environments. This group showed 1.7 dB and 1.3 dB average improvement in speech understanding in the Noise, and Speech in Noise scene respectively using the automated SCAN program over their preferred Nucleus 5 programs. This result is expected to translate to real-world benefit since a clinically relevant results is suggested to be approximately 1 dB, arrived at through clinical consensus. This improvement is due to the new technologies available in SmartSound iQ as well as SCAN selecting a program that provided improved speech understanding compared to the experienced participants’ own program choices. Experienced SmartSound users stand to gain improved speech understanding outcomes as well as reducing the inconvenience of manually switching programs by upgrading to Nucleus 6.
Passive users could be described as recipients who access basic SmartSound options in a standard ‘Everyday’ default listening program, but who do not typically make any manual program changes throughout the day. In this study, passive users would be akin to subjects evaluated with the Nucleus 6 Standard program in quiet and noise environments. This group showed a large improvement in spatially separated speaker configurations in the Speech in Noise, and Noise scenes (3.5 to 4.0 dB), and in a co-located speaker configuration in the Noise scene (1.6 dB) by using the SmartSound iQ SCAN program compared to the Standard program. This improvement is due to access to directional microphones and SNR-NR. This suggests that passive SmartSound users who are reluctant to make manual processor changes, may benefit even more by using Nucleus 6 SCAN which will select the most advanced SmartSound iQ settings without any manual changes. Additionally, Nucleus 5 users who use a single program with zoom or BEAM always activated, may also benefit from SCAN when it transitions back to a standard directional microphone when appropriate conditions are detected.
The final category of CI recipients is individuals who do not access any SmartSound technologies. In this study this group is represented by the Nucleus 6 None program which uses the Standard directional microphone and all other technologies disabled. This group benefitted most when comparing their performance to SCAN in all scenes including spatially separated speaker configurations in the Speech in Noise, and Noise scenes (3.9 to 4.8 dB), quiet (5 percentage points), and co-located noise (2.3 dB). Results suggest that use of input processing technologies such as those provided by SmartSound iQ offer substantial hearing performance benefits, and that recipients who do not currently access them due to clinical fitting practices, choice of sound processor, or personal preference will gain significant benefit with the SmartSound iQ SCAN program.
The Nucleus 6 processor is currently available for recipients with CI24RE and CI500 series implants, and development is underway to also make it compatible for recipients with CI24R, CI24M, and CI22 implants. Nucleus 6 offers significant performance benefits via the suite of SmartSound iQ technologies to recipients upgrading from previous generation sound processors. The use of an automatic scene classifier (SCAN) extends this advantage further, by automatically and seamlessly selecting an appropriate listening program for a given environment, and minimizing the need for manual processor interaction. Nucleus 6 SCAN provided superior performance outcomes in noise compared to a range of Nucleus 6 custom programs.
Conclusions
The newly released Nucleus 6 system’s SmartSound iQ default program, SCAN, provides significantly better or equivalent speech understanding compared to Nucleus 5 programs and a range of Nucleus 6 programs. This paper describes the new technologies in SmartSound iQ and compares the clinical outcomes of the Nucleus 6 sound processor using SmartSound iQ with the previous generation Nucleus 5 system. SCAN was found to automatically select technologies that gave improved speech understanding compared to the user preferred Nucleus 5 noise program. All subjects successfully upgraded to the Nucleus 6 system, and accepted the new automated default SmartSound iQ settings.
Acknowledgements
The authors would like to thank Pam W Dawson for statistical analysis assistance and manuscript comments and Sasha Case for technical assistance. We would also like to thank Janine Del Dot, Anne Beiter, John Heasman, Rami Banna, and Ryan Carpenter for manuscript suggestions and edits. The authors acknowledge the financial support of the HEARing CRC, established and supported under the Cooperative Research Centres Program – an initiative of the Australian Government.
Footnotes
Declaration of interest The authors are employees of Cochlear Limited, the manufacturer of the technology described in the article.
References
- 1.Allegro S., Buchler M., Launer S. Automatic sound classification inspired by auditory scene analysis. Proc European Conf Sig Proc (EURASIP) 2001 [Google Scholar]
- 2.Balkany T., Hodges A., Menapace C., Hazard L., Driscoll C., et al. Nucleus Freedom North American clinical trial. Otolaryngol Head Neck Surg. 2007;136:757–762. doi: 10.1016/j.otohns.2007.01.006. [DOI] [PubMed] [Google Scholar]
- 3.Bench J., Kowal A., Bamford J. The BKB (Bamford-Kowal-Bench) sentence lists for partially-hearing children. Br J Audiol. 1979;13:108–112. doi: 10.3109/03005367909078884. [DOI] [PubMed] [Google Scholar]
- 4.Blamey P.J. Adaptive dynamic range optimization (ADRO): A digital amplification strategy for hearing aids and cochlear implants. Trends Amplif. 2005;9:77–98. doi: 10.1177/108471380500900203. [DOI] [PMC free article] [PubMed] [Google Scholar]
- 5.Botros A., Banna R., Maruthurkkara S. The next generation of Nucleus Fitting: A multiplatform approach towards universal cochlear implant management. Int J Audiol. 2013 doi: 10.3109/14992027.2013.781277. Early online. [DOI] [PMC free article] [PubMed] [Google Scholar]
- 6.Buchler M., Allegro S., Launer S. Sound classification in hearing aids inspired by auditory scene analysis. EURASIP Journal of Applied Signal Processing. 2005;18:2991–3002. [Google Scholar]
- 7.Byrne D., Dillon H., Tran K., Arlinger S., Wilbraham K., et al. An international comparison of long term average speech spectra. J Acoust Soc Am. 1994;96:2108. [Google Scholar]
- 8.Case S., Goorevich M., Gorrie J., Nesselroth Y., Plant K., et al. Evaluation of an environmental classifier with adult cochlear implant recipients using the CP810 sound processor CI2011 2011 [Google Scholar]
- 9.Chung K. Challenges and recent developments in hearing aids. Part I. Speech understanding in noise, microphone technologies and noise reduction algorithms. Trends Amplif. 2004;8:83–124. doi: 10.1177/108471380400800302. [DOI] [PMC free article] [PubMed] [Google Scholar]
- 10.Chung K. Wind noise in hearing aids: I. Effect of wide dynamic range compression and modulation-based noise reduction. Int J Audiol. 2012;51:16–28. doi: 10.3109/14992027.2011.609181. [DOI] [PubMed] [Google Scholar]
- 11.Chung K. Wind noise in hearing aids: II. Effect of microphone directivity. Int J Audiol. 2012;51:29–42. doi: 10.3109/14992027.2011.609184. [DOI] [PubMed] [Google Scholar]
- 12.Chung K., McKibben N. Microphone directionality, pre-emphasis filter, and wind noise in cochlear implants. J Am Acad Audiol. 2011;22:586–600. doi: 10.3766/jaaa.22.9.4. [DOI] [PubMed] [Google Scholar]
- 13.Chung K., Mongeau L., McKibben N. Wind noise in hearing aids with directional and omnidirectional microphones: Polar characteristics of behind-the-ear hearing aids. J Acoust Soc Am. 2009;125:2243–2259. doi: 10.1121/1.3086268. [DOI] [PubMed] [Google Scholar]
- 14.Chung K., Zeng F.G. Using hearing aid adaptive directional microphones to enhance cochlear implant performance. Hear Res. 2009;250:27–37. doi: 10.1016/j.heares.2009.01.005. [DOI] [PubMed] [Google Scholar]
- 15.Chung K., Zeng F.G., Acker K.N. Effects of directional microphone and adaptive multichannel noise reduction algorithm on cochlear implant performance. J Acoust Soc Am. 2006;120:2216–2227. doi: 10.1121/1.2258500. [DOI] [PubMed] [Google Scholar]
- 16.Cullington H.E., Zeng F.G. Speech recognition with varying numbers and types of competing talkers by normal-hearing, cochlear-implant, and implant simulation subjects. J Acoust Soc Am. 2008;123:450–461. doi: 10.1121/1.2805617. [DOI] [PubMed] [Google Scholar]
- 17.Dawson P., Hersbach A.A., Swanson B. An adaptive Australian sentence test in noise (AuSTIN) Ear Hear. 2013 doi: 10.1097/AUD.0b013e31828576fb. [DOI] [PubMed] [Google Scholar]
- 18.Dawson P.W., Mauger S.J., Hersbach A.A. Clinical evaluation of signal-to-noise ratio-based noise reduction in Nucleus(R) cochlear implant recipients. Ear Hear. 2011;32:382–390. doi: 10.1097/AUD.0b013e318201c200. [DOI] [PubMed] [Google Scholar]
- 19.Dorman M.F., Gifford R.H., Spahr A.J., McKarns S.A. The benefits of combining acoustic and electric stimulation for the recognition of speech, voice and melodies. Audiol Neurootol. 2008;13:105–112. doi: 10.1159/000111782. [DOI] [PMC free article] [PubMed] [Google Scholar]
- 20.Dowell R.C., Martin L.F., Clark G.M., Brown A.M. Results of a preliminary clinical trial on a multiple channel cochlear prosthesis. Ann Otol Rhinol Laryngol. 1985;94:244–250. [PubMed] [Google Scholar]
- 21.Figueiredo J.C., Abel S.M., Papsin B.C. The effect of the audallion BEAMformer noise reduction preprocessor on sound localization for cochlear implant users. Ear Hear. 2001;22:539–547. doi: 10.1097/00003446-200112000-00009. [DOI] [PubMed] [Google Scholar]
- 22.Gifford R.H., Shallop J.K., Peterson A.M. Speech recognition materials and ceiling effects: Considerations for cochlear implant programs. Audiol Neurootol. 2008;13:193–205. doi: 10.1159/000113510. [DOI] [PubMed] [Google Scholar]
- 23.Goorevich M., Case S., Gorrie J., Nesselroth Y., Plant K. Cochlear Implant Conference and other Impalntable Technologies. Baltimore: John Hopkins Medical School; 2012. Feasibility of an environmental classifier with adult cochlear implant recipients. [Google Scholar]
- 24.Goorevich M., Zakis J.A., Case S., Harvey T., Holmberg P., et al. 12th International Conference on Cochlear Implants and other Implantable Technologies. Baltimore, Maryland, USA.; 2012. Effect of a wind noise reduction algorithm on cochlear implant sound processing, [Google Scholar]
- 25.Hamacher V., Chalupper J., Eggers J., Fischer E., Kornagel U., et al. Signal processing in high-end hearing aids: State of the art, challenges, and future trends. EURASIP Journal of Applied Signal Processing. 2005;18:2915–2929. [Google Scholar]
- 26.Hersbach A.A., Arora K., Mauger S.J., Dawson P.W. Combining directional microphone and single-channel noise reduction algorithms: A clinical evaluation in difficult listening conditions with cochlear implant users. Ear Hear. 2012;33:e13–23. doi: 10.1097/AUD.0b013e31824b9e21. [DOI] [PubMed] [Google Scholar]
- 27.James C.J., Blamey P.J., Martin L., Swanson B., Just Y., et al. Adaptive dynamic range optimization for cochlear implants: A preliminary study. Ear Hear. 2002;23:49S–58S. doi: 10.1097/00003446-200202001-00006. [DOI] [PubMed] [Google Scholar]
- 28.Loizou P.C. Speech processing in vocoder-centric cochlear implants. Adv Otorhinolaryngol. 2006;64:109–143. doi: 10.1159/000094648. [DOI] [PubMed] [Google Scholar]
- 29.Mauger S.J., Arora K., Dawson P.W. Cochlear implant optimized noise reduction. J Neural Eng. 2012;9:065007. doi: 10.1088/1741-2560/9/6/065007. [DOI] [PubMed] [Google Scholar]
- 30.Mauger S.J., Dawson P.W., Hersbach A.A. Perceptually optimized gain function for cochlear implant signal-to-noise ratio based noise reduction. J Acoust Soc Am. 2012;131:327–336. doi: 10.1121/1.3665990. [DOI] [PubMed] [Google Scholar]
- 31.McDermott H.J., Henshall K.R., McKay C.M. Benefits of syllabic input compression for users of cochlear implants. J Am Acad Audiol. 2002;13:14–24. [PubMed] [Google Scholar]
- 32.Muller-Deile J., Kiefer J., Wyss J., Nicolai J., Battmer R. Performance benefits for adults using a cochlear implant with adaptive dynamic range optimization (ADRO): A comparative study. Cochlear Implants International. 2008;9:8–26. doi: 10.1179/cim.2008.9.1.8. [DOI] [PubMed] [Google Scholar]
- 33.Nelson P.B., Jin S.H., Carney A.E., Nelson D.A. Understanding speech in modulated interference: Cochlear implant users and normal-hearing listeners. J Acoust Soc Am. 2003;113:961–68. doi: 10.1121/1.1531983. [DOI] [PubMed] [Google Scholar]
- 34.Patrick J.F., Busby P.A., Gibson P.J. The development of the Nucleus Freedom Cochlear implant system. Trends Amplif. 2006;10:175–200. doi: 10.1177/1084713806296386. [DOI] [PMC free article] [PubMed] [Google Scholar]
- 35.Peterson G.E., Lehiste I. Revised CNC lists for auditory tests. The Journal of Speech and Hearing Disorders. 1962;27:62–70. doi: 10.1044/jshd.2701.62. [DOI] [PubMed] [Google Scholar]
- 36.Seligman P., Whitford L. Adjustment of appropriate signal levels in the Spectra 22 and mini speech processors. Ann Otol Rhinol Laryngol Suppl. 1995;166:172–175. [PubMed] [Google Scholar]
- 37.Skinner M.W., Arndt P.L., Staller S.J. Nucleus 24 advanced encoder conversion study: Performance versus preference. Ear Hear. 2002;23:2S–17S. doi: 10.1097/00003446-200202001-00002. [DOI] [PubMed] [Google Scholar]
- 38.Skinner M.W., Clark G.M., Whitford L.A., Seligman P.M., Staller S.J., et al. Evaluation of a new spectral peak coding strategy for the Nucleus 22 Channel Cochlear implant system. American Journal of Otology. 1994;15, Suppl 2:15–27. [PubMed] [Google Scholar]
- 39.Spriet A., Van Deun L., Eftaxiadis K., Laneau J., Moonen M., et al. Speech understanding in background noise with the two-microphone adaptive beamformer BEAM in the Nucleus Freedom Cochlear implant system. Ear Hear. 2007;28:62–72. doi: 10.1097/01.aud.0000252470.54246.54. [DOI] [PubMed] [Google Scholar]
- 40.Wolfe J., Parkinson A., Schafer E.C., Gilden J., Rehwinkel K., et al. Benefit of a commercially available cochlear implant processor with dual-microphone beamforming: A multi-center study. Otol Neurotol. 2012;33:553–560. doi: 10.1097/MAO.0b013e31825367a5. [DOI] [PubMed] [Google Scholar]
- 41.Wolfe J., Schafer E.C., Heldner B., Mulder H., Ward E., et al. Evaluation of speech recognition in noise with cochlear implants and dynamic FM. J Am Acad Audiol. 2009;20:409–421. doi: 10.3766/jaaa.20.7.3. [DOI] [PubMed] [Google Scholar]


