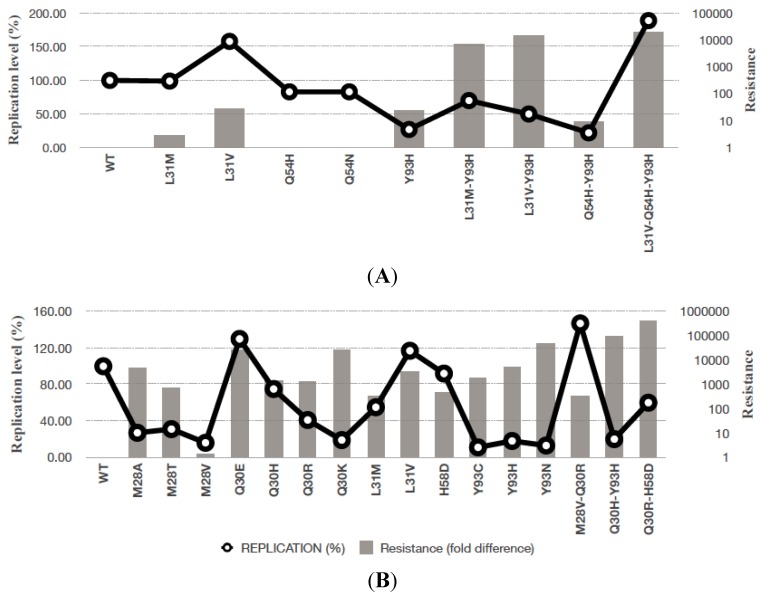
Figure 1.
Fitness and level of resistance of DCV-associated mutations assessed against HCV genotype 1a (A) and 1b (B) replicons. The bar chart represents the fold decrease in drug susceptibility of HCV variants compared with WT. Open circles show differences in replication capacity, respectively. The figure is adapted from Fridell and colleagues [34].

