Significance
Early growth response 2 (EGR2) is a transcription factor that can negatively regulate T-cell activation. We unexpectedly found that EGR2 promotes peripheral naïve T-cell proliferation and differentiation, with less T-cell receptor-induced IL-2 production in Egr2-deficient naïve T cells and diminished cytokine production in T-helper differentiated cells. Moreover, EGR2 was required for T-cell responses to influenza, with delayed viral clearance and more severe pathology in lungs of Egr2 conditional knockout mice, as well as decreased effector cytokine production from T cells. Thus, EGR2 can act as a positive regulator essential for a normal T-cell response to viral infection, a finding with potential clinical implications.
Keywords: EGR2, T cells, differentiation, RNA-Seq, influenza
Abstract
Early growth response 2 (EGR2) transcription factor negatively regulates T-cell activation, in contrast to the positive regulation of this process by EGR1. Here, we unexpectedly found that EGR2 promotes peripheral naïve T-cell differentiation, with delayed T-cell receptor-induced proliferation in naïve T cells from Egr2 conditional knockout (CKO) mice and decreased production of IFN-γ, IL-4, IL-9, and IL-17A in cells subjected to T-helper differentiation. Moreover, genes that promote T-cell activation, including Tbx21 and Notch1, had decreased expression in Egr2 CKO T cells and are direct EGR2 target genes. Following influenza infection, Egr2 CKO mice had delayed viral clearance, more weight loss, and more severe pathological changes in the lung than did WT and Egr1 KO mice, with decreased production of effector cytokines, increased infiltration of antigen-specific memory-precursor CD8+ T cells, and lower numbers of lung-resident memory CD8+ T cells. Thus, unexpectedly, EGR2 can function as a positive regulator that is essential for naïve T-cell differentiation and in vivo T-cell responses to a viral infection.
T-cell differentiation involves developmental checkpoints and the actions of multiple transcription factors, including the early growth response (EGR) factors (1). EGR proteins share highly conserved zinc-finger DNA-binding domains that can bind shared target genes (2). In thymocytes, Egr1, Egr2, and Egr3 are induced by pre–T-cell receptor (TCR) signaling and promote progression through the β-selection checkpoint (2). Egr1 is expressed in T cells and thymocytes and acts as a positive regulator for thymocyte development and T-cell activation (3). Egr2 is critical for hindbrain development and peripheral myelination, with perinatal death in Egr2 KO mice (4), but it also contributes to T- and B-cell development (5). Egr2 and Egr3 are NFAT target genes, and EGR2 induces NFAT-dependent regulation of Fas ligand (6). Egr2 is implicated in the development of T-cell anergy (7, 8). In CD2-specific Egr2 conditional knockout (CKO) mice, T cells had normal primary activation but hyperproliferated after prolonged stimulation, and older mice develop a lupus-like syndrome (9), with naïve CD4+ T cells prone to Th1 and particularly Th17 differentiation (10). Moreover, simultaneous deletion of Egr2 and Egr3 results in an autoimmune syndrome with increased activated STAT1 and STAT3 but impaired TCR-induced activation of AP-1 (11).
Although studies in vitro and in transgenic mice indicate that EGR2 can negatively regulate T-cell activation and contribute to T-cell anergy, studies of EGR2 in peripheral T-cell differentiation and responses to pathological conditions have been limited. Here, we show that Egr2 CKO naïve CD4+ and CD8+ T cells had delayed proliferation and impaired Th and Tc cell differentiation, implicating EGR2 as a positive regulator. IL-2 was diminished, a finding we confirmed in WT T cells in which EGR2 was reduced by treatment with siRNA. Moreover, after influenza infection, Egr2 CKO mice had greater weight loss and pathological changes in their lungs, delayed virus clearance, dysregulated cytokine and chemokine expression, and impaired CD4+ T-cell function with diminished IFN-γ, TNFα, and IL-2. In addition, more of the CD8+ T cells in the lung had a memory phenotype; decreased expression of granzyme B, perforin, IFN-γ, and TNFα; and lower numbers of lung-resident memory CD8+ T cells after long-time infection. In contrast, Egr1 KO mice were similar to WT mice in their responses. Thus, EGR2 is critical for normal differentiation of naïve T cells and for regulating antigen-specific immune responses to influenza viral infection.
Results
Generating Egr2 CKO Mice.
To investigate the roles of Egr1 and Egr2 in T-cell development and function, we obtained Egr1 KO mice (12) and generated mice in which the entire Egr2 coding region was floxed (Fig. S1A). We used transgenic mice expressing CD4-Cre, which deletes the floxed loci at the double-positive (DP) stage in the thymus, thus deleting the Egr2 coding region in both CD4+ and CD8+ T cells, as we confirmed by PCR (Fig. S1B) and Southern blotting (Fig. S1C). Egr2 mRNA expression was essentially absent in splenic T cells stimulated with phorbol 12-myristate 13-acetate (PMA) + ionomycin, whereas neither Egr1 or Egr3 expression was significantly altered (Fig. S1D); EGR2 protein expression was absent in TCR-stimulated Egr2 CKO T cells and at an intermediate level in Egr2+/fCD4-Cre+/− cells (Fig. S1E).
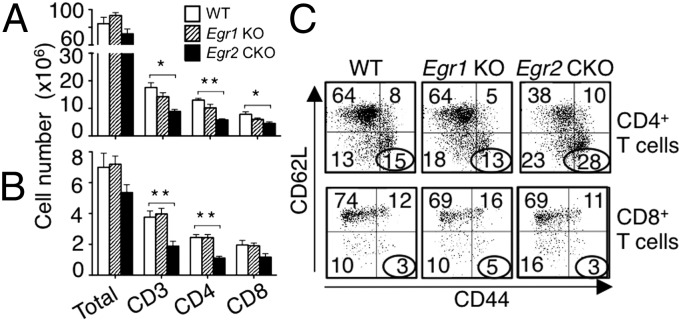
Analysis of thymocyte subsets revealed modest increases in the percentage of DP cells and decreases in single-positive (SP) cells in Egr1 KO and Egr2 CKO mice (Fig. S2A). We found increased total thymocytes, double-negative (DN), and DP cells in Egr1 KO mice, but no significant changes in Egr2 CKO mice (Fig. S2B). In spleen (Fig. 1A and Fig. S2C) and lymph nodes (Fig. 1B and Fig. S2D), deletion of Egr1 had little effect on peripheral T cells, but Egr2 CKO mice had fewer CD3+, CD4+, and CD8+ T cells. Although Egr2 CKO had a slight increase in the percentage of regulatory T (Treg) cells (Fig. S2E), the total number of Treg cells was similar to that in WT mice (Fig. S2F). B cells, natural killer (NK) cells, Gr-1+Mac-1+ granulocytes, Mac-1+ monocytes, and Ter119+ erythroid cell numbers were similar in WT, Egr1 KO, and Egr2 CKO mice (Fig. S2G). There were more CD44hi/CD62Llo CD4+ T cells in Egr2 CKO than in WT and Egr1 KO spleens (Fig. 1C, Upper), consistent with previous reports (9, 13), indicating an increase in effector CD4+ T cells; in contrast, we did not observe an increase in CD44hi/CD62Llo CD8+ T cells in Egr2 CKO mice (Lower).
Fig. 1.
Decreased T cells in Egr2 CKO mice. (A and B) Spleen (A) and lymph node (B) cells were stained as indicated and analyzed by flow cytometry. Shown are cell numbers from 12 mice per group. (C) CD44 and CD62L expression on splenic CD4+ T cells (Upper) and CD8+ T cells (Lower). Data are from one representative of three experiments with 4 mice per group in each (C) and from three experiments (mean ± SD) (A and B).
Defective T-Cell Proliferation and Differentiation in Egr2 CKO Mice.
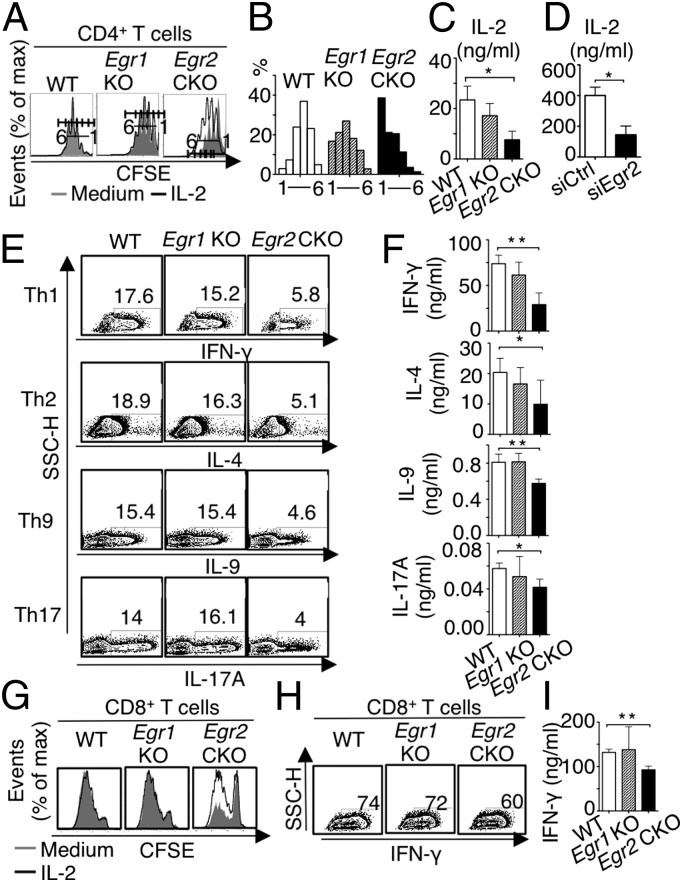
Because Egr1 and Egr2 expression is induced after TCR stimulation (9, 14), we tested the role of EGR1 and EGR2 in T-cell proliferation. After 3-d anti-CD3 + anti-CD28 stimulation, compared with WT naïve cells, Egr1 KO CD4+ T cells had slightly delayed cell division and Egr2 CKO CD4+ T-cell division was more delayed (Fig. 2 A and B). Exogenous IL-2 (100 IU/mL) added during a 3-d TCR stimulation increased proliferation of Egr2 CKO CD4+ T cells, but not up to the WT level (Fig. 2A). Corresponding to this greater responsiveness to IL-2, TCR-stimulated Egr2 CKO T cells produced less IL-2 than did WT cells; Egr1 KO T cells had only a slight decrease in IL-2 production that was not statistically significant (Fig. 2C). The lower IL-2 production was not anticipated, given reports that EGR2 is needed for anergy (8), but WT CD4+ T cells had a marked decrease in IL-2 production after the introduction of Egr2 siRNA, confirming that EGR2 is required for normal TCR-induced IL-2 production (Fig. 2D). Interestingly, when Egr2 CKO CD4+ T cells were subjected to Th1, Th2, Th9, and Th17 differentiation, the percentage of cells expressing IFN-γ, IL-4, IL-9, and IL-17A, respectively, was lower than in WT cells (Fig. 2E) and ELISA (Fig. 2F). In contrast, these cytokines were not significantly decreased in Egr1 KO CD4+ T cells (Fig. 2 E and F). The diminished IFN-γ in Egr2 CKO CD4+ T cells was rescued by exogenous IL-2 (Fig. S3A). IL-4 expressing Egr2 CKO CD4+ T cells were partially increased by exogenous IL-2, but not up to the level of WT cells (Fig. S3B), but IL-2 did not increase the percentage of IL-9–expressing cells (Fig. S3C). Like Egr2 CKO CD4+ T cells, Egr2 CKO CD8+ T cells also had defective proliferation that was partially rescued by exogenous IL-2 (Fig. 2G), as well as fewer IFN-γ–expressing cells (Fig. 2H) and a modest decrease in IFN-γ production (Fig. 2I) that was rescued by exogenous IL-2 (Fig. S3D). Such abnormalities were not observed with Egr1 KO CD8+ T cells (Fig. 2 G–I).
Fig. 2.
Defective proliferation and differentiation of naïve CD4+ and CD8+ Egr2 CKO T cells. (A) Naïve splenic and lymph node CD4+ T cells were cultured for 3 d with anti-CD3 + anti-CD28 with or without IL-2, and cell divisions were analyzed by carboxyfluorescein succinimidyl ester (CFSE) dilution and flow cytometry. (B) Frequency of CFSE-positive cells at each division. (C) After 3-d stimulation, 1 × 10⁶ cells were washed twice in PBS, restimulated with anti-CD3 + anti-CD28 overnight, supernatant was collected, and IL-2 production determined by ELISA. (D) IL-2 production by ELISA from WT naïve CD4+ T cells stimulated with TCR for 72 h in the presence of Egr2 siRNA or control siRNA. (E) Naïve CD4+ T cells were differentiated under Th1, Th2, Th9, and Th17 conditions, and indicated cytokines were detected by intracellular staining and flow cytometry. (F) After 3-d polarization, 1 × 10⁶ cells were washed twice in PBS, restimulated with anti-CD3 + anti-CD28 overnight, supernatant was collected, and IFN-γ, IL-4, IL-9, and IL-17A were measured by ELISA. (G) Analysis of CD8+ T-cell division. (H and I) Cells were differentiated under Tc conditions and IFN-γ expression was determined by intracellular staining and flow cytometry (H) or by ELISA (I). Data are from one of four similar experiments with three mice per group in A, B, E, G, and H, or combined data from three experiments (mean ± SD) in C, F, and I, or representative of three independent experiments in D. In A and G, the shaded area is medium alone, and the black line corresponds to IL-2 treated cells.
Global Analysis of EGR2-Dependent Genes.
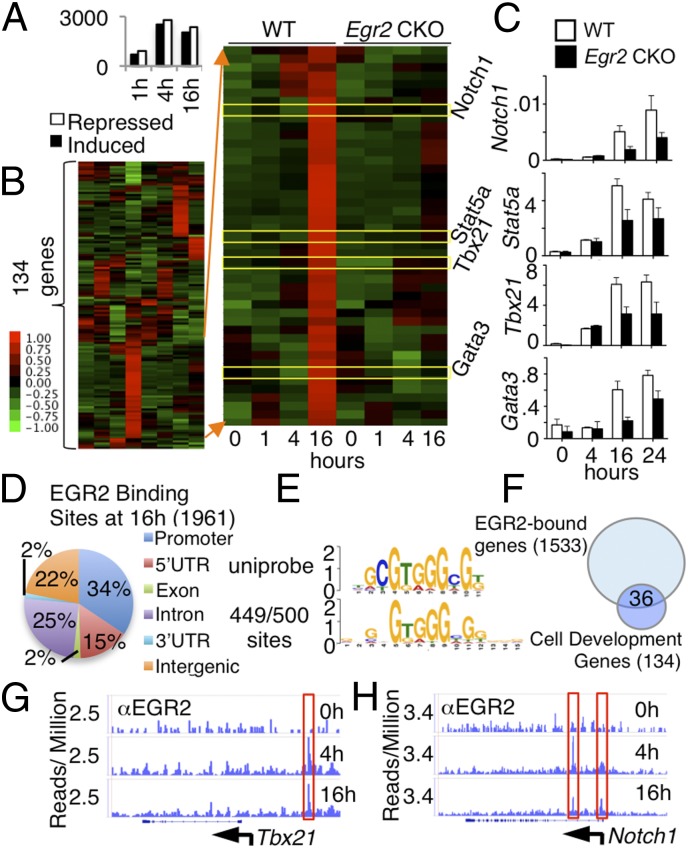
Using RNA-Sequencing (RNA-Seq), we next compared gene expression profiles in WT and Egr2 CKO naïve CD4+ T cells that were not stimulated or stimulated with anti-CD3 + anti-CD28 for 1, 4, or 16 h. We identified 1,596, 5,331, and 4,408 genes that were differentially expressed (fold change > 1.5 and P value < 1 × 10⁻¹⁰) between WT and Egr2 CKO stimulated CD4+ T cells at 1, 4, and 16 h, respectively, with 691, 2,521, and 2,051 induced and 905, 2,810, and 2,357 repressed in Egr2 CKO T cells (Fig. 3A and Dataset S1). Using genes differentially expressed at 16 h, we performed ingenuity pathway analysis (IPA) and identified 134 genes involved in cell development, growth, and differentiation (Fig. 3B and Dataset S2A). We next focused on genes repressed in Egr2 CKO T cells and found that some regulated T-cell proliferation and activation (Fig. 3B). Interestingly, several transcription factors (e.g., Notch1, Stat5a, Tbx21, and Gata3) that promote T-cell activation and differentiation (15–18) had lower expression in Egr2 CKO T cells, as we confirmed by RT-PCR (Fig. 3C). To study whether these genes are direct targets of EGR2, we performed ChIP-Seq and identified 1,961 EGR2 binding sites when comparing anti-CD3 plus anti-CD28 stimulated vs. unstimulated WT T cells, after subtracting background IgG control levels, and analyzed EGR2 binding distribution (Fig. 3D). To de novo discover EGR2 consensus binding motifs, we used MEME to analyze the top 500 binding sites (sorted by peak P value) and found that 449 sites contain a consensus EGR2 motif that is defined in the UniPROBE Database (Fig. 3E). Of 134 differentially expressed genes related to cell development, growth, and proliferation (Fig. 3B), EGR2 bound to 36 (Fig. 3F and Dataset S2B), including Tbx21 (Fig. 3G) and Notch1 (Fig. 3H), which had decreased expression in Egr2 CKO T cells (Fig. 3 B and C), indicating that Tbx21 and Notch1 are direct EGR2 target genes. Thus, EGR2 critically regulates genes that mediate T-cell differentiation and activation. Although EGR2 was shown to bind to the Dgka gene under anergic conditions (8), our ChIP-Seq data did not show EGR2 binding at the Dgka gene in CD4+ T cells stimulated with anti-CD3 + anti-CD28.
Fig. 3.
Gene expression in TCR-induced Egr2 CKO T cells was altered. (A–C) RNA-Seq was performed in WT and Egr2 CKO naïve CD4+ T cells not stimulated or stimulated with anti-CD3 + anti-CD28 for 1, 4, and 16 h. (A) Number of genes induced and repressed in Egr2 CKO T cells stimulated as indicated (the genes differentially expressed in Egr2 CKO T cells are listed in Dataset S1). (B) Heat map of RNA-Seq data for 134 genes that are differentially expressed (≥1.5-fold difference) in Egr2 CKO T cells compared with WT T cells (genes are listed in Dataset S2A). (C) RT-PCR analysis of expression of Notch1, Stat5a, Tbx21, and Gata3. (D) Genome-wide distribution of EGR2 binding sites based on ChIP-Seq performed in WT T cells not stimulated or stimulated with anti-CD3 + anti-CD28 for 4 and 16 h. The 5′ UTR, 3′ UTR, introns, exons, and intergenic regions were defined according to RefSeq, and promoter regions were defined as regions extending 15 kb 5′ of the transcription start site. Peaks up to 5 kb 3′ of the transcription stop site were considered as binding within the gene body. (E) Consensus motif for EGR2. We used TOMTOM to compare the derived motif with the UniPROBE Database. (F) The 36 genes related to cell development, growth, and proliferation that exhibited EGR2 binding by ChIP-Seq (genes are listed in Dataset S2B). (G and H) ChIP-Seq analysis of the binding of EGR2 at the Tbx21 (G) and Notch1 (H) loci. Data are representative of two independent experiments.
Critical Role for EGR2 in Host Defense to Influenza.
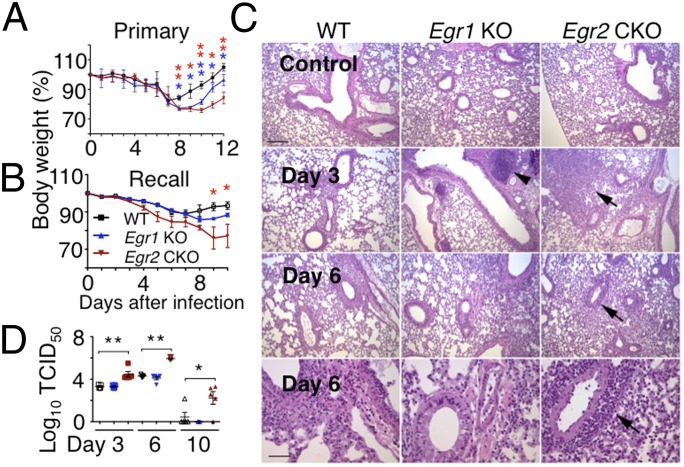
Previously, it was reported that EGR2 was not required for normal host responses to lymphocytic choriomeningitis virus (LCMV) or Toxoplasma gondii infection (13). To further investigate the role of EGR2 in vivo, we used influenza A viruses, which cause acute respiratory infections in humans and mice. Primary infection of WT mice with influenza strain PR8 results in transient weight loss without overt pathological signs, whereas priming with a serologically distinct strain, X-79, and then infecting mice with PR8 (recall response) results in less severe weight loss than in primary infection, with more rapid recovery to preinfection body weight. Egr2 CKO mice had progressive weight loss after either primary or recall infection (Fig. 4 A and B) and had ruffled fur and a hunched posture. Histological examination of lungs from infected Egr2 CKO mice revealed tissue destruction and lymphocytic infiltration (Fig. 4C), with markedly increased pathology scores (Fig. S4A). The pathology and body weight changes in Egr1 KO mice were fewer than in Egr2 CKO mice (Fig. 4 A–C and Fig. S4A). Correspondingly, Egr2 CKO mice had higher viral loads in their lungs than did Egr1 KO or WT mice (Fig. 4D). There also was dysregulated cytokine and chemokine expression in Egr2 CKO mice after influenza infection (Fig. S4 B and C) with sustained expression of Il1b, Il6, and Ccl5 (Fig. S4B), correlating with disease severity. There also was lower expression of the Th1/Th17-related cytokine genes Cxcl10 and Il17a (Fig. S4B), consistent with lower Th1/Th17 differentiation in vitro (Fig. 2).
Fig. 4.
Egr2 CKO mice exhibit greater pathology than WT mice after influenza virus infection. (A and B) Body weight in WT, Egr1 KO, or Egr2 CKO mice in primary (A) and recall (B) infection models. (C) Histological examination on days 0, 3, and 6 after primary infection. (Scale bar in Top Left, 200 μm for the Top three rows; scale bar in Lower Left, 50 μm for the higher magnification view in the Bottom row.) Arrowhead, enlarged lymph node; arrows, perivascular lymphocyte infiltration. (D) Viral titers (50% tissue culture infectious dose, TCID50) from lungs on days 3, 6, and 10 after primary influenza infection. Data are representative of three experiments each with five mice per group (mean ± SD) in A and B, from representative experiments in C, or from one of three similar experiments (mean ± SD) in D.
Above, we observed increased lymphocytic infiltration of the lung in the Egr2 CKO mice infected with influenza (Fig. 4C). Correspondingly, the number of cells in lung parenchyma was increased (Fig. S5A), and the frequency (Fig. S5 B and C) and absolute number (Fig. S5C) of TCRβ+, CD4+, and CD8+ T cells in the lungs were higher in Egr2 CKO mice than in Egr1 KO or WT mice during primary infection (Fig. S5 B and C). These populations were also somewhat increased during recall responses (Fig. S5D, Upper) and sustained at high levels until day 14 postsecondary infection (Fig. S5D, Lower), whereas WT and Egr1 KO mice had similar levels at days 8 and 14 (Fig. S5D). At the peak of T-cell responses to primary (PR8, day 10) and recall (X-79 then PR8, day 8) infection, the total splenocyte and CD4+ and CD8+ splenic T-cell numbers were similar in Egr1 KO and WT mice, but decreased in Egr2 CKO mice (Fig. S5E), in contrast to the increased cellularity observed in their lungs. These observations indicate a key role for Egr2 in the normal immune response to influenza.
Defective CD4+ T-cell Response with Lower Cytokine Expression in Egr2 CKO Mice After Influenza Infection.
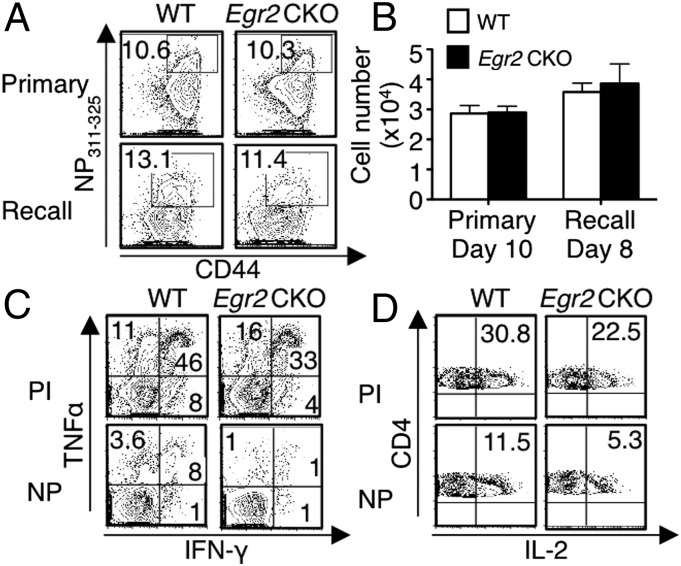
As shown above, infection with influenza virus induces T-cell proliferation (Fig. S5). However, after both primary and recall infection, similar numbers of CD4+ T cells specific for the immunodominant viral nucleoprotein epitope (I-AbNP311–325, termed NP311–325) were present in the lung (Fig. 5 A and B) and mediastinal lymph nodes (MLNs) (Fig. S6A) at the peak response time in Egr2 CKO mice and WT mice. To assess the function of the antigen-specific CD4+ T cells, we stimulated lung cells with NP311–325 peptide or PMA + ionomycin. In both primary and recall infection models, we found slightly decreased frequencies of TNFα+, IFN-γ+, and IL-2+ Egr2 CKO CD4+ T cells after stimulation with PMA + ionomycin (Fig. 5 C, Upper and D, Upper). However, significantly fewer TNFα+IFN-γ+CD4+ T cells (Fig. 5C, Lower and Fig. S6B) and IL-2+CD4+ T cells (Fig. 5D, Lower and Fig. S6B) were seen in the Egr2 CKO than in WT mice after NP311–325 stimulation, and fewer IFN-γ, TNF, and IL-2–expressing CD4+ T cells were observed in the Egr2 CKO MLNs (Fig. S6C). We also identified T follicular helper (TFH) cells from MLNs on day 10 after primary infection, based on PD-1 and CXCR5 surface markers and intracellular BCL6 expression. The frequency (Fig. S6D) and number (Fig. S6E) of PD-1+CXCR5+ cells were similar in WT and Egr2 CKO mice as was the expression of BCL6 (Fig. S6 F and G) and the number of antigen-specific TFH cells (Fig. S6H).
Fig. 5.
IFN-γ, TNFα, and IL-2 production is lower in Egr2 CKO CD4+ than in WT CD4+ T cells after influenza infection. (A and B) Lung cells were isolated and stained with NP311–325 tetramer. Frequency (A) and absolute NP311–325+CD4+ T-cell numbers (B) at the primary and recall infection peak time points. (C and D) Lung cells were stimulated with PMA + ionomycin (PI) or influenza NP peptide for 5 h, with Golgi-stop added during the last 3 h. Flow cytometric profiles for IFN-γ and TNFα (C), and IL-2 (D) expression at the peak response for primary infection. Data are from one of three experiments in A, C, and D or from three experiments each with five mice per group (mean ± SD) in B.
Fewer Lung-Resident Memory CD8+ T Cells in Egr2 CKO Mice After Influenza Infection.
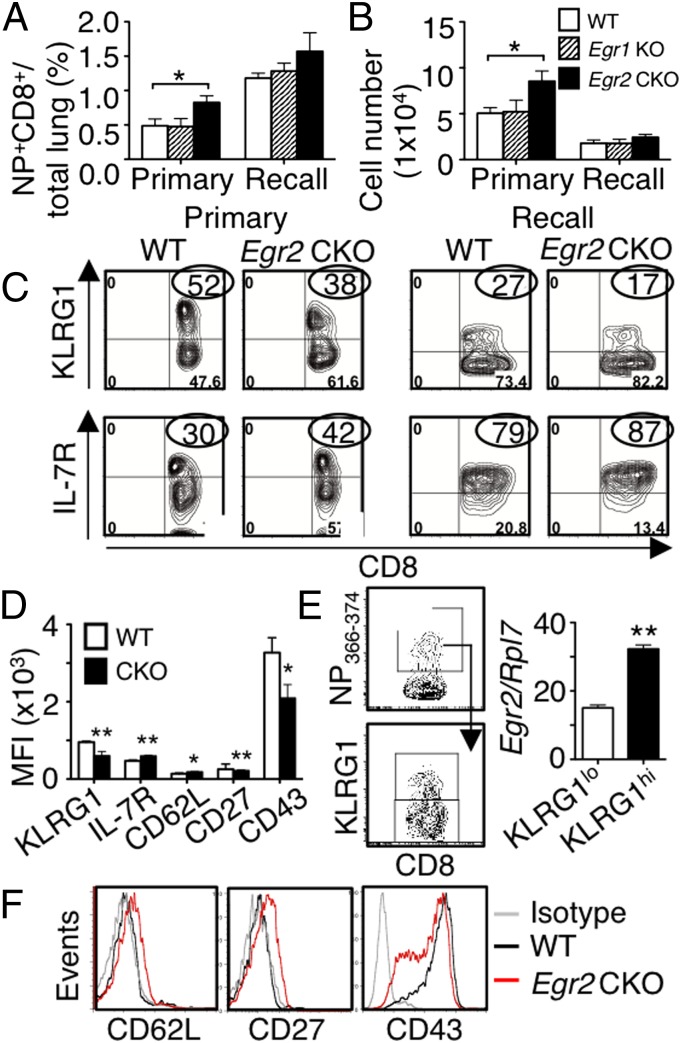
After primary infection, although similar numbers of antigen-specific CD8+ T cells were found in the MLNs from Egr2 CKO and WT mice (Fig. S6A), more CD8+ T cells specific for the DbNP366–374 (termed NP366–374) were present in the lung at the peak response time in Egr2 CKO mice (Fig. 6 A and B), and the frequency and number of NP366–374+CD8+ T cells in the Egr2 CKO were also slightly increased in the recall response (Fig. 6 A and B). However, the Egr1 KO antigen-specific CD8+ T cells were similar to WT cells (Fig. 6 A and B). During infection, KLRG1hiIL-7RloCD8+ T effector cells lack memory potential, whereas KLRG1loIL-7Rhi cells are precursors for long-lived memory T cells (19). At the peaks of both primary and recall responses, in Egr2 CKO mice, NP366–374+CD8+ T cells in the lung had lower KLRG1 but higher IL-7R expression (Fig. 6 C and D) and the WT KLRG1hiNP366–374+CD8+ T cells expressed more Egr2 than the WT KLRG1loNP366–374+CD8+ T cells (Fig. 6E), consistent with the reported higher expression of EGR2 on CD44hi T cells (9). Moreover, virus-specific Egr2 CKO CD8+ T cells had increased CD62L and CD27 but decreased CD43 expression (Fig. 6 D and F), a phenotype consistent with impaired effector differentiation, suggesting that EGR2 is needed for normal effector cell development.
Fig. 6.
A higher percentage of antigen-specific CD8+ T cells have a memory phenotype in Egr2 CKO mice than in WT mice after influenza infection. (A and B) Lung cells were stained with NP366–374 pentamer. Frequency (A) and absolute NP+CD8+ cell numbers (B) at peak primary and recall infection time points. (C) Flow cytometric profile of KLRG1hi and IL-7Rhi antigen-specific CD8+ T cells in primary (Left) or recall (Right) infection models. (D) Mean fluorescent intensity (MFI) of KLRG1, IL-7R, CD62L, CD27, and CD43 from antigen-specific CD8+ T cells after primary infection. (E) Antigen-specific KLRG1lo and KLRG1hi CD8+ T cells were sorted and Egr2 RNA expression on the two populations. (F) FACS profile of CD62L, CD27, and CD43 expression in antigen-specific CD8+ T cells. Data are for 24 mice per group, combined from four experiments (mean ± SD) in A, B, and D or from representative experiments in C, E, and F.
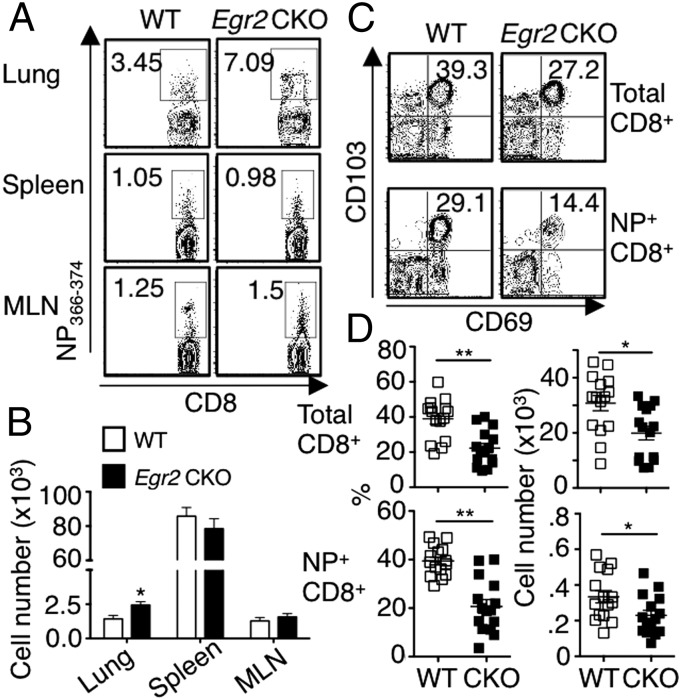
We next measured virus-specific CD8+ T cells 6 wk after primary infection and found that Egr2 CKO mice had more NP336–374+CD8+ T cells in the lung but similar numbers in the spleen and MLN, compared with WT mice (Fig. 7 A and B). However, both the total CD8+ (Fig. 7C, Upper) and the antigen-specific CD8+ T cells (Fig. 7C, Lower) in Egr2 CKO mice had a lower frequency and absolute number of cells expressing CD103 and CD69 (Fig. 7D), indicating fewer lung-resident memory T cells and suggesting a possible role for EGR2 in their development or accumulation.
Fig. 7.
Fewer CD103+CD69+ lung-resident memory CD8+ T cells in lungs of Egr2 CKO than in WT mice, 6 wk after influenza infection. (A and B) Cells from lung, spleen, and MLN were isolated and stained with NP366–374 pentamer. Frequency (A) and absolute NP+CD8+ cell numbers (B) after 6-wk infection. (C) Expression of CD103 and CD69 on both total CD8+ (Upper) and antigen-specific CD8+ (Lower) T cells. (D) Frequency (Left) and absolute numbers (Right) of CD103+CD69+ T cells. Data are from one representative of three experiments in A and C or from three experiments each with five mice per group (mean ± SD) in B and D.
Decreased IFN-γ and TNFα Production and CD8+ Effector Function in Egr2 CKO Mice After Influenza Infection.
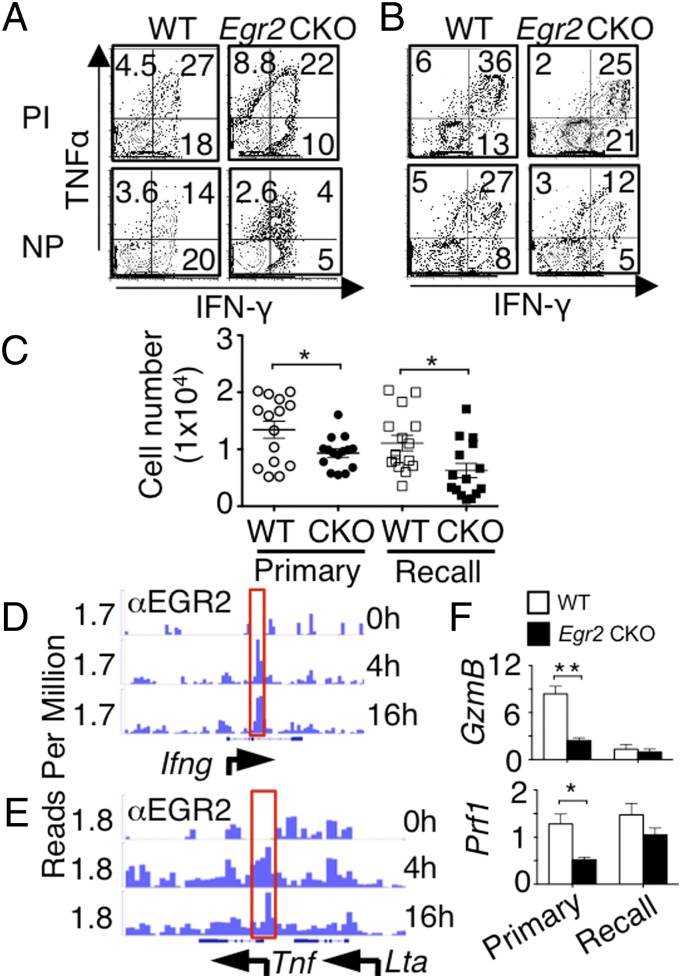
Analogous to the impaired IFN-γ and TNFα production by CD4+ T cells, in both primary and recall infection models, significantly fewer IFN-γ and TNFα expressing CD8+ T cells in Egr2 CKO than in WT lungs (Fig. 8 A–C) and MLNs (Fig. S7A) in response to NP peptide stimulation. Based on the ChIP-Seq data, EGR2 bound the Ifng and Tnf loci (Fig. 8 D and E), indicating they are direct EGR2 target genes. Moreover, Ifng and Tnf expression tended to be slightly albeit not significantly lower in Egr2 CKO than in WT cells after influenza infection (Fig. S7B, Left), whereas both Ifng and Tnf mRNA were much less potently induced in response to PMA + ionomycin in the Egr2 CKO cells in vitro (Fig. S7B, Right). The genes encoding granzyme (Gzmb) and perforin (Prf1) each had significantly lower expression in Egr2 CKO cells in the primary infection model and modestly decreased expression with recall infection (Fig. 8F), although based on ChIP-Seq, neither Gzmb nor Prf1 is a direct EGR2 target gene. To identify whether the defect of the Egr2 CKO CD8+ T-cell response to influenza is intrinsic to CD8+ T cells or not, we used the mouse LCMV CD8+ TCR transgenic P14 system (cells specific for LCMV Db-restricted epitope GP33-41). We cotransferred both WT (Thy1.1+Thy1.2+) and Egr2 CKO (Thy1.1−Thy1.2+) P14 cells into CD45.1 congenic B6 mice and infected them one day later with the PR8-33 virus in which the NA gene of PR8 has the LCMV gp33-41 epitope and found a similar CD8 phenotype (Fig. S8) to that seen in the Egr2 CKO mice. Thus, Egr2 CKO CD8+ T cells responded to influenza challenge, but the antigen-specific cells that accumulated in the lung have an increased memory precursor phenotype and decreased expression of Ifng, Tnf, Gzmb, and Prf1, underscoring an essential intrinsic role for EGR2 in the normal CD8+ T-cell immune response to influenza infection.
Fig. 8.
IFN-γ and TNFα production and CD8 effector function are lower in Egr2 CKO than in WT mice after influenza infection. (A–C) Lung cells were stimulated with PMA + ionomycin (PI) or influenza NP peptide for 5 h, with Golgi-stop added during the last 3 h. Representative flow cytometric profiles for TNFα and IFN-γ expression at the peak response for primary (A) and recall (B) infection models. (C) Absolute number of TNFα+IFN-γ+CD8+ T cells with NP peptide stimulation. (D and E) ChIP-Seq analysis of the EGR2 binding at the Ifng (D) and Tnf (E) loci. (F) mRNA expression (RT-PCR) of Gzmb and Prf1 in CD8+ T cells purified after primary or recall infection models. Data are from one representative of three experiments in A and B, from three experiments with 15 mice combined (mean ± SD) in C, representative of two independent experiments in D and E or from three experiments each with five mice per group (F).
Discussion
Using CD4-Cre Egr2 CKO mice, we have shown that EGR2 is required for normal T-cell proliferation and differentiation under both normal and pathological conditions. Egr2 deficiency resulted in delayed TCR-induced proliferation of naïve CD4+ and CD8+ T cells, at least in part due to defective IL-2 production, and EGR2 was also required for normal Th1, Th2, Th9, Th17, and Tc cell differentiation and cytokine production. After influenza virus infection, Egr2 CKO mice exhibited prolonged viral shedding, increased weight loss, impaired CD4+ T-cell response with decreased IFN-γ and TNFα, increased infiltration into the lung of memory precursor type CD8+ T cells with decreased expression of granzyme B and perforin as well as diminished IFN-γ and TNFα. In contrast, Egr1 KO T cells had only slightly defective proliferation and differentiation, with slightly decreased production of IFN-γ and IL-4, with similar survival and immune responses in influenza-infected Egr1 KO mice and WT mice.
Analysis of Egr2 CKO mice revealed significantly decreased CD4+ and CD8+ T cells in both lymph node and spleen, consistent with a role for EGR2 in development. Interestingly, in this regard, EGR2 was reported to regulate BCL2 expression during positive selection (20). Consistent with a positive role of EGR2 in naïve T-cell proliferation and differentiation, there was decreased expression of a number of genes, 36 of which bound EGR2, including Tbx21 and Notch1. We also identified a number of transcription factors that promote T-cell activation and differentiation and have diminished expression in Egr2 CKO T cells, but which appear to be indirectly regulated by EGR2. The reasons for the unexpectedly lower production of TCR-induced IFN-γ and IL-17A in our Egr2 CKO CD4+ T cells, which contrasts to the increased expression in CD2-Egr2 CKO or CD2-Egr2Egr3 DKO mice (9, 11) are unclear but could reflect different microenvironments in T-cell development in vivo due to Egr2 gene knockout at different stages (DN for CD2-Cre versus DP for CD4-Cre).
A previous study reported that Egr2 CKO mice can mount normal in vivo T-cell responses to infection with T. gondii or LCMV (13). Here, we now show that EGR2 is required for a normal immune response to influenza infection, with greater weight loss and more severe pathological changes, as well as sustained viral shedding in the lung until day 10 in Egr2 CKO mice. Consistent with this robust viral shedding, Egr2 deficiency led to a significant increase in the frequency and total number of CD4+ and CD8+ T cells in the lungs, and this was sustained for greater than 2 wk after the resolution of infection. Decreased CD4+ and CD8+ T cells in spleens of Egr2 CKO mice at the peaks of primary and recall infection suggests either altered trafficking to the infection site or dysregulated T-cell production in the spleen. The increased antigen-specific CD8+ T cells in the lungs confirmed that EGR2 affects T-cell accumulation, and the infiltration of impaired CD4+ T cells with diminished cytokines and memory precursor phenotype CD8+ T cells with impaired function and dysregulated cytokine may explain the delayed viral clearance and prolonged CD8+ T-cell infiltration in Egr2 CKO mice. Previous studies have shown important functions for Notch1 and Tbx21-dependent pathways in influenza infection for normal antigen-specific CD8+ T-cell immune responses (21, 22) and cytokine/chemokine expression (23). The regulation of Notch1 and Tbx21 by EGR2 thus helps to explain the importance of EGR2 for a normal immune response to influenza.
Overall, our data demonstrate that EGR2 promotes naïve T-cell proliferation and differentiation both in vitro in response to TCR stimulation and in vivo after influenza virus infection. In addition to previously reported negative regulatory roles for EGR2, our data reveal that EGR2 can also exert positive regulatory effects, indicating that EGR2 may represent a new target for the control of influenza virus.
Materials and Methods
Mice.
Th Polarization.
Th1, Th2, Th9, Th17, and Tc cell differentiation were performed as previously reported (24). See SI Materials and Methods.
RNA-Seq and ChIP-Seq.
RNA-Seq and ChIP-Seq were performed as previously reported (18, 24). See SI Materials and Methods.
Viral Infection.
Cell Transfers.
The same number of WT and CKO P14 cells (2.5× 10⁴ each) was transferred into Thy1.1+ (B6. PL-Thy1a/CyJ) mice by i.p. One day later, mice were infected with 103 50% egg infectious dose (EID50) of PR8-33.
Flow Cytometry.
Surface and intracellular staining were performed per the standard protocol. See SI Materials and Methods.
Statistical Analysis.
One-way analysis of variance or two-tailed paired t tests were performed using Prism 4.0 (GraphPad software). Statistical significance is indicated by *P < 0.05, **P < 0.01. Shown is mean ± SD.
Supplementary Material
Acknowledgments
We thank J.-X. Lin and R. Spolski (NHLBI) for critical comments, S. Epstein (Food and Drug Administration) for PR8 and X-79 strains of influenza virus, J. Zhu and Y. Wakabayashi (NHLBI DNA Sequencing Core) for excellent services, and NHLBI Flow Cytometry Core Facility for cell sorting and sample analysis. This work was supported by the Division of Intramural Research, National Heart, Lung, and Blood Institute (NHLBI), National Institutes of Health.
Footnotes
The authors declare no conflict of interest.
This article is a PNAS Direct Submission. A.I. is a guest editor invited by the Editorial Board.
Data deposition: The data reported in this paper have been deposited in the Gene Expression Omnibus (GEO) database, www.ncbi.nlm.nih.gov/geo (accession no. GSE49366).
This article contains supporting information online at www.pnas.org/lookup/suppl/doi:10.1073/pnas.1417215111/-/DCSupplemental.
References
- 1.Dias S, Xu W, McGregor S, Kee B. Transcriptional regulation of lymphocyte development. Curr Opin Genet Dev. 2008;18(5):441–448. doi: 10.1016/j.gde.2008.07.015. [DOI] [PMC free article] [PubMed] [Google Scholar]
- 2.Carleton M, et al. Early growth response transcription factors are required for development of CD4(-)CD8(-) thymocytes to the CD4(+)CD8(+) stage. J Immunol. 2002;168(4):1649–1658. doi: 10.4049/jimmunol.168.4.1649. [DOI] [PubMed] [Google Scholar]
- 3.Bettini M, Xi H, Milbrandt J, Kersh GJ. Thymocyte development in early growth response gene 1-deficient mice. J Immunol. 2002;169(4):1713–1720. doi: 10.4049/jimmunol.169.4.1713. [DOI] [PubMed] [Google Scholar]
- 4.Topilko P, et al. Krox-20 controls myelination in the peripheral nervous system. Nature. 1994;371(6500):796–799. doi: 10.1038/371796a0. [DOI] [PubMed] [Google Scholar]
- 5.Li S, et al. Early growth response gene-2 (Egr-2) regulates the development of B and T cells. PLoS One. 2011;6(4):e18498. doi: 10.1371/journal.pone.0018498. [DOI] [PMC free article] [PubMed] [Google Scholar]
- 6.Rengarajan J, et al. Sequential involvement of NFAT and Egr transcription factors in FasL regulation. Immunity. 2000;12(3):293–300. doi: 10.1016/s1074-7613(00)80182-x. [DOI] [PubMed] [Google Scholar]
- 7.Safford M, et al. Egr-2 and Egr-3 are negative regulators of T cell activation. Nat Immunol. 2005;6(5):472–480. doi: 10.1038/ni1193. [DOI] [PubMed] [Google Scholar]
- 8.Zheng Y, Zha Y, Driessens G, Locke F, Gajewski TF. Transcriptional regulator early growth response gene 2 (Egr2) is required for T cell anergy in vitro and in vivo. J Exp Med. 2012;209(12):2157–2163. doi: 10.1084/jem.20120342. [DOI] [PMC free article] [PubMed] [Google Scholar]
- 9.Zhu B, et al. Early growth response gene 2 (Egr-2) controls the self-tolerance of T cells and prevents the development of lupuslike autoimmune disease. J Exp Med. 2008;205(10):2295–2307. doi: 10.1084/jem.20080187. [DOI] [PMC free article] [PubMed] [Google Scholar]
- 10.Miao T, et al. Early growth response gene-2 controls IL-17 expression and Th17 differentiation by negatively regulating Batf. J Immunol. 2013;190(1):58–65. doi: 10.4049/jimmunol.1200868. [DOI] [PubMed] [Google Scholar]
- 11.Li S, et al. The transcription factors Egr2 and Egr3 are essential for the control of inflammation and antigen-induced proliferation of B and T cells. Immunity. 2012;37(4):685–696. doi: 10.1016/j.immuni.2012.08.001. [DOI] [PMC free article] [PubMed] [Google Scholar]
- 12.Lee SL, Tourtellotte LC, Wesselschmidt RL, Milbrandt J. Growth and differentiation proceeds normally in cells deficient in the immediate early gene NGFI-A. J Biol Chem. 1995;270(17):9971–9977. doi: 10.1074/jbc.270.17.9971. [DOI] [PubMed] [Google Scholar]
- 13.Ramón HE, et al. EGR-2 is not required for in vivo CD4 T cell mediated immune responses. PLoS ONE. 2010;5(9):e12904. doi: 10.1371/journal.pone.0012904. [DOI] [PMC free article] [PubMed] [Google Scholar]
- 14.Shin HJ, Lee JB, Park SH, Chang J, Lee CW. T-bet expression is regulated by EGR1-mediated signaling in activated T cells. Clin Immunol. 2009;131(3):385–394. doi: 10.1016/j.clim.2009.02.009. [DOI] [PubMed] [Google Scholar]
- 15.Auderset F, Coutaz M, Tacchini-Cottier F. The role of Notch in the differentiation of CD4+ T helper cells. Curr Top Microbiol Immunol. 2012;360:115–134. doi: 10.1007/82_2012_227. [DOI] [PubMed] [Google Scholar]
- 16.Lin JX, Leonard WJ. The role of Stat5a and Stat5b in signaling by IL-2 family cytokines. Oncogene. 2000;19(21):2566–2576. doi: 10.1038/sj.onc.1203523. [DOI] [PubMed] [Google Scholar]
- 17.Yagi R, Zhu J, Paul WE. An updated view on transcription factor GATA3-mediated regulation of Th1 and Th2 cell differentiation. Int Immunol. 2011;23(7):415–420. doi: 10.1093/intimm/dxr029. [DOI] [PMC free article] [PubMed] [Google Scholar]
- 18.Lin JX, et al. Critical role of STAT5 transcription factor tetramerization for cytokine responses and normal immune function. Immunity. 2012;36(4):586–599. doi: 10.1016/j.immuni.2012.02.017. [DOI] [PMC free article] [PubMed] [Google Scholar]
- 19.Joshi NS, et al. Inflammation directs memory precursor and short-lived effector CD8(+) T cell fates via the graded expression of T-bet transcription factor. Immunity. 2007;27(2):281–295. doi: 10.1016/j.immuni.2007.07.010. [DOI] [PMC free article] [PubMed] [Google Scholar]
- 20.Lauritsen JP, et al. Egr2 is required for Bcl-2 induction during positive selection. J Immunol. 2008;181(11):7778–7785. doi: 10.4049/jimmunol.181.11.7778. [DOI] [PMC free article] [PubMed] [Google Scholar]
- 21.Kuijk LM, et al. Notch controls generation and function of human effector CD8+ T cells. Blood. 2013;121(14):2638–2646. doi: 10.1182/blood-2012-07-442962. [DOI] [PubMed] [Google Scholar]
- 22.Ito T, et al. The critical role of Notch ligand Delta-like 1 in the pathogenesis of influenza A virus (H1N1) infection. PLoS Pathog. 2011;7(11):e1002341. doi: 10.1371/journal.ppat.1002341. [DOI] [PMC free article] [PubMed] [Google Scholar]
- 23.Dutta A, et al. Altered T-bet dominance in IFN-γ-decoupled CD4+ T cells with attenuated cytokine storm and preserved memory in influenza. J Immunol. 2013;190(8):4205–4214. doi: 10.4049/jimmunol.1202434. [DOI] [PubMed] [Google Scholar]
- 24.Liao W, Lin JX, Wang L, Li P, Leonard WJ. Modulation of cytokine receptors by IL-2 broadly regulates differentiation into helper T cell lineages. Nat Immunol. 2011;12(6):551–559. doi: 10.1038/ni.2030. [DOI] [PMC free article] [PubMed] [Google Scholar]
Associated Data
This section collects any data citations, data availability statements, or supplementary materials included in this article.


