Abstract
Therapies that target the programmed death-1 (PD-1) receptor have shown unprecedented rates of durable clinical responses in patients with various cancer types.1–5 One mechanism by which cancer tissues limit the host immune response is via upregulation of PD-1 ligand (PD-L1) and its ligation to PD-1 on antigen-specific CD8 T-cells (termed adaptive immune resistance).6,7 Here we show that pre-existing CD8 T-cells distinctly located at the invasive tumour margin are associated with expression of the PD-1/PD-L1 immune inhibitory axis and may predict response to therapy. We analyzed samples from 46 patients with metastatic melanoma obtained before and during anti-PD1 therapy (pembrolizumab) using quantitative immunohistochemistry, quantitative multiplex immunofluorescence, and next generation sequencing for T-cell receptors (TCR). In serially sampled tumours, responding patients showed proliferation of intratumoural CD8+ T-cells that directly correlated with radiographic reduction in tumour size. Pre-treatment samples obtained from responding patients showed higher numbers of CD8, PD1, and PD-L1 expressing cells at the invasive tumour margin and inside tumours, with close proximity between PD-1 and PD-L1, and a more clonal TCR repertoire. Using multivariate analysis, we established a predictive model based on CD8 expression at the invasive margin and validated the model in an independent cohort of 15 patients. Our findings indicate that tumour regression following therapeutic PD-1 blockade requires pre-existing CD8+ T cells that are negatively regulated by PD-1/PD-L1 mediated adaptive immune resistance.
Recently, we reported sustained tumour regression in 38% of patients in a multi-institutional, international, phase 1 expansion study evaluating the safety and clinical activity of pembrolizumab (formerly MK-3475 and lambrolizumab), a humanized monoclonal antibody against PD-1, in patients with advanced melanoma (ClinicalTrials.gov number NCT01295827).3,8 PD-L1, known to be expressed by cells in the tumour microenvironment, engages PD-1 on T cells and subsequently triggers inhibitory signalling downstream of the TCR, blocking effector functions and reducing T-cell killing capacity.6 PD-L1 can be constitutively expressed on the surface of cancer cells through poorly characterized oncogenic signalling pathways,9,10 or alternatively, expressed in response to the presence of T cells producing immune-stimulating cytokines such as interferons.7,11,12 This later process has been termed adaptive immune resistance,6 and represents a mechanism by which cancer cells attempt to protect themselves from immune-cell mediated killing.
We sought to determine whether pre-existing tumour-associated CD8+ T-cells inhibited by PD-1/PD-L1 engagement represent key factors in determining clinical response to PD-1 blocking therapy. Our study cohort consisted of 46 patients with advanced melanoma treated with single agent pembrolizumab between December 2011 and October 2013 at UCLA (IRB# 11-003066). Patients underwent tumour biopsies before and during treatment. Baseline biopsy samples from 15 additional patients with advanced melanoma enrolled in the same pembrolizumab phase I clinical trial at Gustave Roussy in Villejuif-Paris-Sud, France (IRB# 11-040) were analysed as a validation cohort (Extended Data Table 1).
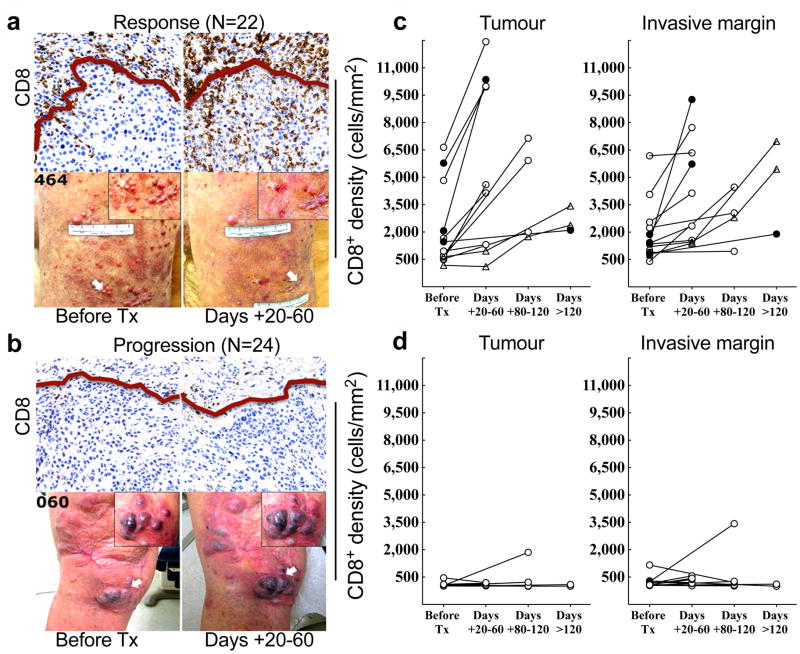
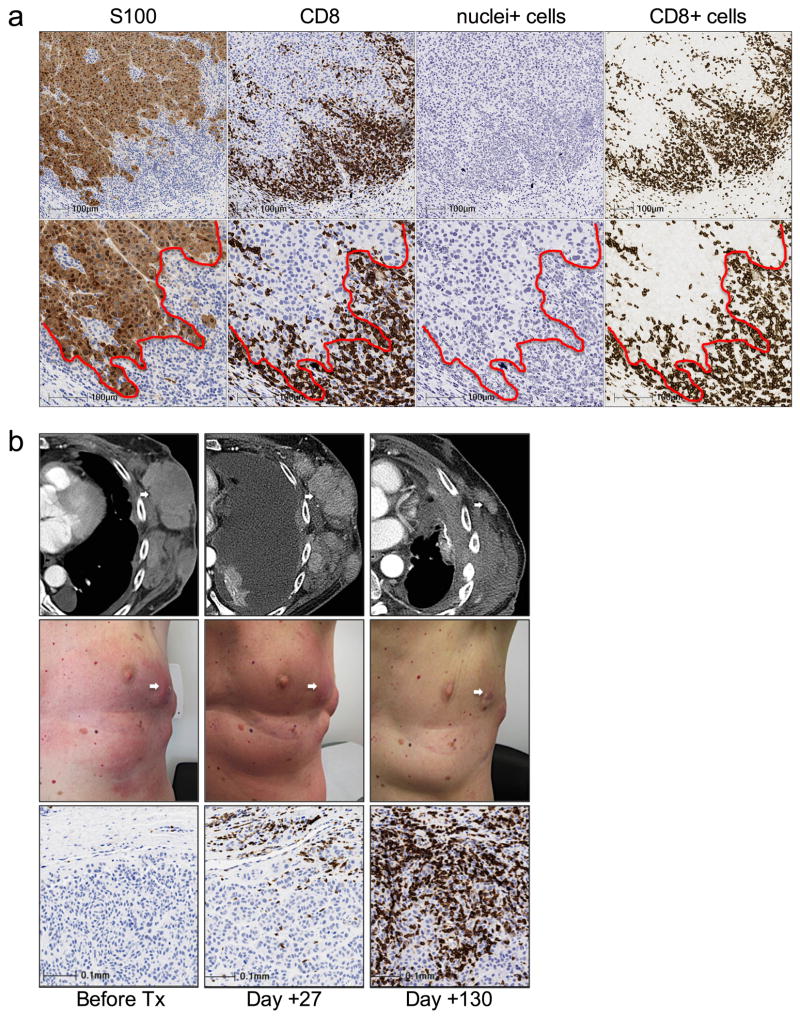
We first examined the spatio-temporal dynamics of CD8+ T-cells by performing qualitative and quantitative IHC analysis for CD8 expression before and during PD-1 blockade in two tumour compartments: the invasive tumour margin (stromal-tumour edge) and inside the tumour parenchyma (tumour center).13,14 S100+ expression was used to define the invasive margin and tumour center (Extended Data Fig. 1a). Pre-treatment samples obtained from patients who experienced a tumour response (Response group, Fig. 1a), showed higher CD8+ cell densities at the invasive margin when compared to samples from patients who progressed during therapy (Progression group, Fig. 1b). Extended Data Table 2 provides the anatomical location of all tumours serially sampled. Serially sampled tumours during treatment exhibited a parallel increase in CD8+ cell density at both the invasive margin and tumour center in the Response group (Spearman’s correlation r = 0.71, p<0.001, Fig. 1c,), but not in the Progression group (Fig. 1d). Two patients experienced delayed responses (Fig. 1c, triangles) and showed step-wise accumulation of CD8+ cells, with initial increases restricted to the invasive margin, followed by mobilization into the tumour parenchyma (Extended Data Fig. 1b).
Figure 1. Immunohistochemical analysis of CD8+ T cells in samples obtained before and during pembrolizumab treatment.
a and b, Examples of CD8 expression in melanoma tumours serially biopsied before PD-1 blocking treatment (Tx) and 20–60 days after treatment began (Days + 20–60) from a patient in the Response (a) and Progression (b) groups. Red line separates tumour parenchyma (below line) and invasive margin (above line). Magnification, X20. c and d, CD8+ cell density at the tumour center and invasive margin in samples from all Responders (c, n = 13) and Progressors (d, n = 12) who received a biopsy before and during treatment.● =complete response, ○ =partial response, △ = delayed response.
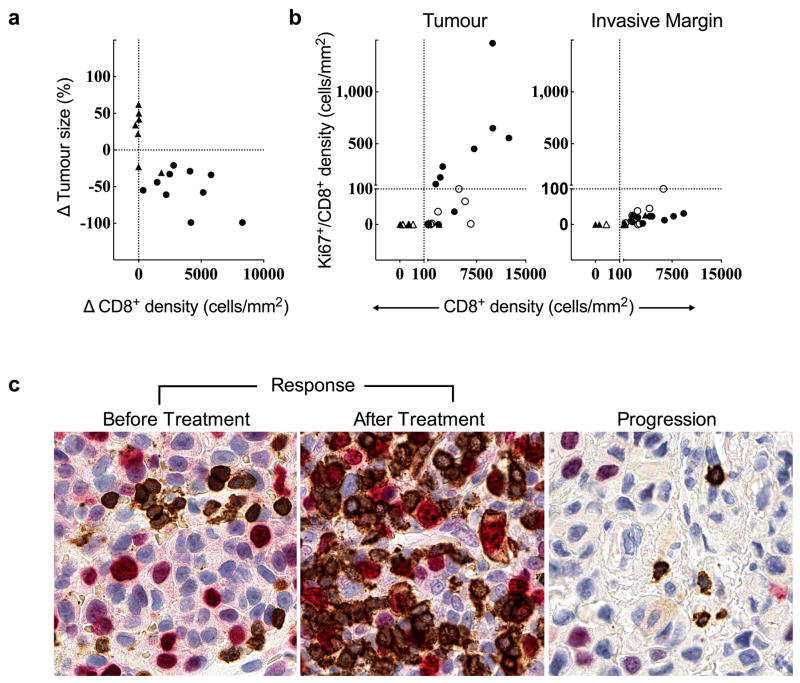
Releasing the PD-1 immune checkpoint in pre-existing tumour antigen-specific T cells at the invasive margin should lead to T cell proliferation, intratumoural infiltration and increased effector function. We found a greater increase in CD8+ density from baseline to post-dosing biopsy that significantly correlated with a decrease in radiographic tumour size (Extended Data Fig. 2a, Spearman’s correlation r = −0.75, p = 0.0002). During treatment, we found an increase in cells that were double positive for CD8 and the nuclear proliferation marker Ki67 in samples from patients with a tumour response, as well as all sub-phases of mitosis based on characteristic chromatin patterns (Fig. 2 and Extended Data Fig. 2b,c). The post-dosing increase in CD8/Ki67 double positive cells was restricted to the tumor parenchyma. We found increased expression of granzyme B, a cytotoxic granule reflective of CD8 effector function, on CD8+ cells in post-dosing biopsies in the Response group (p < 0.0001; Extended Data Fig. 3a,b).
Figure 2. Regressing tumours during treatment are associated with proliferating CD8+ T cells that localize to the tumour.
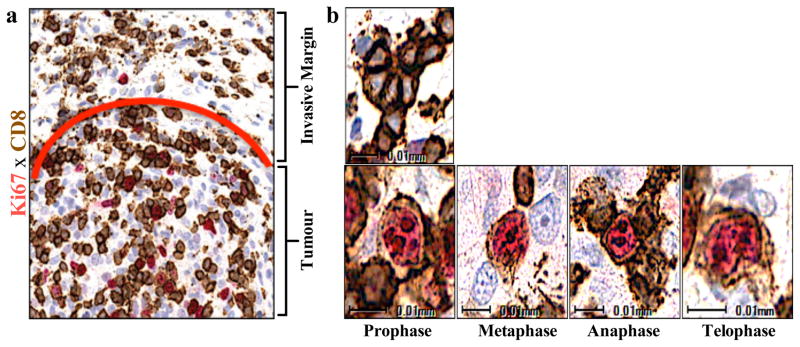
a, Representative example of CD8/Ki67 chromogenic double staining from a sample obtained during tumour regression shows double positive CD8 cells localized to the tumour parenchyma. The red line separates the invasive margin (above line) and tumour (below line). b, Top: Representative single positive quiescent CD8+ brown cells (no Ki-67 labeling) from the invasive margin. Bottom: Representative double positive cells (red labeled Ki67 nucleus, CD8 brown labeled membrane) with characteristic chromatin patterns associated with subphases of mitosis. Magnification, X40.
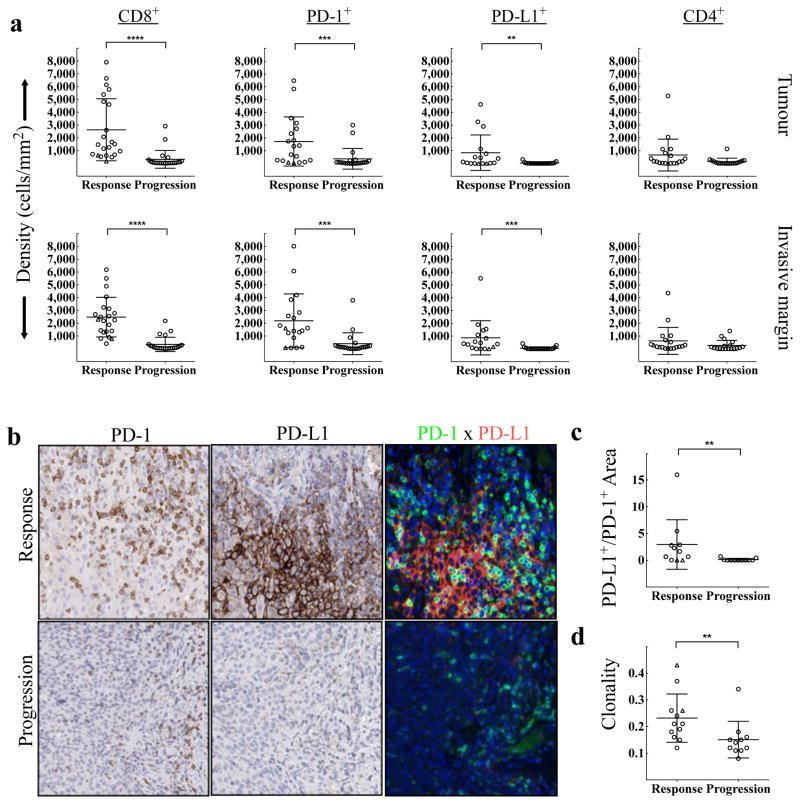
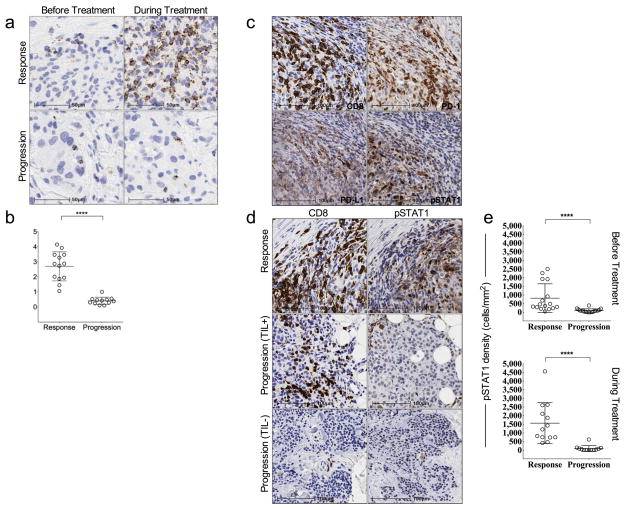
The correlation between T-cell activation/effector function and treatment outcome upon release of the PD-1 immune checkpoint may be driven by the production of interferons by tumour-infiltrating CD8 cells that induce PD-L1 expression on tumour-resident cells.11,15 To test this mechanism, we stained baseline and post-dosing biopsies for phospho-STAT1 (p-STAT1), which is an immediate downstream effector upon interferon-gamma binding to its receptor (Extended Data Fig. 3c,d). The Response group was associated with significantly higher expression of pSTAT1+ at the invasive margin, localized to the area of CD8 infiltrate, before (p=0.002) and during treatment (p < 0.0001), when compared to biopsies from the Progression group. In serially sampled tumours from the Response group, pSTAT1 expression was also found to be significantly higher during treatment when compared to baseline (p = 0.007). These findings prompted us to investigate the association between CD8, CD4, PD-1, and PD-L1 positive cell densities at baseline and treatment outcome (Fig. 3a). The Response group was associated with significantly higher numbers of CD8+, PD-1+, and PD-L1+ cells at both the invasive margin and the tumour center when compared to the Progression group (CD8, p<0.0001; PD-1, p=0.0002; PD-L1, p=0.006). However, CD4 expression at baseline was not found to correlate with treatment outcome. No relationship was found between previous treatment history with ipilimumab (anti-CTLA4) and pre-anti-PD1 treatment CD8, PD-1, and PD-L1 expression with respect to treatment outcome (Extended Data Table 3).
Figure 3. Baseline density, location, and proximity of CD8+, PD-1+, PD-L1+, and CD4+ cells, and T cell repertoire according to treatment outcome.
a, Melanoma samples collected before treatment with PD-1 blocking therapy were assessed for CD8 (Response n=22, Progression n=24), PD-1 (Response n=19, Progression n=21), PD-L1 (Response n=17, Progression n=21), and CD4 (Response n=19, Progression n=18) density by quantitative immunohistochemistry in the tumour compartment and at the invasive margin. **P < 0.01, ***P < 0.001, ****P < 0.0001. b, Examples of the relative proximity of PD-1 and PD-L1 expressing cells in representative baseline samples from a responder and a progressor. c, Proximity analysis of PD-1 and PD-L1 based on multiplex quantitative immunofluorescence in baseline tumour samples (Response n=11, Progression n=11). **P = 0.005. d, Results of TCR sequencing performed on 25 whole tumour samples taken at baseline (Response n=12, Progression n=11). **P = 0.004. △ = Delayed Response.
We next determined the relative proximity of PD-1 and PD-L1 as evidence of a physical interaction between PD-1+ and PD-L1+ cells, a presumptive requisite for adaptive immune resistance. Fig. 3b shows representative examples of chromogenic PD-1 and PD-L1 expression in serial cut tissue sections as well as multiplexed PD-1xPD-L1 immunoflourescence in pre-treatment samples according to treatment outcome. Using quantitative multiplexed PD-1xPD-L1 immunofluorescence, we found a significant correlation between proximity of PD-1 and PD-L1 and response to therapy (Fig. 3c, p=0.005).
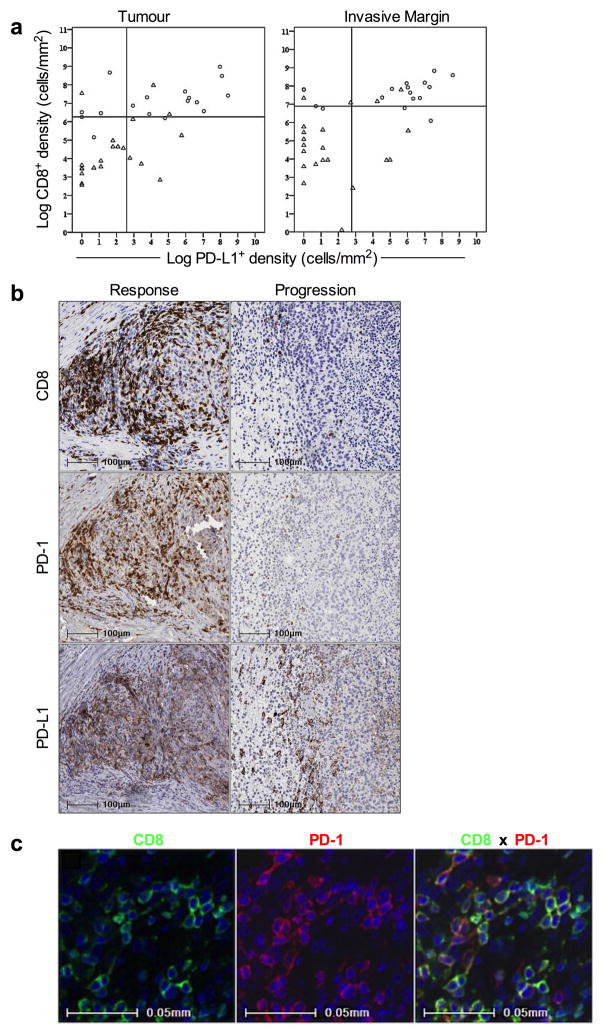
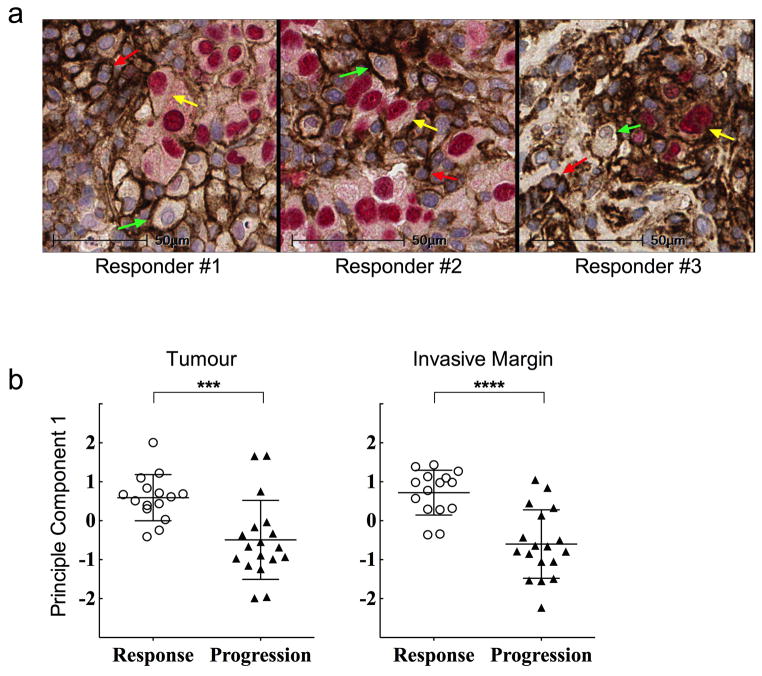
We next investigated the relationship between CD8 and PD-L1 using a Spearman’s correlation analysis and found the two markers to correlate in both the tumour (Spearman r = .598, p<0.001) and the invasive margin (Spearman r = .527, p<0.001). Furthermore, CD8 and PD-L1 density co-varied with treatment outcome in both the tumour and invasive margin (p<0.001 for both, Extended Data Fig. 4a,b). Immunofluorescence multiplexing for CD8 and PD-1 corroborated our chromogenic IHC findings that CD8 T cells represented the primary cellular source of PD-1 expression (Extended Data Fig. 4c). Using chromogenic double staining for SOX-10xPD-L1, we found PD-L1 expression on melanoma cells and also on cells morphologically consistent with lymphocytes and macrophages in samples obtained during treatment from the Response group (Extended Data Fig. 5a). Principal component analysis of samples obtained before treatment showed that CD8, PD-1 and PD-L1 expression in the tumour (p=0.001) and at the invasive margin significantly correlated with treatment outcome (p<0.0001, Extended Data Fig. 5b).
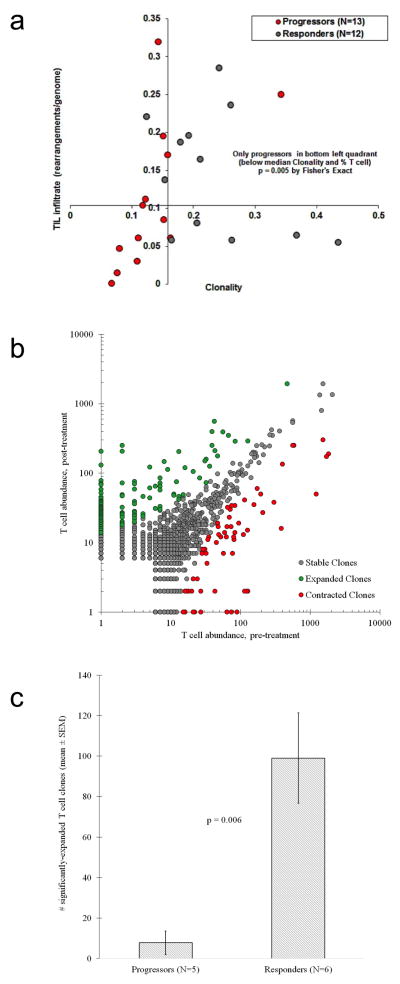
The high density of CD8+ cells at the site of the tumour in the Response group is suggestive of a specific immune response to tumour antigens. Therefore, we hypothesized that a more restricted TCR sequence usage would reflect a tumour antigen-specific T-cell accumulation at the tumour site. Using genomic DNA isolated from pre-treatment samples, we performed next generation sequencing to capture all uniquely rearranged, variable TCR beta chain regions.16,17 We found that a more restricted TCR beta chain usage, reflecting a T-cell population that was less diverse in repertoire and more clonal in nature, significantly correlated with clinical response to pembrolizumab treatment (p=0.004, Fig. 3d). The clonality read-out was not found to highly correlate with tumour-infiltrating lymphocyte (TIL) density (R2 = 0.04, Extended Data Fig. 10). However, biopsies from patients with a tumour response showed evidence of an enriched population of T cells with unique specificities. In addition, comparison of the TCR clonality at baseline and post-dosing biopsies showed that samples from Responders had more than 10 times as many clones expand after anti-PD-1 therapy (Extended Data Fig. 6).
To create the best discriminatory model to assess the probability of clinical response to PD-1 blocking therapies, forward stepwise logistic regression was run on CD8+, CD4+, PD-1+, and PD-L1+ cell densities within the tumour and the invasive margin. Results of the stepwise procedure, and a logistic regression model, consistently selected the invasive margin CD8+ density as the best full predictive parameter (Extended Data Table 4a). The next best predictors were tumour CD8+ T cell density, tumour and invasive margin PD-1+ density, and tumour and invasive margin PD-L1+ density. Tumour and invasive margin CD4+ density were the poorest predictors.
To test this predictive model, we obtained pre-treatment biopsies from 15 patients treated at Gustave Roussy and were blinded to treatment outcome. We quantified CD8+ T cell density in the invasive margin and utilized our logistic model to calculate a predicted probability of response for each patient in the validation cohort (Extended Data Table 4b). Out of the 15 patients, we accurately predicted 4 out of 5 patients in the true progression group and 9 out of 9 patients in the true response group. There was one false positive prediction and one patient predicted to respond who remains in stable disease.
Our studies build upon the evidence that response rates to PD-1 or PD-L1 blocking antibodies are higher in patients whose tumours express PD-L1.1,15 Since PD-L1 can be either constitutively expressed or induced upon T cell recognition and production of interferons,11,15 we hypothesized that response to PD-1 blockade would more tightly co-variate with the inducible PD-L1 expression in the presence of antigen-specific T cells,7 termed adaptive immune resistance.6 Indeed, we found interfacing PD-L1 expressing cells in tumours and PD-1 positive T-cells in pre-treatment samples of responders. The clinical relevance of the relative distribution of PD-L1 expression on cancer cells, myeloid-derived cells and activated T cells in tumours, in terms of treatment outcome, remains to be elucidated. Our data suggests that PD-L1 may serve as an indirect marker of adaptive immune resistance in response to tumour antigen-specific T cell infiltration rather than a static constitutive biomarker. Hence, inducing a type-I interferon inflammatory response in combination with PD-L1 blockade merits further clinical investigation.11
T cell infiltrates have been found to have predictive value with respect to the natural history of primary cancers.13,14,18 We build on this and herein report that the baseline density and location of T cells in metastatic melanomas have predictive value in the treatment outcome of patients receiving therapies that block the PD-1/PD-L1 axis. Releasing the PD-1 immune checkpoint results in clinically relevant antitumour activity when there is a greater density of pre-existing tumour antigen-restricted CD8 T cells that are negatively regulated by PD-1/PD-L1 interactions.
METHODS
Tumour samples
Tumour biopsies were obtained from a subset of patients enrolled in a phase 1a clinical trial that enrolled 411 patients;19 patients were selected for this analysis by having adequate tumour biopsy samples and clinical follow up. All patients in the study and validation cohorts underwent mandatory biopsy of a metastatic tumour within 30 days of starting treatment and one or more optional biopsies at 20–60 days, 60–120 days, or greater than 120 days after starting aPD-1. Samples were immediately fixed in formalin followed by paraffin embedding. Biopsy collection and analyses were approved by UCLA IRBs 11-001918 and 11-003066. Tumour samples obtained from the initial cohort of 46 patients from UCLA were analyzed for immunohistochemical analysis of CD8 (n=46 patients, 45 samples before and 31 samples during treatment), CD4 (n=37 patients, 37 samples before and 0 samples during treatment), PD-1 (41= patients, 39 samples before and 26 samples during treatment), PD-L1 (n=38 patients, 38 samples before and 24 samples during treatment), multiplex immunofluorescence for PD-1 and PD-L1 (n=26 patients, 22 samples before treatment, 25 samples during treatment), multiplex chromogenic staining (n=13 patients, 12 samples before and 17 samples during treatment), and T-cell receptor (VBeta) repertoire (n=23 patients, 23 samples before treatment). The validation cohort included baseline biopsies of 16 patients from Gustave Roussy.
Treatment outcome groups
Patients at both sites received single agent pembrolizumab intravenously in one of three dosing regimens: 2 mg/kg every 3 weeks (2Q3W), 10 mg/kg every 3 weeks (10Q3W), or 10 mg/kg every 2 weeks (10Q2W) within a phase 1 clinical trial that enrolled a total of 411 patients.19 Tumour responses to pembrolizumab were evaluated at 12 and 16 weeks after the first infusion, and every 12 weeks thereafter. Treatment outcomes were statistically identical between the three dosing regimens. The Response Evaluation Criteria in Solid Tumours (RECIST) version 1.1 was used to define objective clinical responses by an independent, central, blinded radiographic review. The protocol allowed to proceed beyond initial progression at the restaging scans at 3 months and have repeated imaging scans 4 weeks later following the immune-related response criteria (irRC).20 Following this protocol-specified criteria, two patients had evidence of increase in size of target lesions at 12 weeks, but met criteria for objective partial response at 36 weeks and were considered within the Response group but denoted as having a delayed response.
Immunohistochemical (IHC) staining
Slides were stained with hematoxylin and eosin, S100, CD8, CD4, CD80, Ki67, pSTAT1, and granzyme B at the UCLA Anatomic Pathology IHC Laboratory. Immunostaining was performed on Leica Bond III autostainers using Leica Bond ancillary reagents and REFINE polymer DAB detection system. Antibodies used included rabbit polyclonal S100 (DAKO, 1/1500 dilution, low pH retrieval), CD8 clone C8/144B (DAKO, 1/100, low pH retrieval), rabbit monoclonal pSTAT1 clone D3B7 (Cell Signaling, 1/300 30min, low pH retrieval). PD1 and PD-L1 single-label chromogenic and multiplexed immunofluorescence triple staining were performed at Merck laboratories. All staining was performed on Dako autostainers. Signal in chromogenically labeled slides was visualized with DAB. Signal in immunofluorescently labeled slides was visualized with Alexafluor 488 and Alexafluor 594 TSA kits (Invitrogen), and nuclei were visualized with Prolong Gold Antifade Reagent with DAPI (Invitrogen). All stained slides were evaluated in a blinded fashion by one dermatopathologist and one investigator trained to identify the features of melanoma. PD-1 and PD-L1 stained slides were independently evaluated by one pathologist at Merck laboratories. Slides were examined for the presence of CD8, CD4, Ki67, PD-1, and PD-L1 within the tumour parenchyma (tumour) and the connective tissue surrounding the tumour (invasive margin).
The anti-PD-L1 antibody clone 22C3 used in the presented IHC studies is a mouse anti-human PD-L1 IgG1κ generated through murine immunization with a fusion protein containing the human extracellular domain of PD-L1 and subsequent hybridoma formation. Binding was screened initially using a cell-based ELISA employing stably transfected CHO cells expressing human PD-L1 as positive control and parental (non-transfected) CHO cells as negative control. Further screening was performed to assess specificity as an IHC reagent for use in FFPE sections through correlation of staining prevalence and intensity on FFPE cell pellets from melanoma cell lines to patterns of expression observed on aliquots of the same cells analyzed for PD-L1 expression by flow cytometry, and for mRNA expression on serial sections of the same blocks using the Nanostring platform (Nanostring, Seattle WA). Appropriateness of signal distribution in FFPE tissue was confirmed by correlation of IHC signal pattern in tissue with PD-L1 in situ hybridization studies performed on serial sections of the same blocks. Attribution of IHC signal to binding of complementarity determining regions of the antibody was confirmed by abrogation of signal on preadsorption of the antibody with immunogen. Antigen stability in cut slides and within paraffin blocks was evaluated through time course studies to determine changes in dynamic range of the assay on pre-sectioned slides as well as on fresh cut slides from existing paraffin blocks over periods of months.
Sections cut from formalin fixed paraffin embedded (FFPE) blocks were deparaffinized and rehydrated with serial passage through changes of xylene and graded ethanols for PD-1 and PD-L1 IHC. All slides were subjected to heat induced epitope retrieval in Envision FLEX Target Retrieval Solution, High pH (cat K8012, Dako, Carpineteria CA). Endogenous peroxidase in tissues was blocked by incubation of slides in 3% hydrogen peroxide solution prior to incubation with primary antibody (anti-PD-L1 clone 22C3, Merck Research Laboratories, Palo Alto CA or anti-PD-1 clone NAT105, Cell Marque, Rocklin CA) for 60 minutes. Antigen-antibody binding was visualized via application of the FLEX+ polymer system (cat K8012, Dako, Carpineteria CA) and application of 3,3′ diaminobenzidine (DAB) chromogen (K4368, Dako). Stained slides were counterstained with hematoxylin and coverslipped for review.
Digital image acquisition and analysis
All slides were scanned at an absolute magnification of 200× (resolution of 0.5 μm/pixel). An algorithm was designed based on pattern recognition that quantified immune cells within S100 positive areas (tumour) and S100 negative areas (invasive margin). Image analysis based on RGB (red, green, blue) spectra was used to detect all cells by counterstaining with hemotoxylin (blue), and DAB or fast red. The algorithm calculated the density (cells/mm2) and % cellularity (% positive cells/all nucleated cells) using Indica Labs Halo platform. For the Proximity Analysis slides fluorescently stained for PD-1 (Alexafluor 488, green channel) and PD-L1 (Alexafluor 594, red channel) were scanned to generate digital images in which the entire tumour region was sampled using 10,000 random disks. Disks containing both green and red signal were scored as positive for PD-1/PD-L1 proximity. The total number of positive disks was summed to yield a proximity score for each sample. CD8+ expression was determined using two read-outs that were independent of each other to account for tumour heterogeneity: cell density (number of positive cells/mm2) and percent cellularity (number of positive cells/number of nucleated cells). Cell density and percent cellularity correlated significantly (R2 = 0.89 in tumour and 0.84 in the invasive margin).
Next Generation Sequencing for T-cell receptor clonality
TCR sequencing and clonality quantification was performed as previously described16,17 from tumour samples preserved using RNAlater (Qiagen) and stored at −80°C. DNA was isolated by mincing followed by extraction utilizing a DNeasy kit (Qiagen). Melanin was then removed from visibly pigmented melanoma samples using a PCR Inhibitor Removal kit (Zymo Research). TCRβ CDR3 regions were amplified and sequenced using the survey ImmunoSeq assay in a multiplexed PCR method using 45 forward primers specific to TCR Vβ gene segments and 13 reverse primers specific to TCR Jβ gene segments (Adaptive Biotechnologies, Seattle, WA). Reads of length 87 bp were obtained using the Illumina HiSeq System. For each sample, Shannon entropy was calculated on the clonal abundance of all productive TCR sequences in the dataset. Shannon entropy was normalized to the range [0–1] by dividing Shannon entropy by the logarithm of the number of unique productive TCR sequences in the dataset. This normalized entropy value was then inverted (1 − normalized entropy) to produce our clonality metric.
PCR template abundance estimation
In order to estimate the average read coverage per input template in our multiplex PCR and sequencing approach, we employed a set of approximately 850 unique types of synthetic TCR analog, comprising each combination of Vβ and Jβ gene segments.17 These molecules were included in each PCR reaction at very low concentration so that most unique types of synthetic template were not observed in the sequencing output. Using the known concentration of the synthetic template pool, we simulated the relationship between the number of observed unique synthetic molecules and the total number of synthetic molecules added to reaction (this is very nearly one-to-one at the low concentrations we employed). These molecules then allowed us to calculate for each PCR reaction the mean number of sequencing reads obtained per molecule of PCR template, and thus to estimate the number of rearranged T cell receptors per diploid genome (i.e., level of TIL infiltration) in the input material.
Statistical analysis
Demographic, clinical, and immunohistochemical variables were compared between responders and progressors using Wilcoxon rank sum tests for ordinal or quantitative variables and Fisher’s exact test for categorical variables. Receiver operating characteristic (ROC) curves for response vs. progression were constructed to assess the proprognostic ability of CD8, PD-1, CD4, and PD-L1 for both tumour and invasive margin measures. The area under the ROC curve (AUC) was used to measure model performance and the Wilcoxon test was used to assess significance of the AUC results. A logistic regression model was constructed using pre-treatment CD 8+ (cells/mm2) versus the outcome of clinical response (PR+SD vs PD) using the study cohort. This fixed model was then applied to the CD 8+ density measurements in the Gustave Roussy validation cohort to compute predicted probabilities of response to treatment. Sensitivity and specificities were calculated. Principal components analysis (PCA) was used to decompose the variance for the markers (CD8+, PD-1+, PD-L1+, and CD4+ cell densities in cells/mm2) separately in the tumour and in the invasive margin. The first principal component accounted for the majority of the variability in the four markers 69.6% and 57.1% in the tumour and invasive margin respectively. Principal component scores for the first principal component were compared between response groups with Wilcoxon rank sum tests. Analyses were performed using GraphPad Prism, SAS, and SPSS. All tests were 2-sided and equal variance was not assumed unless otherwise stated. P-values <0.05 were considered statistically significant.
Extended Data
Extended Data Figure 1. CD8 cell infiltrates in tumor biopsies.
a, Segmentation of the invasive margin and tumour parenchyma using S100 and CD8 chromogenic staining. Low magnification (top row) and high magnification (bottom row) are shown. The red dotted line illustrates S100+ tumour (left of red line) and S100− stroma (right of red line). Coordinates of the invasive margin and tumour parenchyma are generated from the S100 stained image (column labeled S100) and subsequently imported into the CD8 stained image (column labeled CD8). This is followed by a deconvolution imaging algorithm of the CD8 stained image where first, all nuclei (column labeled Nuclei+) are identified and quantified, irrespective of what type of cell. This is followed by identifying CD8+ membrane (column labeled CD8+) for cell quantification and analysis. b, CD8+ T-cell kinetics within the tumour microenvironment in a serially sampled tumour responding to PD-1 blocking therapy. Example of radiographic, clinical, and CD8 IHC in a serially sampled melanoma tumour of the left chest wall that was obtained from a patient with a delayed response. On day +20, clinical and radiographic examinations indicated progressive disease; at a time when CD8 T-cells expression increased in density at the invasive margin.
Extended Data Figure 2. Proliferation of CD8+ T cells in regressing tumours.
a, Relationship of the change in CD8+ cell density and best percent change in tumour size in serially sampled tumours that were assessed using quantitative immunohistochemistry and CT scan measurements (n=18, Spearman r = −0.75, P = 0.0002). b, CD8+ cell density and Ki67+/CD8+ cell density in the Response group before treatment (n=11, empty circles) and during treatment (n=17, filled circles) and the Progression group before treatment (n=9, empty triangles), and during treatment (n=15, filled triangles). c. Representative examples of CD8/Ki67 chromogenic double staining from a biopsy of a patient with a tumor response and another with progression. Double positive CD8 cells (red labeled Ki67 nucleus, CD8 brown labeled membrane) are not present at baseline, but are present during tumor regression in the biopsy from a patient with a tumor response. The double positive cells are not in the biopsy of a patient with progression during treatment (no Ki-67 labeling in brown CD8 cells). Magnification, X40.
Extended Data Figure 3. Granzyme B and pSTAT1 expression before and during treatment in terms of clinical response.
a, Representative examples of granzyme B expression according to clinical response. b, Samples collected during PD-1 blocking therapy were evaluated for granzyme B signal (Response n=13, Progression n=12) using quantitative immunohistochemistry. ****P < 0.0001. c, Representative example of the proximity between CD8+, PD-1+, PD-L1+, and pSTAT1+ cells in the tumour microenvironment in a sample obtained before treatment from the Response group. Magnification, X40. 2 μM serial cut tissue sections were stained for CD8, PD-1, PD-L1, and pSTAT1. d, Localization of CD8+ and pSTAT1+ cells in samples obtained before treatment from a biopsy in a patient with response and two patients with progression on anti-PD-1 therapy (+/− a CD8 presence). The biopsy from a patient with disease progression had a moderate presence of CD8 cells that did not show pSTAT1 expression in the area. e, Using quantitative IHC analysis, the Response group was associated with significantly higher expression of pSTAT1+ at the invasive margin before and during treatment (Response n = 16, Progression n = 18, p=0.002 for pre-treatment biopsies and Response n = 13, Progression n = 12, p < 0.0001 for post treatment biopsies). Within the Response group, pSTAT1 expression was significantly higher during treatment when compared to baseline (p = 0.022).
Extended Data Figure 4. Relationship between CD8 and PD-L1 expression in terms of treatment outcome.
a, Scatterplots of CD8 and PD-L1 density (cells/mm2) using a log(x+1) scale are shown in samples obtained at baseline stratified by treatment outcome. Reference “cut-points” for CD8 and PD-L1 densities were based on the median value for each marker across the entire cohort. Samples present in the CD8highPD-L1high quadrant, in both tumour and invasive margin, were predominantly derived from the Response group. Samples present in the CD8lowPD-L1low quadrants were significantly associated with the Progression group (Response n=17, Progression n=21, P < 0.001 at both the invasive margin and tumour). b, CD8, PD-1, and PD-L1 expression before treatment in terms of clinical response. Representative examples of the proximity between CD8+, PD-1+, PD-L1+ cells in the tumour microenvironment in pre-treatment samples obtained from a patient with a tumour response and progression. Magnification, X20. 2 μM serial cut tissue sections were stained for CD8, PD-1, and PD-L1. c, Multiplexed immunofluorescence staining of CD8 and PD-1 to evaluate the relative coexpression of CD8 and PD-1 on individual cells within the tumour microenvironment. CD8+ cells were were detected using AlexaFluor 488 staining in the green channel. PD-1+ cells were detected suing AlexaFluor 594 staining in the red channel. High levels of co-expression of the 2 antigens were observed when the two channels are combined, yielding yellow signal in areas of colocalization.
Extended Data Figure 5. PD-L1 expression and relationship with T cell infiltration.
a, Multiplexed chromogenic staining of SOX-10 (red nucleus) and PD-L1 (brown membrane) to evaluate PD-L1 expression on melanoma cells, lymphocytes, and macrophages within the tumour microenvironment. SOX-10 is a transcription factor that is melanoma cell specific. Representative high power fields of double positive cells (yellow arrows) show melanoma cells expressing PD-L1 and single positive PD-L1 cells comprising of lymphocytes (high nuclear:cytoplasmic ratio, red arrows) and macrophages (low nuclear:cytoplasmic ratio, green arrows) in three responders from samples obtained during tumour regression.. Magnification, X40. b, Principal component analysis (PCA) to decompose the variance for the markers (CD8+, PD-1+, PD-L1+, and CD4+ cell densities (cells/mm2) separately in the tumour and in the invasive margin. The first principal component accounted for the majority of the variability in the four markers 69.6% and 57.1%, in the tumour center (***P= 0.001) and the invasive margin (****P < 0.0001), respectively. Principal component scores for the first principal component were compared between response groups with Wilcoxon rank sum tests.
Extended Data Figure 6. Clonality of the T-cell repertoire and density of T-cell infiltration (TIL) in terms of clinical response.
a, High throughput quantitative sequencing of the rearranged TCR beta genes using the ImmunoSeq assay. (Response n=13, Progression n=12). ***P = 0.005 by Fisher’s exact test. The x-axis represents clonality of the T cell repertoire (1 – Pielou’s evenness) and the y-axis represents the density of tumour-infiltrating T cells (estimated TCR gene rearrangements per diploid genomes, see supplementary methods for further detail). The axes cross at the median value for clonality and TIL infiltration. TIL infiltration and TIL repertoire clonality were found to be independent in this cohort (R2 = 0.04). Progressors were associated with lower levels of TIL infiltration and lower TIL clonality (i.e., a more diverse TIL repertoire); all patients with below-median clonality and TIL infiltration progressed. b, The uniqueness of the CDR3 TCR sequences enable tracking of clonal expansion or contraction clones in serially sampled tumours. Representative scatterplot of clones from a responding tumour serially sampled before and during aPD-1 treatment. (1 dot = 1 unique clone: green-expanded, grey-stable, red-contracted). The x- and y- axes represent the relative abundance of each clone before and during treatment, respectively. Clones that met a 2x change in frequency from baseline must have also met significance using a Fisher Exact test of the clone before and during aPD-1 and the full set of clone reads, followed by Storey’s Qvalue for false discovery rate. c, Clonal expansion in terms of clinical response (Response n=6, Progression n=5) **P= 0.006
Extended Data Table 1.
Demographic and clinical characteristics of patients in the Study and Validation cohorts.
| Variable | Response | Progression | p-value* |
|---|---|---|---|
| UCLA Patients (N=46) | N=22€ | N=24 | |
| Male (%) | 17 (74%) | 19 (79%) | >0.99 |
| Median Age (range) | 65 (45–90) | 64 (36–86) | 0.86£ |
| Median WBC Count (range) | 6.9 (3.9–21.3) | 7.1 (4.0–24.8) | 0.52 |
| Median Pre-TX Tumor Burden in cm (range)¥ | 8.7 (1.1–32.2) | 7.9 (1.1–19.4) | 0.9£ |
| Metastatic Status | |||
| M0 | 3 (13%) | 2 (8%) | 0.13£ |
| M1a | 4 (17%) | 2 (8%) | |
| M1b | 7 (30%) | 6 (25%) | |
| M1c | 8 (35%) | 14 (58%) | |
| Dosing Regimen | |||
| 10Q2W | 9 (39%) | 5 (21%) | 0.2 |
| 10Q3W | 8 (35%) | 8 (33%) | |
| 2Q3W | 5 (22%) | 11 (46%) | |
| BRAF Mutation | |||
| Mutant (# not wild type) | 7 (30%) | 9 (38%) | 0.76 |
| Previous Treatment | |||
| chemotherapy | 3 (13%) | 5 (21%) | 0.7 |
| BRAF or MEK inhibitor | 3 (13%) | 5(21%) | 0.7 |
| immunotherapy | |||
| ipilimumab | 8 (35%) | 13 (54%) | 0.25 |
| other | 7 (30%) | 9 (38%) | 0.76 |
| Pre TX Biopsy Location₠ | |||
| Subcutaneous | 14 (61%) | 11 (46%) | 0.02£ |
| Liver | 0 | 8 (33%) | |
| Lung | 5 (22%) | 1 (4%) | |
| Other | 3 (13%) | 3 (13%) | |
| IGR Patients (N=15) | N=10 | N=5 | |
| Median Age (range) | 55 (26–73) | 60 (38–61) | 0.77£ |
| Male (%) | 4 (40%) | 2 (40%) | >0.99 |
| Metastatic Status | |||
| M0 | 2 (20%) | 0 (0%) | 0.51£ |
| M1a | 3 (30%) | 1 (20%) | |
| M1b | 0 (0%) | 1 (20%) | |
| M1c | 5 (50%) | 3 (60%) | |
| Dosing Regimen | |||
| 10Q2W | 5 (50%) | 2 (40%) | 0.62 |
| 10Q3W | 3 (30%) | 3 (60%) | |
| 2Q3W | 2 (20%) | 0 (0%) | |
| BRAF Mutation | |||
| Mutant (# not wild type) | 4 (40%) | 2 (40%) | >0.99 |
| Previous Treatment | |||
| chemotherapy | 2 (20%) | 3 (60%) | 0.25 |
| BRAF or MEK inhibitor | 2 (20%) | 0 (0%) | 0.52 |
| immunotherapy | |||
| ipilimumab | 4 (40%) | 2 (40%) | >0.99 |
| other | 1 (10%) | 1 (20%) | >0.99 |
Extended Data Table 2. Anatomical location of biopsies performed before and during treatment.
The anatomical locations that correspond with Figure 1 are provided (Response n=13, Progression n=12 tumours biopsied at before and during aPD-1). The term lymph node/subcutaneous refers to a tumour identified as lymph node on radiographic imaging but with no evidence of lymph node architecture on histologic examination. Two out of the 25 patients had mets in transit which were distinct nodules that were < 1cm apart from each other at the time of biopsy.
| Patient | Baseline Biopsy | Post-Dosing Biopsy | Anatomical Location | Confirmed Overall Response |
|---|---|---|---|---|
| 1 | duodenal lesion | duodenal lesion | Gastrointestinal | Response |
| 2 | Segment 4 hepatic mass | Segment 4 hepatic mass | Liver | Progression |
| 3 | Segment 5 hepatic mass | Segment 5 hepatic mass | Liver | Progression |
| 4 | R. lower lobe lung mass | R. lower lobe lung mass | Lung | Response |
| 5 | R. lower lobe lung mass | R. lower lobe lung mass | Lung | Response |
| 6 | L. axillary mass | L. axillary mass | Lymph Node (Subcutaneous) | Response |
| 7 | L. inguinal mass | L. inguinal mass | Lymph Node (Subcutaneous) | Response |
| 8 | R. supraclavicular fossa mass | R. supraclavicular fossa mass | Lymph Node (Subcutaneous) | Response |
| 9 | R. cervical neck mass | R. cervical neck mass | Lymph Node (Subcutaneous) | Progression |
| 10 | R. axillary mass | R. axillary mass | Lymph Node (Subcutaneous) | Progression |
| 11 | R. submandibular mass | R. submandibular mass | Lymph Node (Subcutaneous) | Progression |
| 12 | L medial thigh | L. medial thigh | Subcutaneous/skin | Response |
| 13 | L. lower back mass | L. lower back mass | Subcutaneous/skin | Response |
| 14 | L chest wall mass | L. chest wall mass | Subcutaneous/skin | Response |
| 15 | Middle back mass | Middle back mass | Subcutaneous/skin | Response |
| 16 | L. face mass | L face mass | Subcutaneous/skin | Response |
| 17 | L. scapula mass | L scapula mass | Subcutaneous/skin | Response |
| 18 | L. forearm mass | L. forearm mass | Subcutaneous/skin | Progression |
| 19 | L popliteal mass | L popliteal mass | Subcutaneous/skin | Progression |
| 20 | L. lower abdomen mass | L. lower abdomen mass | Subcutaneous/skin | Progression |
| 21 | L lower abdomen mass | L. lower abdomen mass | Subcutaneous/skin | Progression |
| 22 | L scalp mass | L. scalp mass | Subcutaneous/skin | Progression |
| 23 | L. anterolateral leg mass | L. anterolateral leg mass | Subcutaneous/skin | Progression |
| 24 | L. upper arm (mets in transit) | L upper arm (mets in transit) | Subcutaneous/skin (mets in transit) | Response |
| 25 | lower leg (mets in transit) | lower leg (mets in transit) | Subcutaneous/skin (mets in transit) | Progression |
Extended Data Table 3. CD8, PD-1, PD-L1, CD4 expression, and clonality before treatment in terms of clinical response to pembrolizumab and previous treatment with ipilimumab (anti-CTLA4).
No significant association was found with previous treatment with ipilimumab and expression levels of the markers prior to receiving aPD-1 in terms of treatment outcome.
| Variable | Ipilimumaub Treatment History
|
||
|---|---|---|---|
| Response (Naïve) vs. Response (Treated) | Response (Naïve) vs. Progression (All) | Response (Naïve) vs. Progression (Treated) | |
|
| |||
| p-value*
|
|||
| Clonality | 0.1604 | 0.0568 | 0.4213 |
| Tumor density (cells/mm2) | |||
| CD8 | 0.0513 | <0.0001 | 0.0019 |
| PD-1 | 0.1198 | 0.0028 | 0.0573 |
| PD-L1 | 0.1732 | 0.0658 | 0.1645 |
| CD4 | 0.2453 | 0.3453 | 0.3948 |
| Stroma density (cells/mm2) | |||
| CD8 | 0.0170 | <0.0001 | 0.0016 |
| PD-1 | 0.0358 | 0.0330 | 0.1872 |
| PD-L1 | 0.3121 | 0.0049 | 0.0123 |
| CD4 | 0.2051 | 0.4183 | 0.4316 |
p-values represent estimations using the non-parametric Mann-Whitney test
Extended Data Table 4. Predictive model and validation.
a, ROC curve analysis for clinical response based on pre-treatment CD8+, PD-1+, PD-L1+, and CD4+ cells. The area under the ROC curve (AUC) was used to measure response prediction performance for pre-treatment CD8+, PD-1+, PD-L1+, and CD4+ cell densities (cells/mm2). P-values were computed on the basis of the Wilcoxon rank sum statistic. b, Performance of a model for clinical response using CD8+ (cells/mm2). A logistic regression model was constructed using pre-treatment CD8+ (cells/mm2) versus the outcome of clinical response (PR+SD vs PD) using the study cohort. This fixed model was then applied to the CD8+ density measurements in the validation cohort to compute predicted probabilities of response to treatment.
| a | ||
|---|---|---|
| Variable | AUC (95% Cl)* | P-value** |
| Tumour | ||
| CD8+ Density | .91 (0.81, 1.00) | <0.001 |
| PD-1+ Density | .80 (0.67, 0.94) | 0.001 |
| PD-L1+ Density | .71 (0.54, 0.88) | 0.026 |
| CD4+ Density | .66 (0.48, 0.84) | 0.095 |
| Invasive Margin | ||
| CD8+ Density | .94 (0.88, 1.00) | <0.001 |
| PD-1 + Density | .80 (0.66, 0.94) | 0.001 |
| PD-L1+ Density | .79 (0.64, 0.95) | 0.002 |
| CD4+ Density | .66 (0.48, 0.84) | 0.095 |
| b | ||||
|---|---|---|---|---|
| Patient ID | CD8+ Density, Before Tx (Invasive Margin) | Predicted Probability of Response (Logistic Model) | Blinded Prediction | True Clinical Response (RECIST 1.1) |
| IGR-A | 58 | 0.35 | Progression | Progression |
| IGR-B | 159 | 0.37 | Progression | Progression |
| IGR-C | 329 | 0.40 | Progression | Progression |
| IGR-D | 341 | 0.41 | Progression | Progression |
| IGR-E | 2120 | 0.75 | Response | Stable |
| IGR-F | 5466 | 0.98 | Response | Progression |
| IGR-G | 2211 | 0.76 | Response | Response |
| IGR-H | 3810 | 0.92 | Response | Response |
| IGR-I | 4294 | 0.95 | Response | Response |
| IGR-J | 4948 | 0.97 | Response | Response |
| IGR-K | 5565 | 0.98 | Response | Response |
| IGR-L | 6004 | 0.99 | Response | Response |
| IGR-M | 5951 | 0.99 | Response | Complete Response |
| IGR-N | 7230 | 0.99 | Response | Complete Response |
| IGR-O | 6320 | 0.99 | Response | Complete Response |
Acknowledgments
This study was funded in part by the NIH grants K08 AI091663, Kure It Research Grant, UL1TR000124 (to P.C.T), P01 CA168585, U54 CA119347, R01 CA170689, the Ressler Family Fund, the Dr. Robert Vigen Memorial Fund, the Wesley Coyle Memorial Fund, and the Garcia-Corsini Family Fund (to A.R.), P30 CA16042 to D.A.E. A.R. was supported by a Stand Up To Cancer – Cancer Research Institute Cancer Immunology Dream Team Translational Research Grant (SU2C-AACR-DT1012). Stand Up To Cancer is a program of the Entertainment Industry Foundation administered by the American Association for Cancer Research M.S. was supported as a Howard Hughes Medical Institute Medical Research Fellow. Some of the studies were funded by Merck Sharp and Dome and by Adaptive Biotechnologies. L.R. was supported by the V Foundation-Gil Nickel Family Endowed Fellowship in Melanoma Research and a grant from the Spanish Society of Medical Oncology (SEOM) for Translational Research in Reference Centers. We acknowledge the Translational Pathology Core Laboratory (TPCL) for tissue sectioning and slide scanning, Séverine Roy and Nyam Kamsu-Kom from Gustave Roussy and Rongqing Guo, Jia Pang, Wang Li, Arturo Villanueva and Kaitlin Crawford from UCLA for biopsy processing and clinical data, Steven Hashaghan for assisting with quantitative imaging approaches, and Ervin Penaflor for assisting in IHC assay optimization, execution and digital image generation, and Belma Dogdas and Saurin Mehta who assisted with the proximity assay. We would like to thank Drs. Scot Ebbinghaus, Eric Rubin, Peter Kang, Robert L. Modlin, Clive R. Taylor, and Christopher Denny for critically reviewing the manuscript.
Footnotes
Supplementary Information is linked to the online version of the paper at www.nature.com/nature.
Reprints and permissions information is available at www.nature.com/reprints. R.O.E. has full-time employment and equity ownership at Adaptive Biotechnologies Corporation. H.S.R. has consultancy, patents & royalties, and equity ownership at Adaptive Biotechnologies Corporation.
Additional Information Accessions codes, Supplementary Information statement (if applies), Competing financial interests, License to publish statement, How to cite this article statement.
Author Contributions P.C.T. and A.R. supervised the project and developed the concepts. P.C.T., C.L.H., C.R. and A.R. designed the experiments. P.C.T., C.L.H., M.S., C.R. and A.R. interpreted the data. A.R., P.C.T., C.L.H., C.R., J.H.Y., M.S., I.P.S., E.J.M.T., R.O.E, H.R. and R.H.P. gave conceptual advice and edited the manuscript. P.C.T, J.H.Y., I.P.S. and E.J.M.T established IHC staining and/or imaging protocols. J.H.Y., I.P.S., E.J.M.T. and R.H.P. provided confirmatory pathology analyses. G.T worked on IHC samples from the patients from Gustave Roussy. C.L.H., L.R., M.S., G.H., V.S.C, K.H., M.C., C.K. and E.S. provided technical support. P.C.T, T.R.G. and D.A.E. designed and implemented the predictive model and provided statistical support. P.C.T., B.C., J.A.G., G.C., C.R. and A.R. clinically evaluated patients in the trial.
References
- 1.Topalian SL, et al. Safety, activity, and immune correlates of anti-PD-1 antibody in cancer. New England Journal of Medicine. 2012;366:2443–2454. doi: 10.1056/NEJMoa1200690. [DOI] [PMC free article] [PubMed] [Google Scholar]
- 2.Brahmer JR, et al. Safety and activity of anti-PD-L1 antibody in patients with advanced cancer. New England Journal of Medicine. 2012;366:2455–2465. doi: 10.1056/NEJMoa1200694. [DOI] [PMC free article] [PubMed] [Google Scholar]
- 3.Hamid O, et al. Safety and tumor responses with lambrolizumab (anti-PD-1) in melanoma. New England Journal of Medicine. 2013;369:134–144. doi: 10.1056/NEJMoa1305133. [DOI] [PMC free article] [PubMed] [Google Scholar]
- 4.Wolchok JD, et al. Nivolumab plus ipilimumab in advanced melanoma. N Engl J Med. 2013;369:122–133. doi: 10.1056/NEJMoa1302369. [DOI] [PMC free article] [PubMed] [Google Scholar]
- 5.Topalian SL, et al. Survival, durable tumor remission, and long-term safety in patients with advanced melanoma receiving nivolumab. J Clin Oncol. 2014;32:1020–1030. doi: 10.1200/JCO.2013.53.0105. [DOI] [PMC free article] [PubMed] [Google Scholar]
- 6.Pardoll DM. The blockade of immune checkpoints in cancer immunotherapy. Nature Reviews Cancer. 2012;12:252–264. doi: 10.1038/nrc3239. [DOI] [PMC free article] [PubMed] [Google Scholar]
- 7.Spranger S, et al. Up-regulation of PD-L1, IDO, and T(regs) in the melanoma tumor microenvironment is driven by CD8(+) T cells. Sci Transl Med. 2013;5:200ra116. doi: 10.1126/scitranslmed.3006504. [DOI] [PMC free article] [PubMed] [Google Scholar]
- 8.Robert C, et al. Anti-programmed-death-receptor-1 treatment with pembrolizumab in ipilimumab-refractory advanced melanoma: a randomised dose-comparison cohort of a phase 1 trial. Lancet. 2014 doi: 10.1016/S0140-6736(14)60958-2. [DOI] [PubMed] [Google Scholar]
- 9.Parsa AT, et al. Loss of tumor suppressor PTEN function increases B7-H1 expression and immunoresistance in glioma. Nat Med. 2007;13:84–88. doi: 10.1038/nm1517. [DOI] [PubMed] [Google Scholar]
- 10.Atefi M, et al. Effects of MAPK and PI3K Pathways on PD-L1 Expression in Melanoma. Clin Cancer Res. 2014;20:3446–3457. doi: 10.1158/1078-0432.CCR-13-2797. [DOI] [PMC free article] [PubMed] [Google Scholar]
- 11.Bald T, et al. Immune cell-poor melanomas benefit from PD-1 blockade after targeted type I IFN activation. Cancer Discov. 2014;4:674–687. doi: 10.1158/2159-8290.CD-13-0458. [DOI] [PubMed] [Google Scholar]
- 12.Duraiswamy J, Freeman GJ, Coukos G. Dual blockade of PD-1 and CTLA-4 combined with tumor vaccine effectively restores T-cell rejection function in tumors--response. Cancer Res. 2014;74:633–634. doi: 10.1158/0008-5472.CAN-13-2752. discussion 635. [DOI] [PubMed] [Google Scholar]
- 13.Galon J, et al. Type, density, and location of immune cells within human colorectal tumors predict clinical outcome. Science. 2006;313:1960–1964. doi: 10.1126/science.1129139. [DOI] [PubMed] [Google Scholar]
- 14.Pages F, et al. Effector memory T cells, early metastasis, and survival in colorectal cancer. N Engl J Med. 2005;353:2654–2666. doi: 10.1056/NEJMoa051424. [DOI] [PubMed] [Google Scholar]
- 15.Taube JM, et al. Association of PD-1, PD-1 ligands, and other features of the tumor immune microenvironment with response to anti-PD-1 therapy. Clin Cancer Res. 2014 doi: 10.1158/1078-0432.CCR-13-3271. [DOI] [PMC free article] [PubMed] [Google Scholar]
- 16.Robins HS, et al. Comprehensive assessment of T-cell receptor beta-chain diversity in alphabeta T cells. Blood. 2009;114:4099–4107. doi: 10.1182/blood-2009-04-217604. [DOI] [PMC free article] [PubMed] [Google Scholar]
- 17.Carlson CS, et al. Using synthetic templates to design an unbiased multiplex PCR assay. Nature communications. 2013;4:2680. doi: 10.1038/ncomms3680. [DOI] [PubMed] [Google Scholar]
- 18.Zhang L, et al. Intratumoral T cells, recurrence, and survival in epithelial ovarian cancer. N Engl J Med. 2003;348:203–213. doi: 10.1056/NEJMoa020177. [DOI] [PubMed] [Google Scholar]
- 19.Ribas A, Hodi FS, Kefford R, Hamid O, Daud A, Wolchok JD, Hwu W, Gangadhar TC, Patnaik A, Joshua AM, Hersey P, Weber JS, Dronca RS, Zarour HM, Gergich K, Li X, Iannone R, Kang PS, Ebbinghaus S, Robert C. Efficacy and safety of the anti-PD-1 monoclonal antibody MK-3475 in 411 patients (pts) with melanoma (MEL) J Clin Oncol. 2014;32:5s. [Google Scholar]
- 20.Wolchok JD, et al. Guidelines for the evaluation of immune therapy activity in solid tumors: immune-related response criteria. Clin Cancer Res. 2009;15:7412–7420. doi: 10.1158/1078-0432.CCR-09-1624. 1078-0432.CCR-09-1624 [pii] [DOI] [PubMed] [Google Scholar]


