

Abstract
• Background The 6 years since the last Angiosperm Genome Size Discussion Meeting in 1997 have experienced the decline of the then widely held idea of the ‘plastic’ genome. Several published cases of intra-specific variation in cultivated plants have been questioned on re-investigation with an improved technical approach. At the same time, technical problems caused by staining inhibitors present in the plant material have been recognized. In the accumulation of genome size data more critical methods and rules for best practice are urgently needed.
• Infra-specific Variation Re-visited This review is about (a) the basic requirement for repeatability of results and the need for self-criticism on the part of the investigator and (b) the critical points in the technical procedure, particularly the quantitative Feulgen reaction. Case studies are presented on Dasypyrum villosum (refuting a previously reported ‘plastic genome’ phenomenon), on Glycine max (refuting previously claimed intraspecific variation) and on Arachis hypogaea and A. duranensis, in which reported C-values are too high by roughly two-fold. In A. hypogaea the reported intraspecific genome size variation could not be confirmed. Furthermore, a claimed negative correlation between altitude and genome size in A. duranensis was shown to be based on an arbitrary omission of data points that did not fit the correlation (although a correlation was found).
• Best Practice Methodology The finding of previously published questionable studies was the incentive for a re-consideration of the quantitative Feulgen procedure with regard to best practice in genome size studies. Clarification here of the critical steps of the method should help to improve the data in the literature. It must be stressed that the most important requirement is the need for a self-critical attitude of researchers to their data.
Keywords: Genome size, C-value, Feulgen, densitometry, flow cytometry, standardization, Dasypyrum, Glycine, Arachis
INTRODUCTION
The existence and amount of genome size variation within species of higher plants have been topical since the early days of genome size research, when commercial cytophotometers became available. The problem is multifaceted, with instrumental–technical, preparative, material-dependent and taxonomical aspects. Importantly, the scientific approach of the investigator can also be significant. Demonstration of stability of genome size in different samples of an organism can be taken as a proof for actual stability, because any fault in methods would cause variation rather than constancy of the measurement results. The finding of variation should instantly provoke the question whether it is real variation in DNA amount or simply an artefact. Repeatability of variation is not necessarily a proof, because it could be due to an interfering factor that varies. This has been shown clearly in studies on endogenous staining inhibitors (Greilhuber, 1986, 1988; Noirot et al., 2000, 2005; Price et al., 2000). Then there is the variation or discrepancy between results on the same species by different authors (see, for instance, the treatments by Greilhuber and Obermayer, 1998a, b; Baranyi and Greilhuber, 1999; Bennett et al., 2003). Was the material the same? If not, does it matter for the conclusions? Who is using the better methods? This is the morass that this article is dealing with.
Four case studies (re-investigations in the author's laboratory) are reviewed below. They deal with (a) the special problem of the ‘plastic’ or ‘fluid’ genome and (b) the existence or otherwise of genome size variation in two cultivated plant species and in a wild progenitor of one of them. Furthermore, the apparent or real higher error-susceptibility of slide-based Feulgen densitometry compared with flow-cytometry has suggested an investigation of the critical steps of the quantitative Feulgen procedure. Despite the huge amount of methodological literature, some of its basic aspects, such as the decay in quality of fixed plant material over time while being stored at various temperatures, have obviously never been investigated before.
DASYPYRUM VILLOSUM, PLASTIC GENOME OR PLASTIC DATA?
Dasypyrum villosum (syn. Haynaldia villosa; 2n = 14) is a Mediterranean grass species of the tribe Triticeae, which exhibits a remarkable intra-individual fruit colour polymorphism from yellow to almost black. Being based on the colour of maternal tissue, this polymorphism necessarily has a modificatory basis. Accordingly, it has been shown that plants grown from fruits of any colour again produce pale and dark fruits [see references in Cremonini et al. (1994) and Cremonini (2003)]. Innocenti and Bitonti (1983) reported a longer mitotic cycle in seedlings from pale than from dark caryopses. Cremonini et al. (1994) studied heterochromatin banding patterns of metaphase chromosomes and nuclear DNA content in plants grown from pale and dark caryopses. The material originated from a natural population in Italy. In addition to minor chromosome-structural differences correlated with fruit colour, they found 20–24 % more DNA in early prophase nuclei in seedlings from pale caryopses than from dark ones. Frediani et al. (1994) described a similar but somewhat smaller difference in DNA content, together with an increase of genome size during germination, which was greatest when the initial genome was the smallest. A quantitative modulation of a certain near-telomeric sequence was found in chromosomes of germinating seedlings from the two types of caryopses, indicating the existence of a variable element in the genome of D. villosum (Frediani et al., 1994).
This problem was re-investigated with flow cytometry using propidium iodide as the DNA fluorochrome and Pisum sativum ‘Kleine Rheinländerin’ as a co-processed standard (R. Obermayer and J. Greilhuber, unpubl. res.). Twenty-nine accessions of D. villosum from various countries of the Mediterranean area were obtained from the germplasm collection of the Institut für Pflanzengenetik und Kulturpflanzenforschung (IPK) in Gatersleben. Intergradation in colouring of fruits was found, and caryopses were classified as yellow, mid-brown and dark-brown. From these, plantlets were grown and their genome size was determined. Comparison of yellow versus dark brown was possible in 17 accessions, which should allow any differences to be revealed (Table 1). A paired t-test was not significant (P = 0·212), the mean ratio of genome sizes in yellow versus dark brown was 1·0048. No other possible within-accession comparison of the three colour groups was significant. We conclude therefore, that there is no genome size plasticity associated with fruit colour in D. villosum.
Table 1.
Flow cytometric comparison of genome size (given in percentage of Pisum sativum) in young plants of Dasypyrum villosum grown from yellow and dark brown caryopses
| Genome size of D. villosum (% of Pisum sativum) |
||||
|---|---|---|---|---|
| Accession no. |
Yellow |
Dark brown |
Ratio |
|
| GRA 1313/9 | 111·3 | 111·8 | 0·9955 | |
| HGRA 960/8 | 111·9 | 114·8 | 0·9747 | |
| GRA 1105/9 | 112·1 | 114·3 | 0·9807 | |
| GRA 1310/9 | 112·1 | 111·8 | 1·0026 | |
| GRA 2706/97 | 113·2 | 113·3 | 0·9991 | |
| GRA 961/83 | 113·4 | 115·0 | 0·9860 | |
| GRA 1170/9 | 113·4 | 112·9 | 1·0044 | |
| GRA 2707/98 | 114·0* | 111·7 | 1·0205 | |
| GRA 1022/8 | 114·2 | 111·7 | 1·0223 | |
| GRA 2262/9 | 114·4 | 112·8 | 1·0141 | |
| GRA 910/81 | 115·0 | 112·2 | 1·0249 | |
| GRA 962/83 | 115·8 | 114·2 | 1·0140 | |
| GRA 1106/8 | 116·9 | 116·1 | 1·0068 | |
| GRA 1114/87 | 117·2 | 117·3 | 0·9991 | |
| GRA 2630/95 | 118·3 | 116·0 | 1·0198 | |
| GRA 992/88 | 118·7 | 116·0 | 1·0232 | |
| GRA 2713/9 | 119·3 | 119·9 | 0·9949 | |
| Means | 114·8 | 114·2 | 1·0048 | |
| s.d. | 2·522 | 2·314 | 0·0153 | |
| CV | 2·198 | 2·026 | 0·0153 | |
| N | 17 | 17 | 17 | |
| Mean of ratios | 1·0049 | |||
| Paired t-test | P = 0·212, n.s. | |||
The accessions (IPK Gatersleben) were from various Mediterranean countries.
The DNA stain was propidium iodide.
Pisum sativum ‘Kleine Rheinländerin’ was co-chopped for internal standardization.
If not stated otherwise, three D. villosum plants were studied per accession and fruit colour.
From Obermayer and Greilhuber (unpublished).
Six plants averaged.
However, there were differences in genome size up to 1·07-fold between our accessions, with a maximum difference between individuals of 1·11-fold. Within accessions the genome sizes of seedlings from pale and dark caryopses were significantly correlated (y = 0·995x; r = 0·6544). Individuals with extreme values and the standard were co-processed for flow cytometry and a separation of the Dasypyrum peaks was found (Fig. 1). These are strong arguments that the differences observed are more than just technical ‘noise’, but they are not a complete proof of real variation, because differences in content of endogenous staining inhibitors can mimic DNA content differences (Price et al., 2000), although co-processing should minimize this risk.
Fig. 1.

Simultaneous DNA flow cytometric separation of two individuals of Dasypyrum villosum from two accessions (IPK Gatersleben germplasm collection) differing, on average, about 1·08-fold in genome size. The G1 peaks: (1) Pisum sativum ‘Kleine Rheinländerin’; (2) D. villosum GRA 992/88; (3) GRA 1305/91. From R. Obermayer and J. Greilhuber (unpubl. res.).
In an extensive study on genome size variation in Italian D. villosum, Caceres et al. (1998) mention nothing of fruit colour-related differences between plants, but they report up to 17·6 % difference between means of populations and up to 66·2 % difference between individual plants within a population. In the light of the present data such a large variation appears improbable. It is possible that the use by Caceres et al. (1998) of hot hydrolysis (1 n HCl, 60 °C, 8 min) with enzyme-macerated slides could be responsible for such divergences. It is well known that the very short optimum and the fast rise and decay of the hot hydrolysis curve constitute an experimental risk. It is then questionable which value one should ascribe to the various correlations with genome size reported by Caceres et al. (1998).
GENOME SIZE VARIATION IN GLYCINE MAX
There are strong indications for an adaptive role of genome size via cell size and cell cycle time (Bennett, 1972; Price and Bachmann, 1976; Cavalier-Smith, 1985, 2005; Gregory, 2003). Plants with short reproductive cycles, such as ephemeral and annual herbs, have genomes that are smaller on average than those with long cycles such as perennial herbs (Bennett, 1972). Aggressive weeds, which are assumed to reproduce vigorously and quickly, have genomes smaller than those of non-weeds (Bennett et al., 1998). The obvious significance of genome size for developmental speed has stimulated studies in cultivated taxa, which have investigated the relationship between genome size and the time needed for seed ripening, which is largely correlated with the geographical latitude of the plants' cultivation. If developmental speed depends at least in part on genome size, selection for more rapid development could have occurred in parallel with selection for smaller genomes. This may have indeed been the case in maize landraces, in which Laurie and Bennett (1985) and Rayburn et al. (1985) have independently found a decrease in genome size from south to north in North America in connection with a decrease in amount of knob heterochromatin. In contrast, Baranyi and Greilhuber (1995, 1996) found uniform genome sizes in highly selected cultivars, landraces and wild accessions of Pisum sativum worldwide, including samples from equatorial regions and Scandinavia.
Glycine max (soybean) cultivars in North America have been investigated by Graham et al. (1994), using flow cytometry and propidium iodide as the DNA stain, but with no internal standard. They found genome size to vary by about 1·11-fold, the more northern-adapted cultivars having genomes significantly smaller than those of southern-adapted ones. In 95 Chinese accessions of soybean a similar range of variation was recorded, but maturity groups were not available (Rayburn et al., 1997). However, a flow-cytometric and Feulgen densitometric re-investigation of the same North-American soybean cultivars by Greilhuber and Obermayer (1997), who used internal standardization, revealed uniformity of genome size (see also Greilhuber, 1998). A closer inspection of the data of Graham et al. (1994) by Greilhuber and Obermayer (1998b) showed that the significance of their correlation resulted from one single extraordinarily low value and a few deviations from the USDA (United States Department of Agriculture) maturity group list. If these are corrected and the low value is excluded, the significance disappears. In a further study, Obermayer and Greilhuber (1999) presented evidence for genome size stability in Chinese soybeans, showing that there is actually no difference between the five accessions ranking highest and the five ranking lowest in the study by Rayburn et al. (1997) (Fig. 2). Chung et al. (1998) studied genome size in 12 lines of soybean with flow cytometry in relation to a correlation with seed size and weight and leaf size. They found a small variation, up to 1·046-fold, in genome size, that was strongly correlated with seed weight and leaf size, although seed size varied more than five-fold and leaf size varied more than two-fold between extreme lines. It would be interesting to know to what extent leaf cell size and nuclear size, and hence chromatin dispersion, also vary in parallel with organ size in these lines. It would be worthwhile to study the possible influence that chromatin compaction can have on uptake of propidium iodide by the nuclei, and whether this factor could have contributed to this minor variation in genome size estimates.
Fig. 2.

Genome size variation in Chinese Glycine max (USDA germplasm collection). Five accessions ranking highest and lowest, respectively, in Rayburn et al. (1997) (filled columns) as re-analysed by Obermayer and Greilhuber (1999) (open columns).
ARACHIS HYPOGAEA
The groundnut (Arachis hypogaea, 2n = 40, 4x) is another important grain legume in which genome size variation in the range of 1·15-fold has been described recently (Singh et al., 1996). The method of measurement was Feulgen densitometry. As the variation was reported even within varieties of the same subspecies, Temsch and Greilhuber (2000) undertook a re-analysis of the most divergent samples studied by Singh et al. (1996), using flow-cytometry and Feulgen densitometry. Not only was the variation not confirmed, but they even found the mean of the C-values to be very different from that given by Singh et al. (1996) (Fig. 3). In fact, the values reported by Singh et al. (1996) are about twice as high as they should be. It is noteworthy that a value for A. hypogaea similar to that obtained by Temsch and Greilhuber (2000) had already been recorded in the literature (Arumuganathan and Earle, 1991). The uniformity of genome size in A. hypogaea is in line with the low molecular variability of this species (Stalker et al., 1995).
Fig. 3.

A comparison of genome size measurement results in accessions of Arachis duranensis (rows 8123–13216), A. hypogaea (rows 139–10096) and its wild progenitor A. monticola (row 8135) (ICRISAT germplasm collection, Patancheru, India) by Singh et al. (1996) (dark columns) and by Temsch and Greilhuber (2000, 2001) (white columns). Original figure by E. M. Temsch.
ARACHIS DURANENSIS
Arachis duranensis (2n = 20, 2x) is one of the possible wild ancestors of the groundnut, A. hypogaea. The species is morphologically variable and exhibits more molecular variation than A. hypogaea (Stalker et al., 1995). Singh et al. (1996) reported 1·11-fold variation in genome size in 28 accessions. In 11 of these, in which data on the altitude of the collection sites were given, a strong negative correlation between C-values and altitude was found. In a re-investigation of this case, covering 20 accessions, Temsch and Greilhuber (2001) also found some variation. At 1·07-fold, it was not as high as that reported by Singh et al. (1996), but there was also a negative correlation with altitude of the sampling sites as given by the ICRISAT. Paradoxically, however, the measurement data obtained from the same 11 accessions with known altitude above sea level published by Singh et al. (1996) and by Temsch and Greilhuber (2001) were not significantly correlated (Temsch and Greilhuber, 2001). The explanation is this: Singh et al. (1996), although certainly having all of the altitude data documented by the ICRISAT (one co-author was an authority of the germplasm collection at that time), selected 11 samples which fitted such an arbitrarily assumed regression line. If all altitudes above sea level now available (Stalker et al., 2003) are considered and correlated against the corresponding genome size data by Singh et al. (1996), no significant correlation is observed (Fig. 4).
Fig. 4.
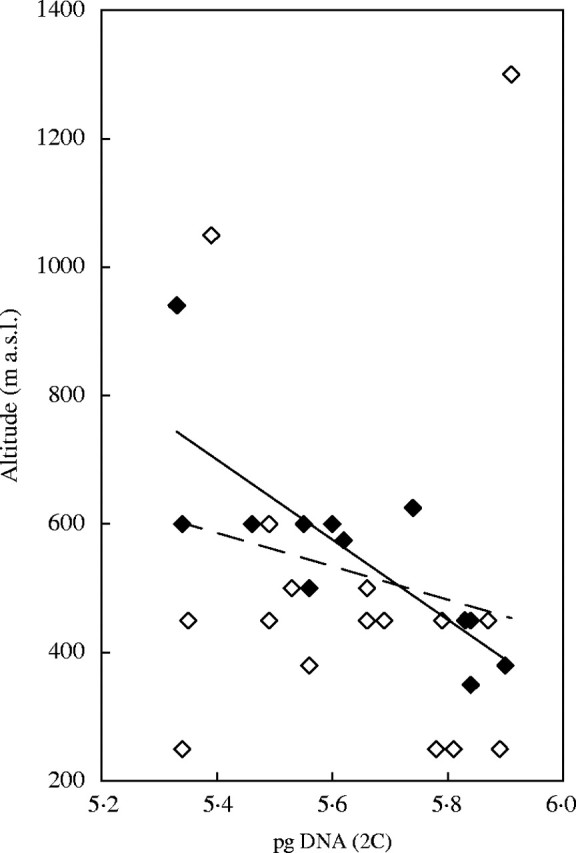
Diagram showing the available data in Arachis duranensis on the altitude above sea level of collection sites (Stalker et al., 2003) correlated against the genome size measurements by Singh et al. (1996). The data points included by Singh et al. (1996) are shown in black (r = −0·778, P ≤ 0·005), those not included are shown in white. The overall correlation is not significant (r = −0·210, P = 0·283). Original figure by E. M. Temsch.
IMPORTANCE OF BEST PRACTICE METHODOLOGY
Flow cytometry and Feulgen densitometry are complementary techniques with advantages and disadvantages of their own, as has been shown in two studies that give highly comparable results (Doležel et al., 1998; Vilhar et al., 2001). While gross errors in DNA content estimates by flow cytometry using intercalating fluorochromes seem to be rare, except when inhibitors are involved (Price et al., 2000; Noirot et al., 2000), or when wrong assumptions for standard species are made (see Doležel et al., 2003; Doležel and Bartoš 2005), it is surprising that two-fold errors occur in recently published studies purportedly using established techniques and instruments on plant material which cannot be regarded as particularly difficult. Work on the legume Cajanus is one example, where Bennett and Smith (1976) and Greilhuber and Obermayer (1998a) found C-values only half as large as those recorded by Ohri et al. (1994) while Ohri and Singh (2002) have used new measurements to defend the criticized data against Greilhuber and Obermayer (1998b). The discrepancies in Arachis as shown in this paper are another example. In the accumulation of genome size data (Bennett and Leitch, 2003), questions of best practice in Feulgen cytophotometry are obviously more important than ever. Therefore, we have studied some basic aspects of the Feulgen method in plants (Greilhuber and Temsch, 2001; J. Greilhuber, unpubl. res.), some of which have either not been studied at all before, or not in plant material. Our point of view, including recent observations, is summarized below.
Plant material frequently contains endogenous staining inhibitors (presumably often of phenolic nature) that can strongly affect the measurement results (Greilhuber, 1986, 1988). Before fixation, plant parts preferred for study (e.g. ovules) should be separated from other parts, which might contain such inhibitors in higher concentration. The working standard (biological reference material for calculating absolute DNA amounts and making data universally comparable) should be free of inhibitors. Actively growing root tips of Pisum sativum meet this condition. In addition, this species has desirable karyological characteristics for quantitative work (Vilhar et al., 2001): it is apparently stable in genome size world-wide (Baranyi and Greilhuber, 1995, 1996), and it is easy to obtain and to germinate. Any available cultivar can be chosen and calibrated against P. sativum ‘Minerva Maple’ as a precaution. ‘Minerva Maple’ is obtainable from Professor M. D. Bennett, Royal Botanic Gardens, Kew, Surrey, UK.
Plant material with unknown characteristics should be fixed both with 1 : 3 acetic methanol or acetic ethanol and 4 % buffered formaldehyde. Formaldehyde polymerizes condensed tannins within the vacuole (Greilhuber, 1986). Phenolics often turn brown in formaldehyde and are thus recognized. The working standard should both be co-fixed in the same vessel as the test material and in a separate vessel concurrently. Caution should be exercised if the results differ considerably between fixatives, when the test material shows unusual variation in staining, or if the co-fixed standard shows inhibition. With formaldehyde fixation, increased time, temperature and concentration, and lower pH will all reduce Feulgen staining intensity. In contrast to formaldehyde, acetic alcohols as nucleoprotein-precipitating fixatives do not have this influence. This is the rationale for fixing a working standard in parallel when formaldehyde is used. After about 1·5 h the formaldehyde should be washed out for about 1 h or longer with several changes of acetic methanol. Formaldehyde- and acetic alcohol-fixed material should soon be transferred (say, after 24 h in the refrigerator) to ethanol and stored at −20 °C. It then retains full staining capacity for at least 7 years (J. Greilhuber, unpubl. res.). Quality decay of acetic-alcohol fixations kept in ethanol and acetic methanol at room temperature, at about 6 °C (refrigerator) and at −20 °C was studied by J. Greilhuber (unpubl. res.) (Fig. 5). The results indicate that fixations can be kept for about 2 weeks at ambient temperature, but then decay becomes considerable. It is stronger when the fixative has not been replaced by ethanol. This information may be helpful when the material is collected in the field. Decay in the refrigerator is surprisingly slow, with 3 months of storage seeming possible. Temperature while storing fixations should always be regarded a critical parameter and kept as low as possible. This is especially relevant during field work.
Fig. 5.

Quality decay of fixations over time, shown as reduction in Feulgen staining intensity, in Pisum sativum root tip meristems, stored in acetic methanol or 96 % ethanol, at room temperature, in the refrigerator (approx. 6 °C), and at −20 °C. At any point of time the telophase DNA content of deep-frozen ethanol stored root tips served as reference (100 %) (20 telophase nuclei were measured in each of two or three slides).
Fixed material should be cut into small pieces and washed before hydrolysis. Prolonged hydration is not a problem, and several days in water in the refrigerator should have no adverse effect.
Hydrolysis is well known to be the most critical step of the Feulgen method. For most routine purposes, in plants the Feulgen procedure should be conducted on small pieces of tissue. In general, there is no advantage in carrying out the procedure on slides, which needs large quantities of reagents and eventually a pre-maceration. The classical hot hydrolysis (1 n HCl, 60 °C, about 10 min) has a very short optimum which is difficult to control and for which different authors give different times. The cold hydrolysis curve (5 n HCl, 20 °C, 60 min) has a very flat region of reasonable duration (55–65 min are optimum for acetic alcohol, 90 min for formaldehyde) (Fig. 6). It is clear that hot hydrolysis is too difficult to control for quantitative work. Although cold hydrolysis has long been known to be best practice (Fox, 1968), it has been ignored by many workers on DNA amounts. It seems that diverse organisms such as Pisum sativum, Homo sapiens and downy mildews have the same hydrolysis optimum (Voglmayr and Greilhuber, 1998; J. Greilhuber, unpubl. res.). The time that formaldehyde-fixed material is stored in ethanol has apparently little effect on the shape of the hydrolysis curve (Fig. 6), although removal of bound formaldehyde from tissue in ethanol has been reported (Helander, 1994). Thus, a steeper decline of the curve in aged material could be supposed to occur, but this is not observed in at least the first year of storage at −20 °C.
Fig. 6.

Hydrolysis curves of Pisum sativum root tip meristems, fixed either in acetic methanol (triangles) or 4 % buffered formaldehyde for 1·5 h, stored at −20 °C overnight (squares) or for 69 weeks (diamonds). From Greilhuber and Temsch (2001).
The most critical step of the whole procedure after hydrolysis is the post-hydrolysis wash. Hydrolysed material is unstable, and DNA is lost relatively quickly (Fig. 7). Rinsing should be kept as short as necessary, with several changes of cool distilled water for a total of 5–10 min to minimize DNA loss. In Schiff's reagent (1·5 h, 20 °C), the DNA–Schiff complex becomes surprisingly stable while staining occurs (see below), but prolonged staining leads to a reduction of stain intensity, probably because DNA fragments are lost.
Fig. 7.

Influence of post-hydrolysis washes in distilled water at room temperature on Feulgen stainability of Pisum sativum meristems, fixed either with acetic methanol (MAA) or 4 % buffered formaldehyde (FA). Integrated optical density (IOD) at any point of time is expressed in percentage of IOD as found after a 5-min wash. From Greilhuber and Temsch (2001).
SO2 water can be applied at room temperature (approx. 21 °C) for about 45 min (but not longer than 2 h) to remove all unbound Schiff's reagent. The material should then be transferred to water. J. Greilhuber (unpubl. res.) kept stained material for 9 d in distilled water in the refrigerator and observed no loss of stain. Softening in 45 % acetic acid should be optimized (15 min at 20 °C), because loss of stain is again accelerated by longer treatments. Squashes in 45 % acetic acid should be made of test material and standards in parallel. Air-drying the slides after coverslip removal over dry ice, etc. results in flattened nuclei, which is important for optical reasons. A short ethanol wash is usually done, but its duration is not critical (Greilhuber and Temsch, 2001). Squashes are measured without coverslips under an oil-immersion objective. No advantage is seen in using coverslips except for protection after measurement. Slides stored at room temperature in the dark are reasonably stable for at least a few weeks (Greilhuber and Temsch, 2001).
It is not the purpose of this paper to deal with the instrumental side of measurement technology. However, it is noteworthy that some authors continue to use, with reference to Sharma and Sharma (1980), a so called ‘one-wavelength method’ of absorbance cytophotometry, which is suspected to suffer strongly from distributional error. As far as one can see from the poor descriptions, monochromatic light is used in this method with no scanning device. It is also not the one-wavelength, two-area method of Garcia (1965) and not the archaic plug method (e.g. Swift, 1950). It seems that the nuclei are put into a fixed measurement area and the overall absorbance is recorded. Indeed, Sharma and Sharma (1972, p. 273) wrote that with rather homogeneous samples such as interphase nuclei this method ‘can successfully be applied’. Further, Sharma and Sharma (1980, p. 311) wrote ‘This method holds good for homogeneous samples such as interphase.’ This is a misconception and a misunderstanding what ‘homogeneous’ means in this context, namely homogeneity of the whole field of measurement and not only of the object. The distributional error is neither avoided nor corrected with this practice. It is the task of the reviewers of submitted manuscripts to insist on a lucid presentation of the methodological approach to measure DNA, to avoid publication of data which are based on physically unsound techniques.
Acknowledgments
Thanks go to Eva Maria Temsch and Renate Obermayer for their work in the team and for help with preparing the figures. Support by the Austrian Science Fund (P14607-B03) is gratefully acknowledged.
LITERATURE CITED
- Arumuganathan K, Earle ED. 1991. Nuclear DNA content of some important plant species. Plant Molecular Biology Reporter 9: 208–218. [Google Scholar]
- Baranyi M, Greilhuber J. 1995. Flow cytometric analysis of genome size variation in cultivated and wild Pisum sativum (Fabaceae). Plant Systematics and Evolution 194: 231–239. [Google Scholar]
- Baranyi M, Greilhuber J. 1996. Flow cytometric and Feulgen densitometric analysis of genome size variation in Pisum Theoretical and Applied Genetics 92: 297–307. [DOI] [PubMed] [Google Scholar]
- Baranyi M, Greilhuber J. 1999. Genome size in Allium: in quest of reproducible data. Annals of Botany 83: 687–695. [Google Scholar]
- Bennett MD. 1972. Nuclear DNA content and minimum generation time in herbaceous plants. Proceedings of the Royal Society, Series B 181: 109–135. [DOI] [PubMed] [Google Scholar]
- Bennett MD, Leitch IJ. 2003. Plant DNA C-values database (release 2·0). http://www.rbgkew.org.uk/cval/homepage.html (accessed 20 Oct. 2003). [Google Scholar]
- Bennett MD, Leitch IJ, Hanson L. 1998. DNA amounts in two samples of angiosperm weeds. Annals of Botany 82 (Suppl. A): 121–134. [Google Scholar]
- Bennett MD, Leitch IJ, Price HJ, Johnston JS. 2003. Comparison with Caenorhabditis (∼100 Mb) and Drosophila (∼175 Mb) using flow cytometry show genome size in Arabidopsis to be ∼157 Mb and thus ∼25 % larger than the Arabidopsis Genome Initiative estimate of ∼125 Mb. Annals of Botany 91: 547–557. [DOI] [PMC free article] [PubMed] [Google Scholar]
- Bennett MD, Smith JB. 1976. Nuclear DNA amounts in angiosperms. Philosophical Transactions of the Royal Society of London, Series B 274: 227–274. [DOI] [PubMed] [Google Scholar]
- Caceres ME, De Pace C, Scarscia Mugnozza GT, Kotsonis P, Ceccarelli M, Cionini PG. 1998. Genome size variations within Dasypyrum villosum: correlations with chromosomal traits, environmental factors and plant phenotypic characteristics and behaviour in reproduction. Theoretical and Applied Genetics 96: 559–567. [Google Scholar]
- Cavalier-Smith T. 1985. Cell volume and the evolution of the eukaryote genome size. In: Cavalier-Smith T, ed. The evolution of genome size. Chichester, New York: John Wiley & Sons, 105–184. [Google Scholar]
- Cavalier-Smith T. 2005. Economy, speed and size matter: evolutionary forces driving nuclear genome miniaturisation and expansion. Annals of Botany 95: 147–175. [DOI] [PMC free article] [PubMed] [Google Scholar]
- Chung J, Lee J-H, Arumuganathan K, Graef GL, Specht JE. 1998. Relationships between nuclear DNA content and seed and leaf size in soybean. Theoretical and Applied Genetics 96: 1064–1068. [Google Scholar]
- Cremonini R. 2003. Cytological studies on Dasypyrum villosum http://genetics.bdtf.hu/Htmls/Publicat/hay1.html (accessed 18 Oct. 2003) [Google Scholar]
- Cremonini R, Colonna N, Stefani A, Galasso I, Pignone D. 1994. Nuclear DNA content, chromatin organization and chromosome banding in brown and yellow seeds of Dasypyrum villosum (L.) P. Candargy. Heredity 72: 365–373. [Google Scholar]
- Doležel J, Bartoš J. 2005. Plant DNA flow cytometry and estimation of nuclear genome size. Annals of Botany 95: 99–110. [DOI] [PMC free article] [PubMed] [Google Scholar]
- Doležel J, Bartoš J, Voglmayr H, Greilhuber J. 2003. Nuclear DNA content and genome size of trout and human. Cytometry 51A: 127–128. [DOI] [PubMed] [Google Scholar]
- Doležel J, Greilhuber J, Lucretti S, Meister A, Lysák MA, Nardi L, Obermayer R. 1998. Plant genome size estimation by flow cytometry: inter-laboratory comparison. Annals of Botany 82 (Suppl. A): 17–26. [Google Scholar]
- Fox DP. 1968. Some characteristics of the cold hydrolysis technique for staining plant tissues by the Feulgen reaction. Journal of Histochemistry and Cytochemistry 17: 266–272. [DOI] [PubMed] [Google Scholar]
- Frediani M, Colonna N, Cremonini R, De Pace C, Delre V, Caccia R, Cionini PG. 1994. Redundancy modulation of nuclear DNA sequences in Dasypyrum villosum Theoretical and Applied Genetics 88: 167–174. [DOI] [PubMed] [Google Scholar]
- Garcia AM. 1965. A one-wavelength, two-area method in microspectrophotometry for pure amplitude objects. Journal of Histochemistry and Cytochemistry 13: 161–167. [DOI] [PubMed] [Google Scholar]
- Graham MJ, Nickell CD, Rayburn AL. 1994. Relationship between genome size and maturity group in soybean. Theoretical and Applied Genetics 88: 429–432. [DOI] [PubMed] [Google Scholar]
- Gregory TR. 2003. Variation across amphibian species in the size of the nuclear genome supports a pluralistic, hierarchical approach to the C-value enigma. Biological Journal of the Linnean Society 79: 329–339. [Google Scholar]
- Greilhuber J. 1986. Severely distorted Feulgen DNA amounts in Pinus (Coniferophytina) after nonadditive fixations as a result of meristematic self-tanning with vacuole contents. Canadian Journal of Genetics and Cytology 28: 409–415. [Google Scholar]
- Greilhuber J. 1988. ‘Self-tanning’—a new and important source of stoichiometric error in cytophotometric determination of nuclear DNA content in plants. Plant Systematics and Evolution 158: 87–96. [Google Scholar]
- Greilhuber J. 1998. Intraspecific variation in genome size: a critical reassessment. Annals of Botany 82 (Suppl. A): 27–35. [Google Scholar]
- Greilhuber J, Obermayer R. 1997. Genome size and maturity group in Glycine max (soybean). Heredity 78: 547–551. [Google Scholar]
- Greilhuber J, Obermayer R. 1998. Genome size variation and maturity group in the soybean, Glycine max In: Lelley T, ed. Current topics in plant cytogenetics related to plant improvement. Proceedings of the International Symposium on Current Topics in Plant Cytogenetics Related to Plant Improvement, Tulln, Austria, 21–22 Feb. 1997. Tulln: Institute for Agrobiotechnology, 290–296. [Google Scholar]
- Greilhuber J, Obermayer R. 1998. Genome size variation in Cajanus cajan (Fabaceae): a reconsideration. Plant Systematics and Evolution 212: 135–141. [Google Scholar]
- Greilhuber J, Temsch EM. 2001. Feulgen densitometry: some observations relevant to best practice in quantitative nuclear DNA content determination. Acta Botanica Croatica 60: 285–298. [Google Scholar]
- Helander KG. 1994. Kinetic studies of fomaldehyde binding in tissues. Biotechnic and Histochemistry 69: 177–179. [DOI] [PubMed] [Google Scholar]
- Innocenti AM, Bitonti MB. 1983. Different duration of the mitotic cycle in seedlings from brown and black caryopses of Haynaldia villosa Schur. Caryologia 36: 27–32. [Google Scholar]
- Laurie DA, Bennett MD. 1985. Nuclear DNA content in the genera Zea and Sorghum Intergeneric, interspecific and intraspecific variation. Heredity 55: 307–313. [Google Scholar]
- Noirot M, Barre P, Duperray C, Hamon S, De Kochko A. 2005. Investigation on the origins of stoichiometric error in genome size estimation using heat experiments. Consequences on data interpretation. Annals of Botany 95: 111–118. [DOI] [PMC free article] [PubMed] [Google Scholar]
- Noirot M, Barre P, Louarn J, Duperray C, Hamon S. 2000. Nucleus-cytosol interactions—a source of stoichiometric error in flow cytometric estimation of nuclear DNA content in plants. Annals of Botany 86: 309–316. [Google Scholar]
- Obermayer R, Greilhuber J. 1999. Genome size in Chinese soybean accessions – stable or variable? Annals of Botany 84: 259–262. [Google Scholar]
- Ohri D, Jha SS, Kumar S. 1994. Variability in nuclear DNA content within pigeonpea, Cajanus cajan (Fabaceae). Plant Systematics and Evolution 189: 211–216. [Google Scholar]
- Ohri D, Singh SP. 2002. Karyotypic and genome size variation in Cajanus cajan (L.) Millsp. (pigeonpea) and some wild relatives. Genetic Resources and Crop Evolution 49: 1–10. [Google Scholar]
- Price HJ, Bachmann K. 1976. Mitotic cycle time and DNA content in annual and perennial Microseridinae (Compositae, Cichoriaceae). Plant Systematics and Evolution 126: 323–330. [Google Scholar]
- Price HJ, Hodnett G, Johnston JS. 2000. Sunflower (Helianthus annuus) leaves contain compounds that reduce nuclear propidium iodide fluorescence. Annals of Botany 86: 929–934. [Google Scholar]
- Rayburn AL, Biradar DP, Bullock DG, Nelson RL, Gourmet C, Wetzel JB. 1997. Nuclear DNA content diversity in Chinese soybean introductions. Annals of Botany 80: 321–325. [Google Scholar]
- Rayburn AL, Price HJ, Smith JD, Gold JR. 1985. C-band heterochromatin and DNA content in Zea mays American Journal of Botany 72: 1610–1617. [Google Scholar]
- Sharma AK, Sharma A. 1972.Chromosome techniques. Theory and practice, 2nd edn. London: Butterworths. [Google Scholar]
- Sharma AK, Sharma A. 1980.Chromosome techniques. Theory and practice. 3rd edn. London: Butterworths. [Google Scholar]
- Singh KP, Raina SN, Singh AK. 1996. Variation in chromosomal DNA associated with the evolution of Arachis species. Genome 39: 890–897. [DOI] [PubMed] [Google Scholar]
- Stalker HT, Dhesi JS, Kochert G. 1995. Genetic diversity within the species Arachis duranensis Krapov. & W.C. Gregory, a progenitor of cultivated peanut. Genome 38: 1201–1212. [DOI] [PubMed] [Google Scholar]
- Stalker HT, Ferguson ME, Valls JFM, Pittman RN, Simpson CE, Bramel-Cox P. 2003. Catalog of Arachis germplasm collection. http://www.icrisat.org/text/research/grep/homepage/groundnut/arachis/start.htm (accessed 25 Nov. 2003). [Google Scholar]
- Swift HH. 1950. The desoxyribose nucleic acid content of animal nuclei. Physiological Zoology 23: 169–198. [DOI] [PubMed] [Google Scholar]
- Temsch EM, Greilhuber J. 2000. Genome size variation in Arachis hypogaea and A. monticola re-evaluated. Genome 43: 449–451. [PubMed] [Google Scholar]
- Temsch EM, Greilhuber J. 2001. Genome size in Arachis duranensis: a critical study. Genome 44: 826–830. [PubMed] [Google Scholar]
- Vilhar B, Greilhuber J, Dolenc Koce J, Temsch EM, Dermastia M. 2001. Plant genome size measurement with DNA image cytometry. Annals of Botany 87: 719–728. [Google Scholar]
- Voglmayr H, Greilhuber J. 1998. Genome size determination in Peronosporales (Oomycota) by Feulgen image analysis. Fungal Genetics and Biology 25: 181–195. [DOI] [PubMed] [Google Scholar]