Abstract
• Background and Aims In microdensitometry and flow cytometry, estimation of nuclear DNA content in a sample requires a standard with a known nuclear DNA content. It is assumed that dye accessibility to DNA is the same in the sample and standard nuclei. Stoichiometric error arises when dye accessibility is not proportional between the sample and standard. The aim of the present study was to compare the effects of standardization (external–internal) on nuclear fluorescence of two Coffea species and petunia when temperature increases, and the consequences on genome size estimation.
• Methods Two coffee tree taxa, C. liberica subsp dewevrei (DEW) and C. pseudozanguebarieae (PSE), and Petunia hybrida were grown in a glasshouse in Montpellier, France. Nuclei were extracted by leaf chopping and at least 2 h after nuclei extraction they were stained with propidium iodide for approx. 3 min just before cytometer processing. In the first experiment, effects of heat treatment were observed in mixed (DEW + petunia) and unmixed extracts (petunia and DEW in separate extracts). Nine temperature treatments were carried out (21, 45, 55, 60, 65, 70, 75, 80 and 85 °C). In a second experiment, effects of heating on within-species genome size variations were investigated in DEW and PSE. Two temperatures (21 and 70 °C) were selected as representative of the maximal range of chromatin decondensation.
• Key Results and Conclusions In coffee trees, sample and standard nuclei reacted differently to temperature according to the type of standardization (pseudo-internal vs. external). Cytosolic compounds released in the filtrate would modify chromatin sensitivity to decondensation. Consequently, the ‘genome size’ estimate depended on the temperature. Similarly, intraspecific variations in genome size changed between estimations at 21 °C and 70 °C. Consequences are discussed and stoichiometric error detection methods are proposed, along with proposals for minimizing them.
Keywords: Flow cytometry, genome size, stoichiometric error, phenols, intraspecific variation
INTRODUCTION
In microdensitometry and flow cytometry, estimation of nuclear DNA content in a sample requires a control, i.e. a standard, with a known nuclear DNA content. Current methods involve two steps: (1) staining of nuclear DNA in the sample and standard in the same conditions; and (2) comparison of staining intensities. Nuclear DNA content is then estimated by DNAstd × ysmp/ystd, where DNAstd is the known nuclear DNA content of the standard, and ysmp and ystd are the staining intensities in the sample and standard nuclei, respectively. One basic assumption underlies this estimation: dye accessibility to DNA is the same in the sample and standard nuclei. Unfortunately, this is often invalid in plants and leads to stoichiometric errors.
Dye accessibility to DNA increases with dye concentration. Theoretically, this increase should be proportional in both the standard and target, leading to a constant fluorescence ratio irrespective of the dye concentration. This is not always the case with mithramycine (Galbraith et al., 1983) or propidium iodide (PI) (Barre et al., 1996). In the latter case, dye accessibility is lower in Petunia hybrida than in Coffea liberica subsp. dewevrei (DEW) when PI concentrations are <150 µg mL−1. Consequently, the fluorescence ratio is higher at low PI concentration (330 µg mL−1). This explains why saturating concentrations are used in practice to stabilize DNA content estimations. This also shows that PI access to DNA differs between petunia and coffee trees, thus suggesting a variation in chromatin and DNA packaging within nuclei.
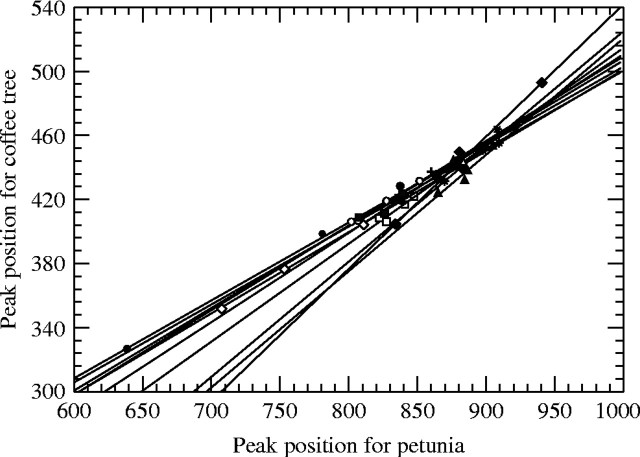
Dye accessibility to DNA is modified by some cell-bound compounds that are released in the filtrate during chopping. For example, caffeoylquinic acid and caffeine, two compounds present in coffee trees, act on dye accessibility (Noirot et al., 2003). The first one, a phenolic compound, shares common chemical properties with tannins, which are known to complex with proteins and modify chromatin dye access (Greilhuber, 1988). In contrast, caffeine binds with phenols and tannins (Payen, 1846; Rabéchault, 1954), thus neutralizing these effects (Noirot et al., 2003). Theoretically, when the basic assumption is valid, the DEW nuclear fluorescence should be strictly proportional to the petunia nuclear fluorescence regardless of the phenol or caffeine concentration in the filtrate. The basic assumption is refuted only when the effects of caffeine and phenols on dye accessibility differ between petunia and DEW, i.e. when the regressions between sample and standard fluorescences differed in terms of their slopes and did not go through the origin (Fig. 1). The fact that a straight line did not intersect the origin clearly showed that the DEW cytosol effect on nuclei fluorescence differed between DEW and petunia. In addition, the slope differences highlighted differential effects of DEW cytosol on both nuclei depending on the DEW tree (Noirot et al., 2002). In Fig. 1, the relationship between DEW and petunia nuclear fluorescence intensity changes between accessions from ysmp = 0·49ystd + 16 to ysmp = 0·83ystd – 283 and this indicates that the basic assumption, validated in some accessions (EB51, EB62, EB57, EB64), is refuted in others (EB55, EB65, EB67) (Noirot et al., 2002). When the basic assumption is refuted, any within-species variation in phenol and caffeine contents should lead to pseudo-intraspecific variations in genome size.
Fig. 1.
Within-tree relationships comparing the petunia peak location and the coffee peak location. Each symbol represents one tree (from Noirot et al. 2002).
Several experiments using heating were carried out to gain insights into the effects of cytosol compounds on dye accessibility. Our aim was to compare the effects of standardization (external–internal) on DEW and petunia nuclear fluorescence at different temperatures and the resulting consequences on genome size estimations. The effects of temperature on dye accessibility have been effectively investigated using acridine orange (Darzynkiewicz et al., 1975). Acridine orange is particularly useful since it generates two types of fluorescence (green and orange), thus facilitating characterization of double- and single-stranded DNA, i.e. to distinguish between heating effects on chromatin decondensation and DNA denaturation. PI, which is an intercalating dye commonly used for estimating nuclear DNA content, is not as informative as acridine orange. Nevertheless, an increase in dye accessibility is expected up to about 60–70 °C, followed by a decrease in dye accessibility due to DNA denaturation at a higher temperature.
MATERIALS AND METHODS
Plant material
The two coffee tree taxa C. liberica subsp. dewevrei (DEW) and C. pseudozanguebarieae (PSE), and the standard Petunia hybrida [2C = 2·85 pg (Marie and Brown, 1993)] were grown in a glasshouse in Montpellier, France under tropical climate conditions (24 °C during the day, 18 °C at night, 70 % relative humidity).
Sample preparation
Nuclei were extracted by leaf chopping (Galbraith et al., 1983) in the lysis buffer of Doležel et al. (1989), slightly modified (0·5 % Triton X-100 and pH 8). The addition of mercaptoethanol in the buffer avoided polyphenol oxidation. Leaf samples (4 cm2) were chopped for about 30 s in a Petri dish containing 2 mL of lysis buffer. Several preparations were pooled when a large volume of filtrate was required for a homogeneous experiment. The solution was filtered through nylon cloth (50 µm mesh size). DNase-free RNase A, i.e. 5 units mL−1 of nuclear suspension (Boehringer Mannheim), was added to the filtrate for an incubation period of at least 2 h. The 2-h incubation period was necessary for nuclei cleaning by Triton to obtain clearer peaks. This also stabilized the effects of cytosol compounds on nuclear fluorescence. This extraction method gave high nuclear fluorescence stability, i.e. <2 % variation after 6 h.
Staining of nuclei
Nuclei were stained with PI [95–98 % (TLC) Sigma #P 4170]. The optimal PI concentration for staining was 333 µg mL−1, and the staining time was approx. 3 min just before cytometer processing (Barre et al., 1996).
Cytometer set-up
A FACScan cytometer (Becton Dickinson) with an argon laser (15 mW) at 488 nm with a pulse area of emissions >590 nm was used. The amplifier system was set at constant voltage (557 V) and constant gain. The zero offset of the analogue-to-digital converter was checked with nuclei from Petunia hybrida (Barre et al., 1996).
Experimental designs and statistical methods
Temperature-standardization interaction
Two large extracts were obtained separately: one for petunia and one for DEW (accession no. EB65). Half of each extract was mixed just after their filtration, leading to pseudo-internal standardization (Noirot et al., 2000). In this treatment, petunia nuclei were in contact for at least 2 h with some compounds present in the DEW cytosol and, reciprocally, DEW nuclei were in contact with some compounds released from the petunia cytosol. Each remaining half extract was used for external standardization treatment. In this case, petunia nuclei could not be affected by coffee cytosol compounds nor could DEW nuclei be altered by petunia cytosol compounds.
Effects of heat treatment on chromatin decondensation and DNA denaturation were observed in mixed (DEW + petunia) and unmixed extracts (petunia and DEW in separate extracts). Nine temperature treatments were carried out (21, 45, 55, 60, 65, 70, 75, 80 and 85 °C). Two replicates (0·3 mL each) were used for each ‘extract × temperature’ combination. All samples (except the 21 °C treatment) were heated for 5 min in a water bath at the required temperature. PI was added at the end of the heating time and the sample was immediately transferred onto ice.
Temperature treatments were carried out in random order. For each temperature treatment, the six samples (two replicates × three extracts) were heated together, but examined in random order.
Nuclear fluorescence was estimated in DEW (CNF) and petunia (PNF). These two variables allowed the fluorescence ratio (NFR = CNF/PNF) to be computed. Statistical analysis was performed using a two way-ANOVA with fixed effects.
Chromatin decondensation and within-species variations in genome size
This experiment was carried out to investigate the effects of chromatin decondensation on within-species variations in genome size in two species, C. liberica subsp. dewevrei and C. pseudozanguebariae. Each species was represented by two trees (EB65 and EB62 in DEW; H58 and H61 in PSE). While there is a difference in genome size between EB65 and EB62, it is similar between H58 and H61 (Barre et al., 1996). Eight extracts were obtained for each tree using true internal standardization (petunia as standard).
Two temperatures (21 °C and 70 °C) were selected as representative of the maximal range of chromatin decondensation. There were five replicates for each ‘temperature × tree’ combination. For the 70 °C treatment, samples were heated for 5 min in a water bath at 70 °C. PI was added at the end of the heating time and the sample was immediately transferred onto ice. All samples were examined in random order.
Four variables were recorded: coffee nuclear fluorescence (CNF), petunia nuclear fluorescence (PNF), coffee nuclear diameter (CND), and petunia nuclear diameter (PND), and the fluorescence ratio (NFR = CNF/PNF) was also computed. Fluorescence and diameter are expressed in channel units on FL2-A and FL2-W, respectively. A two way-ANOVA with fixed factors was carried out independently for each species.
All results were analysed using the Statistica software package (5.1 version, 1997 for Microsoft Windows).
RESULTS AND DISCUSSION
General effects of temperature
As soon as chromatin decondensation began, i.e. over 45 °C, the nuclear diameters increased as a direct effect of chromatin depackaging. This effect markedly increased over 70 °C when DNA denaturation occurred. The main consequence was substantial nuclear destruction when their volume exceeded a threshold. Consequently, at 80 and 85 °C, fluorescence concerned only surviving nuclei, which were probably more resistant.
The second effect of heating concerned the peak CV, which increased, especially over 70 °C. The CV increase affected both the nuclear diameter and fluorescence. All nuclei of the peak were not in the same state of chromatin decondensation and/or DNA denaturation. This remark is also valid at 21 °C.
The two processes (chromatin decondensation and DNA denaturation) partly overlapped. At a given location, chromatin decondensation always preceded DNA denaturation, but these phenomena did not affect the entire genome homogeneously, and DNA denaturation began before all the chromatin was decondensed.
Otherwise, the residual variance in the NFR ratio was greater in external conditions. This was mainly due to the fact that the variance of the ratio between two independent variables was higher than between two dependent ones. This statistical feature explains why internal standardization was more accurate than external standardization.
Effects of temperature and the mode of standardization on genome size evaluation
Variations in petunia nuclear fluorescence
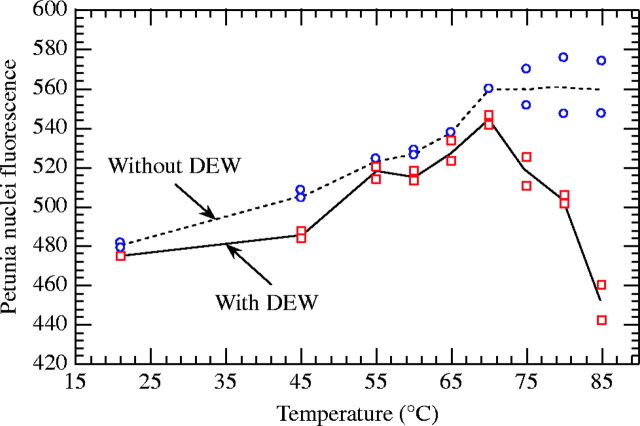
The effects of heating on petunia nuclear fluorescence (PNF) were highly significant (F8,18 = 26·0; P < 0·0001). In pseudo-internal standardization, PNF increased sharply from 21 °C to reach a peak at 70 °C and the accessibility gain was about 14 % (Fig. 2). From 70 to 85 °C, PI binding decreased linearly to reach 5 % under the accessibility level at 21 °C. Nevertheless, this effect depended on the mode of standardization (interaction: F8,18 = 15·3; P < 0·0001).
Fig. 2.
Effects of temperature on petunia nuclear fluorescence in external standardization [without Coffea liberica subsp. dewevrei (DEW)] and pseudo-internal standardization (with DEW). Fluorescence is expressed in channel units and was recorded using propidium iodide.
Irrespective of the temperature, the absence of DEW cytosol compounds in the petunia filtrate increased PNF. DEW cytosol compounds delayed chromatin decondensation (45 °C) and accelerated DNA denaturation (>70 °C) in petunia nuclei. The measurements concerned only resistant nuclei in the latter case. Consequently, the absence of DNA denaturation in petunia nuclei when using external standardization could reflect concomitant nuclear destruction and DNA denaturation.
Effects of temperature on C. liberica subsp. dewevrei nuclear fluorescence
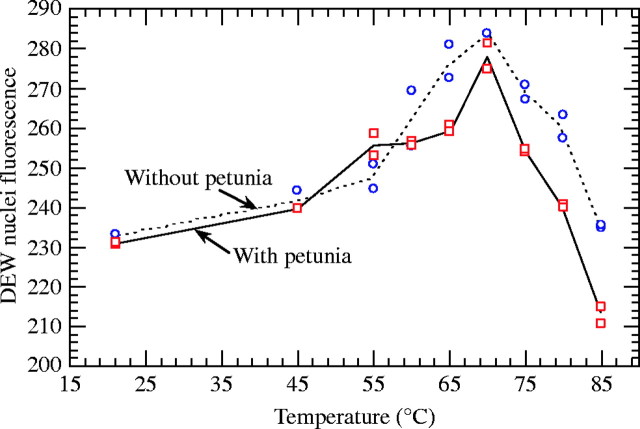
As for petunia, temperature had an effect on nuclear fluorescence (F8,18 = 96·0; P < 0·0001). In pseudo-internal standardization, coffee nuclear fluorescence (CNF) also increased sharply from 45 to 70 °C (Fig. 3) with an accessibility gain (22 %) higher than that observed in petunia. Two hypotheses could be put forward: (1) chromatin is more condensed in DEW nuclei than in petunia nuclei at room temperature; or (2) chromatin in DEW nuclei is structurally more sensitive to temperature. From 70 to 85 °C, PI binding decreased linearly to reach 9 % under the 21 °C fluorescence level.
Fig. 3.
Effects of temperature on Coffea liberica subsp. dewevrei (DEW) nuclear fluorescence in external standardization (without petunia) and pseudo-internal standardization (with petunia) Fluorescence is expressed in channel units and was recorded using propidium iodide.
The effects of temperature varied between pseudo-internal and external standardizations (F8,18 = 7·43; P = 0·0002). From 21 to 60 °C, the mode of standardization did not influence the DEW nuclear response to heating, i.e. the temperature effect on DEW chromatin decondensation was not modified by the presence or absence of petunia cytosol compounds. Above 60 °C, the presence of petunia cytosol compounds mainly affected DNA denaturation: by (a) delayed maximum fluorescence (70 °C vs. 65 °C), and (b) a greater fluorescence decrease. Importantly, DEW nuclei showed a greater fluorescence decrease, regardless of the mode of standardization, compared with the petunia nuclear response.
Effects of temperature on the nuclear fluorescence ratio (NFR)
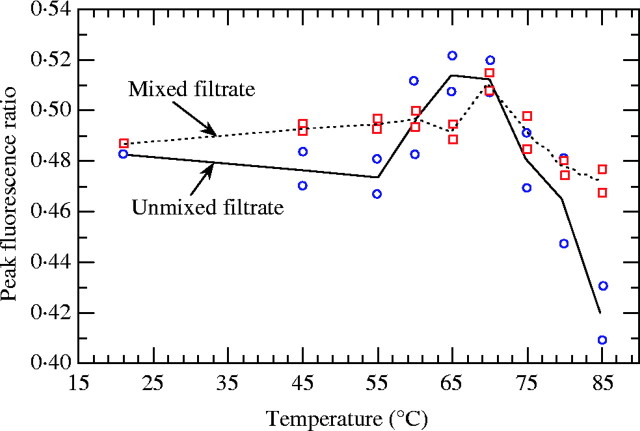
Temperature affected the NFR ratio (F8,18 = 12·7; P < 0·0001). In pseudo-internal standardization, the ratio was statistically constant from 21 to 65 °C (NFR = 0·493 on average). A significant 5 % gain was recorded at 70 °C, followed by a 7·6 % loss from 70 to 85 °C (Fig. 4). As expected, the different effects of temperature on chromatin decondensation and DNA denaturation of DEW and petunia nuclei led to NFR variations. As the ratio was proportional to the genome size, a question arises concerning the optimum temperature for DEW genome size estimation. In other words, what is the chromatin decondensation level at which the dye accessibility rate is similar between DEW and petunia?
Fig. 4.
Effects of temperature on the peak fluorescence ratio in external standardization (unmixed filtrate) and pseudo-internal standardization (mixed filtrate).
The effects of temperature on NFR depended on the mode of standardization (F8,18 = 3·58; P = 0·012) (Fig. 4). This was expected considering the behavioural difference in DEW and petunia nuclei. Compounds present in the filtrate modify the chromatin decondensation and DNA denaturation processes. As the medium composition changed between pseudo-internal and external standardization, what is the best ‘medium × temperature’ combination at which the PI accessibility rate would be similar for DEW and petunia?
In pseudo-internal standardization, there was a strong linear relationship between DEW nuclear fluorescence and petunia nuclear fluorescence (Fig. 5A). Nevertheless, the proportionality was not completely respected, thus explaining the stoichiometric error. The situation worsened in external standardization conditions (Fig. 5B). Up to 70 °C, the relationship oscillated more around the regression line computed in Fig. 5A. Over 70 °C, the DEW nuclear fluorescence became independent from that of petunia. Moreover, the between-replicate variance was substantially increased in petunia. This confirms the importance of using the same medium for both nuclei, although this does not eliminate all stoichiometric errors.
Fig. 5.
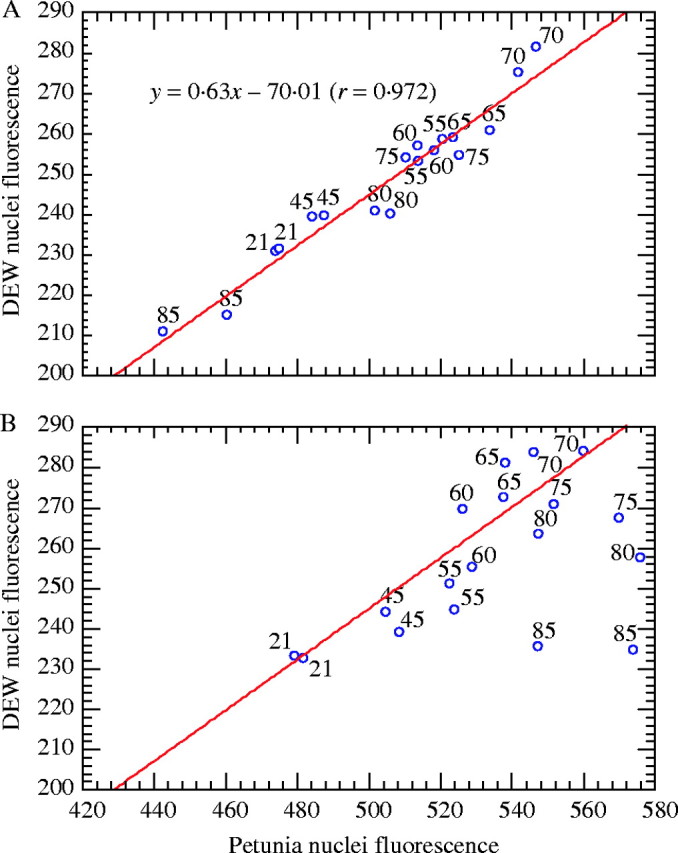
Effects of temperature (21–85 °C; see numbers on the points) on the relationship between Coffea liberica subsp. dewevrei (DEW) and petunia nuclear fluorescence in (A) pseudo-internal standardization conditions; and (B) external standardization conditions. The regression line computed in (A) is also reproduced in (B). Note that the scales are identical in (A) and (B) to highlight differences.
Another consequence of this experiment was the choice of 70 °C as the key temperature for the next experiment.
Effects of chromatin decondensation on within-species variation in genome size
In C. liberica subsp. dewevrei
At 21 °C, NFR differed significantly between EB62 and EB65 (Tables 1 and 2). As genome size (2C) is directly proportional to NFR (2C = 2·85NFR), new evaluations, i.e. 1·385 pg and 1·439 pg for EB65 and EB 62, respectively, confirmed previous results (Barre et al., 1996). The between-tree difference was due to coffee nuclear fluorescence (CNF) variations, but especially to petunia nuclear fluorescence (PNF) variations (Tables 1 and 2). The effects of coffee cytosolic compounds on PNF and the consequences on within-species variations in genome size were also confirmed (Barre et al., 1998). By contrast, the results of investigations concerning coffee nuclear diameter (CND) and petunia nuclear diameter (PND) were original. Significant between-tree differences were recorded for CND, but not for PND (Tables 1 and 2). The nuclear diameter was 3·2 % higher in EB62 than in EB65.
Table 1.
Effects of heating on chromatin decondensation in Coffea liberica subsp. dewevrei nuclear fluorescence (CNF), petunia nuclear fluorescence (PNF), nuclear fluorescence ratio (NFR), coffee nuclear diameter (CND) and petunia nuclear diameter (PND) (ANOVA results)
| Tree |
Temperature |
Interaction |
|||||||
|---|---|---|---|---|---|---|---|---|---|
|
F1,16 |
P |
F1,16 |
P |
F1,16 |
P |
||||
| CNF | 25·8 | 0·0001 | 1389 | <0·0001 | 42·5 | <0·0001 | |||
| PNF | 107 | <0·0001 | 1646 | <0·0001 | 27·7 | <0·0001 | |||
| NFR | 30·1 | <0·0001 | 88·4 | <0·0001 | 18·9 | 0·0005 | |||
| CND | 7·14 | 0·017 | 569 | <0·0001 | 43·5 | <0·0001 | |||
| PND | 17·9 | 0·0014 | 370 | <0·0001 | 29·3 | <0·0001 | |||
Fluorescence and diameter are expressed in channel units and recorded using propidium iodide as dye.
Table 2.
Effects of heating on chromatin decondensation in Coffea liberica subsp. dewevrei nuclear fluorescence (CNF), petunia nuclear fluorescence (PNF), nuclear fluorescence ratio (NFR), coffee nuclear diameter (CND) and petunia nuclear diameter (PND)
| Tree EB 65 |
Tree EB62 |
|||||
|---|---|---|---|---|---|---|
| 21 °C |
70 °C |
21 °C |
70 °C |
|||
| CNF | 303·3a | 399·0c | 306·4a | 373·6b | ||
| PNF | 624·2b | 779·0d | 607·1a | 726·4c | ||
| NFR | 0·486a | 0·512c | 0·505b | 0·514c | ||
| CND | 161·4a | 201·8d | 166·6b | 189·5c | ||
| PND | 194·9a | 228·6c | 197·1a | 215·9b | ||
Fluorescence and diameter are expressed in channel units and recorded using propidium iodide as dye.
Numbers with different letters are significantly different (P < 0·05) according to Newman and Keuls test results.
The effects of temperature were highly significant for all traits (Table 1). Moreover, the effect changed between DEW trees (presence of an interaction). At 70 °C, the difference in genome size between EB65 and EB62 disappeared and a common genome size was estimated (2C = 1·462 pg). The gain due to temperature was 5·3 % and 1·8 % in EB65 and EB62, respectively. Nevertheless, there are no arguments to confirm that the evaluation at 70 °C was better than that at 21 °C, when it was considered that the interaction also affected PNF. The accessibility gain due to chromatin decondensation was 31·7 % and 21·9 % for CNF in EB65 and EB62, respectively, and 24·8 % and 19·7 % for PNF, respectively. The relative CND increase was about two-fold lower in EB62 (13·7 %) than in EB65 (25 %). Similar results were obtained for PND (17·3 % and 9·5 % in EB65 and EB62, respectively). In all cases, the effect of temperature on nuclear diameter was 44 % higher in coffee trees than in petunia.
To summarize, this experiment confirmed that within-species variations in genome size estimation were due to some nuclear/medium interactions and could be classified as stoichiometric error (Greilhuber, 1986, 1988; Noirot et al., 2000). Moreover, it showed that within-species variations can be modified by temperature and even disappear. Nevertheless, as genome size estimation varied with temperature due to differences in chromatin decondensation in petunia and coffee nuclei, the best temperature for DEW genome size estimation with the lowest bias cannot be defined.
In C. pseudozanguebariae
At 21 °C, NFR did not differ between H58 and H61 (Tables 3 and 4), thus confirming previous results, and their common genome size (2C = 1·131 pg) was also confirmed (Barre et al., 1996). The absence of significant differences between H58 and H61 extracts also concerned CND and PND. The two trees differed significantly with respect to their CNF and PNF (Table 4). The basic assumption (CNF varies proportionally with PNF) was thus validated and explained the absence of stoichiometric error. Cytosol compounds would act similarly on CNF and PNF.
Table 3.
Effects of heating on chromatin decondensation in Coffea pseudozanguebariae nuclear fluorescence (CNF), petunia nuclear fluorescence (PNF), nuclear fluorescence ratio (NFR), coffee nuclear diameter (CND) and petunia nuclear diameter (PND) (ANOVA results)
| Tree |
Temperature |
Interaction |
|||||||
|---|---|---|---|---|---|---|---|---|---|
|
F1,16 |
P |
F1,16 |
P |
F1,16 |
P |
||||
| CNF | 6·66 | 0·020 | 201 | <0·0001 | 0·54 | 0·47 | |||
| PNF | 73·2 | <0·0001 | 667 | <0·0001 | 3·96 | 0·064 | |||
| NFR | 11·9 | 0·0033 | 0·15 | 0·71 | 7·65 | 0·014 | |||
| CND | 12·9 | 0·0024 | 62·0 | <0·0001 | 1·98 | 0·18 | |||
| PND | 5·46 | 0·033 | 75·1 | <0·0001 | 1·72 | 0·21 | |||
Fluorescence and diameter are expressed in channel units and recorded using propidium iodide as dye.
Table 4.
Effects of heating on chromatin decondensation in Coffea pseudozanguebariae nuclear fluorescence (CNF), petunia nuclear fluorescence (PNF), nuclear fluorescence ratio (NFR), coffee nuclear diameter (CND) and petunia nuclear diameter (PND). Fluorescence and diameter are expressed in channel units and recorded using propidium iodide as dye
| Tree H58 |
Tree H61 |
|||||
|---|---|---|---|---|---|---|
| 21 °C |
70 °C |
21 °C |
70 °C |
|||
| CNF | 268·3b | 309·7c | 258·1a | 304·1c | ||
| PNF | 676·8b | 797·9d | 648·2a | 752·0c | ||
| NFR | 0·396b | 0·388a | 0·398b | 0·404b | ||
| CND | 161·3a | 192·0c | 154·0a | 175·4b | ||
| PND | 199·1a | 223·6c | 196·6a | 214·6b | ||
Numbers with different letters are significantly different (P < 0·05) according to Newman and Keuls test results.
For all traits but NFR, temperature had a highly significant effect without interaction (Table 3). For NFR, the ‘tree × temperature’ interaction was significant. Indeed, genome size, which was similar between H58 and H61 at 21 °C, became different at 70 °C. More surprisingly, NFR variations were −2·1 % in H58 and +1·5 % in H61. In fact, CNF was similar between trees at 70 °C, whereas PNF was 6·1 % higher in H58 extracts. Again, differences in the reaction of petunia nuclei were responsible for the difference in genome size between trees within species. Lastly, the temperature effects were about 17 % higher for CNF, PNF and CND on average. It was only 11 % higher for PND. Consequently, the effect of temperature on nuclear diameter was 54 % higher in coffee than in petunia.
To summarize, this experiment showed that there is no within-species variation at 21 °C but it can appear at 70 °C. The presence of stoichiometric error depends on the temperature and all types of situations can arise.
CONCLUSIONS AND PROSPECTS
Temperature treatments were used to find a temperature for which chromatin decondensation was similar between petunia and coffee tree. The basic assumption of genome size evaluation by flow cytometry would be confirmed at this temperature, whereas it was refuted at 21 °C. Unfortunately, current results clearly show that this aim was not reached. On the contrary, the situation was more ambiguous than before as C. pseudozanguebariae showed an absence of within species variation at 21 °C but a presence at 70 °C.
Nevertheless, everything was not negative and four points could be highlighted from a scientific standpoint: (1) the relationship between intraspecific variations in genome size estimation and stoichiometric error due to cytosol compounds was confirmed; (2) the analytic origin of the stoichiometric error—non-confirmation of the basic assumption—was also emphasized; (3) the choice of internal vs. external standardization, as recommended by several authors (Vindelov et al., 1983; Tiersch et al., 1989; Doležel, 1991), was confirmed; and (4) a different response to heat treatment when comparing petunia and coffee tree nuclei was also noted.
Consequences of interpretations
The main consequence of stoichiometric error concerns interpretation of the within-species variation in genome size estimation when related to environmental variation. The case of Helianthus annuus is a good example. Indeed, within-species genome size variations have been documented and related first to environmental factors (Johnston et al., 1996; Price et al., 1998). Subsequently, within-species variations of genome size were related to the presence in Helianthus leaves of a compound that decreases nuclear fluorescence of the standard and target (Price et al., 2000). The same situation exists for coffee trees (Noirot et al., 2000), where chlorogenic acids (CGA) have a negative effect on nuclear fluorescence (Noirot et al., 2003). As the CGA content, also present in sunflower (Cohen and Ibrahim, 1975; Koeppe et al., 1976), is known to be environment-dependent, this could also explain environmental variations in genome size estimations in sunflower. More importantly, CGA belongs to the large family of phenols, including tannins which are also implicated in stoichiometric error when using microdensitometry (Greilhuber, 1988). Consequently, all within-species variations in genome size estimation in phenol-rich species, i.e. showing rapid browning of extracts without antioxidant, must be carefully interpreted. Even when the plants are in the same environment, the polymorphism of the regulatory genes of the phenylpropanoid pathways can lead to pseudo-genome size variations. Quantitative trait loci that account for ‘genome size variations’ could reflect the polymorphism of enzymes or transcriptional factors of this pathway. In the same manner, natural selection in different environments could lead to populations with differences in phenol contents, and pseudo-variations in genome size. All of these aspects of the problem clearly show that particular care has to be taken when interpreting within-species genome size variations. This recommendation can also be extended to between-species variations, when genome size differences are low and phenol content variations are large.
Three proposals for stoichiometric error detection
As stressed here, the presence of phenol content variations is a required, but not sufficient, condition to observe stoichiometric error. Indeed, bias appears only if the standard and target do not react similarly to phenols. In some DEW trees, variations in nuclear fluorescence are proportional between petunia and coffee tree, while in other accessions, the basic assumption is refuted. Three proposals could be put forward to check whether genome size variations are due to stoichiometric error. The first one is to test different standards; the second is to compare internal and external standardization; while the third is to perform a regression analysis between target and standard nuclear fluorescences on several samples. The first two proposals tend to highlight the presence of compounds released by the target or standard in the filtrate and that act on nuclear fluorescence. The third proposal could be combined with the two previous ones and is ultimately the best proof of stoichiometric error. In all cases, several extracts have to be measured per target.
Three solutions to minimize stoichiometric error
There are three methods to minimize this error. The first one is to select the tissues and standard. If there are between-tissue variations in genome size, related to phenol content variations, the choice of the same tissue is recommended (Doležel and Bartos, 2005). Similarly, a comparison of bias between tissues would enable selection of the tissue that produces minimal bias. The same principle applies for the comparison of bias between several standards.
Theoretically, bias should disappear when standard and target nuclei share a medium without phenols. Slight nuclear centrifugation, followed by re-suspension in buffer (Otto, 1990; Doležel and Göhde, 1995), drastically reduces bias (Noirot et al., 2000), but does not eliminate it completely. This is due to the fact that (a) compounds and nuclei are in contact long enough during the chopping phase and (b) the subsequent centrifugation and suspension are not sufficient to remove the phenols by washing. Moreover, the method is time consuming, thus markedly reducing one of the main advantages of flow cytometry.
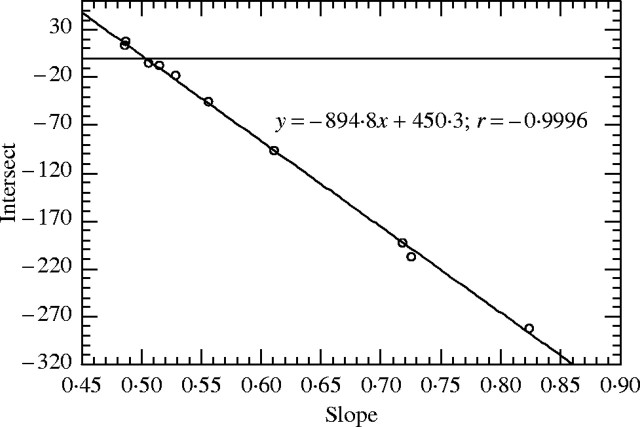
When the basic assumption is refuted, as in Fig. 1, a negative and linear relationship is expected between intercepts and slopes (Fig. 6). The equation can then be used to correct the bias. For example, the fitted equation y = −894·8x + 450·3 allows one to predict the fluorescence ratio without stoichiometric error (R-PI = 450·3/894·8 = 0·5032) (Noirot et al., 2002). Consequently, the nuclear DNA content of DEW was estimated as 2C = 1·434 pg using PI. Nevertheless, this is still theoretical, in practice all straight lines do not cross exactly at the same point and consequently a slight bias persists.
Fig. 6.
Relationship between slopes and intersects for within-tree linear regressions intersecting at one point (450·3; 894·8).
The absence of a perfect solution should not prompt scientists to drop genome size investigations using flow cytometry. If the required precision to highlight a result is lower than the bias, there is currently no issue. The problem arises when flow cytometry is used to sort addition lines in hybrids, while stoichiometric error is larger than the chromosome DNA content. By contrast, when estimating new species for their genome size, it is still better to have a slightly biased estimation than no estimation at all.
LITERATURE CITED
- Barre P, Noirot M, Louarn J, Duperray C, Hamon S. 1996. Reliable flow cytometric estimation of nuclear DNA content in coffee trees. Cytometry 24: 32–38. [DOI] [PubMed] [Google Scholar]
- Cohen Y, Ibrahim RK. 1975. Changes in phenolic compounds of sunflower infected by Plasmopara hastedii Canadian Journal of Botany 53: 2625–2630. [Google Scholar]
- Darzynkiewicz Z, Traganos F, Sharpless T, Melamed MR. 1975. Thermal denaturation of DNA in situ as studied by acridine orange staining and automated cytofluorometry. Experimental Cell Research 90: 411–428. [DOI] [PubMed] [Google Scholar]
- Doležel J. 1991. Flow cytometry analysis of nuclear DNA content in higher plants. Phytochemical Analysis 2: 143–154. [Google Scholar]
- Doležel J, Bartos J. 2005. Plant DNA flow cytometry and estimation of nuclear genome size. Annals of Botany 95: 99–110. [DOI] [PMC free article] [PubMed] [Google Scholar]
- Doležel J, Göhde W. 1995. Sex determination in dioecious plants Melandrium album and M. rubrum using high-resolution flow cytometry. Cytometry 19: 103–106. [DOI] [PubMed] [Google Scholar]
- Doležel J, Binarova P, Lucretti S. 1989. Analysis of nuclear DNA content in plant cells by flow cytometry. Biology Plantarum 31: 113–120. [Google Scholar]
- Galbraith DW, Harkins KR, Maddox JM, Ayres NM, Sharma DP, Firoozabady E. 1983. Rapid flow cytometric analysis of the cell cycle in intact plant tissues. Science 220: 1049–1051. [DOI] [PubMed] [Google Scholar]
- Greilhuber J. 1986. Severly distorted Feulgen-DNA amounts in Pinus (Coniferophytina) after nonadditive fixations as a result of meristematic self-tanning with vacuole contents. Canadian Journal of Genetics and Cytology 28: 409–415. [Google Scholar]
- Greilhuber J. 1988. ‘Self-tanning’—a new and important source of stoichiometric error in cytophotometric determination of nuclear DNA content in plants. Plant Systematics and Evolution 158: 87–96. [Google Scholar]
- Johnston JS, Jenson A, Czeschin DG, Price HJ. 1996. Environmentally induced nuclear 2C DNA content variation in Helianthus annuus. American Journal of Botany 83: 1113–1120. [Google Scholar]
- Koeppe DE, Southwick LM, Bittell JE. 1976. The relationship of tissue chlorogenic acid concentration and leaching of phenolics from sunflower grown under varying phosphate nutrient conditions Canadian Journal of Botany 54: 593–599. [Google Scholar]
- Marie D, Brown SC. 1993. A cytometric exercise in plant DNA histograms, with 2C values for 70 species. Biology of the Cell 78: 41–51. [DOI] [PubMed] [Google Scholar]
- Noirot M, Barre P, Duperray C, Louarn J, Hamon S. 2003. Effects of caffeine and chlorogenic acid on propidium iodide accessibility to DNA. Consequences on genome size evaluation in coffee tree. Annals of Botany 92: 259–264. [DOI] [PMC free article] [PubMed] [Google Scholar]
- Noirot M, Barre P, Louarn J, Duperray C, Hamon S. 2000. Nuclear-cytosol interactions—a source of stoichiometric error in flow cytometric estimation of nuclear DNA content in plants. Annals of Botany 86: 309–316. [Google Scholar]
- Noirot M, Barre P, Louarn J, Duperray C, Hamon S. 2002. Consequences of stoichiometric error for nuclear DNA content evaluation in Coffea liberica var. dewevrei using DAPI and propidium iodide. Annals of Botany 89: 385–389. [DOI] [PMC free article] [PubMed] [Google Scholar]
- Otto FJ. 1990. DAPI staining of fixed cells for high-resolution flow cytometry of nuclear DNA. In: Darzynkiewickz Z, Crissman HA, eds. Methods in cell biology, Vol. 33. San Diego: Academic Press, 105–110. [DOI] [PubMed] [Google Scholar]
- Payen A. 1846. Premier mémoire sur le café. Compte-Rendus de l'Académie des Sciences (Paris) 22: 724–737. [Google Scholar]
- Price H, Hodnett G, Johnston JS. 2000. Sunflower (Helianthus annuus) leaves contain compounds that reduce nuclear propidium iodide fluorescence. Annals of Botany 86: 929–934. [Google Scholar]
- Price HJ, Morgan PW, Johnston JS. 1998. Environmentally correlated variation in 2C nuclear DNA content measurements in Helianthus annuus L. Annals of Botany 82: 95–98. [Google Scholar]
- Rabéchault H. 1954. Tanins et complexes tanniques chez les caféiers. In: Jacques-Félix, ed. Contributions à l'étude du caféier en Côte-d'Ivoire. Paris: Imprimerie Jouve, 181–219. [Google Scholar]
- Tiersch TR, Chandler RW, Wachtel SS, Elias S. 1989. Reference standards for flow cytometry and application in comparative studies of nuclear DNA content. Cytometry 10: 706–710. [DOI] [PubMed] [Google Scholar]
- Vindelov LL, Christensen IJ, Nissen NI. 1983. Standardization of high-resolution flow cytometric DNA analysis by the simultaneous use of chicken and trout red blood cells as internal reference standards. Cytometry 3: 328–331. [DOI] [PubMed] [Google Scholar]


