Abstract
• Aims To examine what possible role intraspecific DNA C-value variation may play in plant taxonomy.
• Scope Although many of the original examples of intraspecific C-value variation have been shown to be the result of experimental variation, new examples using the appropriate standards and controls continue to be published. The evidence that intraspecific C-value variation alters phenotypes can be equivocal, and detailed studies are needed to clarify any possible relationship. However, populations within species have been shown to have varying DNA amounts that can be correlated with eco-geographic variables, suggesting that the variation is adaptive and that these may be examples of incipient speciation.
• Conclusions Where intraspecific C-value variation appears most significant for taxonomy is as an indicator of taxonomic heterogeneity, pointing to the need for a re-evaluation of the delimitation of the species in question. There is also the need to test whether intraspecific C-value variants produce fertile F1 hybrids or not, as this would be a good indication of whether they belong in the same biological species.
Keywords: DNA C-value, intraspecific variation, C-value and phenotype, C-value and adaptation, intraspecific C-value variation and taxonomy
INTRODUCTION
Although it is commonly stated or implied that taxonomic delimitation should be based on evolutionary relationships (Futuyma, 1998; Judd et al., 1999; Singh, 1999) it remains true that most taxonomic decisions are based on morphological discontinuities that can be readily distinguished (see, for example, Perrie et al., 2003). It is recognized that variation in morphology exists but, as there is a requirement to choose a type specimen as a reference for identifying other items as conspecific, a typological species concept is applied. At the same time there is the recognition that species need to be considered as biological entities that are cohesive (potentially capable of interbreeding) and produce offspring that resemble the parents—ideas encapsulated in the biological species concept as put forward by Mayr (1940, 1963). Where then does intraspecific DNA C-value variation fit in? Does it contribute to morphological differentiation of individuals or populations? Are populations with different C-values adapted to different niches and could this lead to population differentiation and ultimately to species formation?
One major problem that arises when reviewing this topic is that many of the examples of intraspecific C-value variation have been shown to be artefacts of the measurement methods. One of the earliest papers to highlight this problem is that of Teoh and Rees (1976) who showed that intraspecific C-value variation in two gymnosperms was negligible, contrary to several previous reports (Miksche, 1971; Dhir and Miksche, 1974), and previous ‘variation’ could be reconciled by a failure to account for environmental and experimental variables. This work was extended by Greilhuber (1986, 1988), who demonstrated that phenolic compounds in plants interfere with the Feulgen reaction, on which most C-value measurements were then based. He introduced the term ‘self-tanning’ to describe the inhibiting effects of these phenolic compounds on the Feulgen reaction for DNA. More recently, Greilhuber (1998, 2005) has shown that many of the widely cited examples of intraspecific C-value variation are consequences of methodological errors and need to be treated with caution. Nevertheless, reports continue to be published that document intraspecific C-value variation where the appropriate controls and standards have been used (Bennett and Thomas, 1991; Reeves et al., 1998; Hall et al., 2000; Moscone et al., 2003).
DOES C-VALUE VARIATION CAUSE PHENOTYPIC CHANGE?
There are many examples of correlations between C-value variation between species and cellular parameters such as the duration of the mitotic and meiotic cell cycle and the sizes of cells (Bennett, 1987). Bennett (1972) showed, for example, that the pollen grain volumes of 16 wind-pollinated grasses were positively correlated with their C-values and a comparison of the sperm of a variety of plants shows a similar relationship (Fig. 1A and B). Bennett (1971) coined the term ‘nucleotype’ for the physical, as opposed to the genetical, effects of DNA on the phenotype. Thus, it would appear that intraspecific C-value variation and, therefore, nucleotypic variation should be reflected in differences in the phenotypes of the plants. Unfortunately, the majority of reports of intraspecific C-value variation make no mention of any variation in plant phenotype. One exception is the work of Meagher and Costich (1994, 1996) and Meagher et al. (2005) on Silene latifolia. They have reported differences between male and female individuals within populations and also differences between populations collected from different parts of the species range. Overall there is a negative correlation between C-value and flower size with plants with larger C-values having smaller flowers that those with smaller C-values. They suggest that the nucleotypic effect of C-value variation is reflected in differences in mitotic cell cycle time, so that plants with smaller C-values will have a more rapid cell cycle, produce more cells and therefore larger flowers. However, there is no suggestion that these differences in flower size should be recognized taxonomically.
Fig. 1.
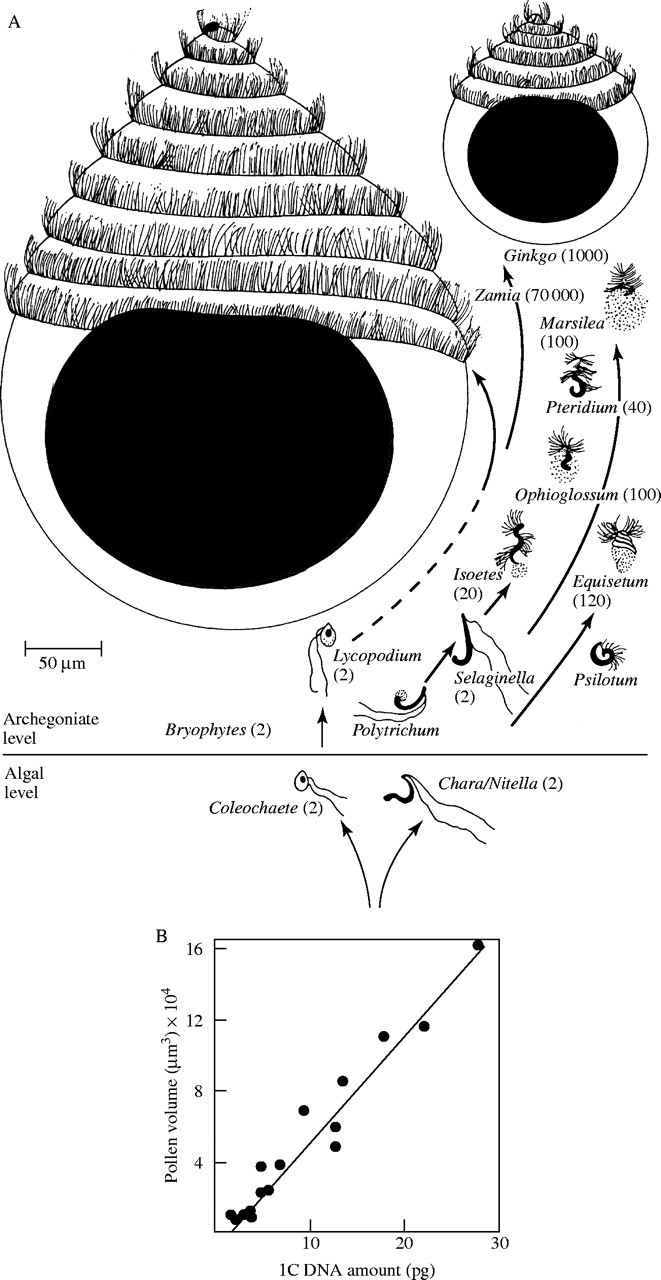
(A) The relationship between sperm size and nuclear size in the main groups of land plants with flagellate sperm cells, figures in brackets are the average numbers of flagella. (Reproduced, with permission, from Kaufman PB. 1987. Plants—their biology and importance. Upper Saddle River, NJ: Pearson Education.) (B) The relationship between pollen volume and 1C DNA amount in a sample of 16 species of wind-pollinated grasses. [Reproduced, with permission, from Bennett MD. 1987. Variation in genomic form in plants and its ecological implications. New Phytologist 106 (Suppl.): 177–200. © Blackwell Publishing.]
However, not all attempts to elucidate a relationship between C-value and morphology have been positive. One of the first, and most comprehensive, was the series of studies on Lolium species by Rees and co-workers (Gupta and Rees, 1975; Hutchinson et al., 1979). Pairs of species of Lolium can show as much as a 50 % variation in C-value between them, yet they can be hybridized; they show mostly regular meiotic pairing and segregation and will produce fertile progeny. Therefore, it is possible to produce F2 and backcross progenies and these can be shown to have a wide range of DNA amounts (Fig. 2A). Hutchinson et al. (1979) scored 19 phenotypic characters such as leaf number, number of florets per spike and time to flowering in three different F2 populations and, in all cases, were unable to find any correlation between DNA amount and the observed variation in phenotype (Fig. 2B). Another more recent example involves Capsicum campylopodium in which Moscone et al. (2003) have found intraspecific C-value variation with a 1·27-fold variation in C-value between two cytotypes that correlates with differences in chromosome length, heterochromatin amount and karyotype asymmetry, yet the two cytotypes are morphologically indistinguishable from each other.
Fig. 2.
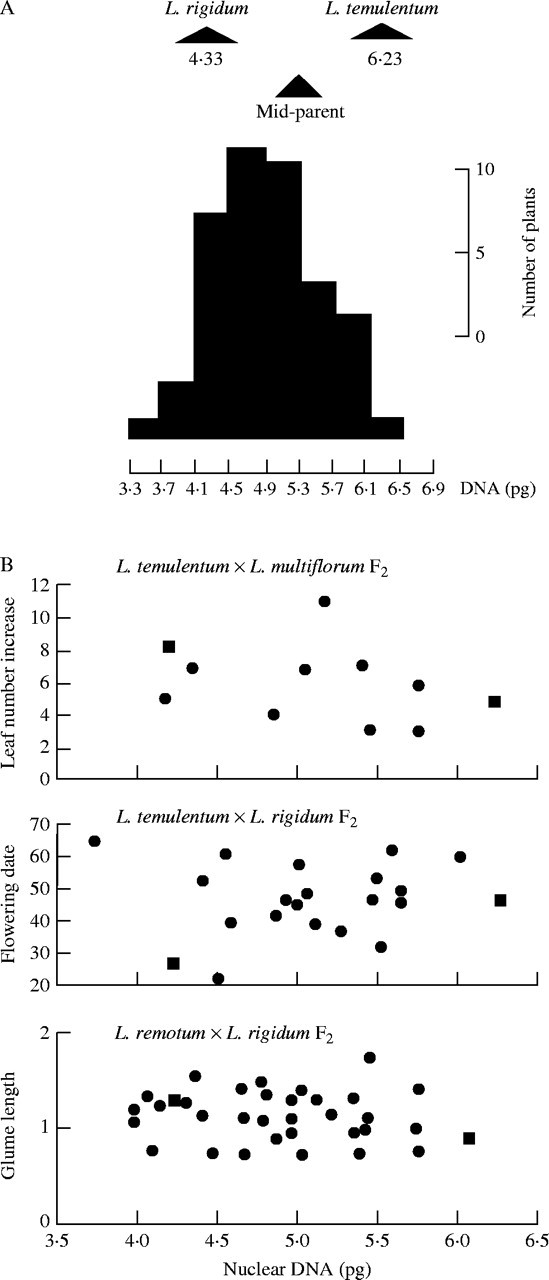
(A) C-values in Lolium rigidum, L. temulentum and their F1 and F2 progeny. (B) Variation in leaf number, flowering date and glume length with changes in nuclear DNA amount amongst the F2 progeny of three different Lolium crosses. The parental values for each character are shown on the graphs as squares. [Reproduced, with permission, from Hutchinson J, Rees H, Seal AG. 1979. An assay of the activity of supplementary DNA in Lolium. Heredity 43: 411–421. © Nature Publishing Group.]
A comparison with polyploids may provide some insight into the apparent lack of universal phenotypic effects of C-value variation on morphology. The polyploid nucleus, at least in autopolyploids, contains multiples of the amount of DNA of the diploid progenitor and, even in allopolyploids, usually there are also very significant increases in genome size, though this clearly depends on the C-values of the component species. In many polyploids gigas effects are seen at the cellular level, as in stomatal guard cells, and in structures such as pollen grains, where growth is of a determinate nature. Plants as a whole, or their component organs, do not necessarily show any increase in size, as there is a compensatory reduction in the number of cell divisions involved in the formation of leaves, petals, stamens etc. (Stebbins, 1971). Clearly there is not a direct parallel between polyploidy and intraspecific C-value variation, since in the former there is extensive gene duplication and altered gene expression, but the amplification of retroelements, a major component of C-value variation in plants (Bennetzen, 1996), does not necessarily have any direct effect on gene activity but it is possible that a similar reduction in the number of cell divisions occurs with increasing C-value.
C-VALUE VARIATION AND ADAPTATION
Correlations between interspecific C-value variation and latitude or altitude are common (Bennett, 1976; Levin and Funderburg, 1979; Knight et al., 2005) so it is likely that similar relationships might be observed within species. Recent work on Hordeum spontaneum, a wild relative of barley, growing in a single canyon (Evolution Canyon) in Israel provides an interesting example of the possible linkage of genome size variation to environmental variation within a species (Kalendar et al., 2000). The plants that they studied grow on north- and south-facing slopes of the canyon, both of which show a gradient from wet at the bottom of the canyon to dry at the top. Kalendar et al. (2000) found that the number of copies of a long terminal repeat (LTR) retrotransposon BARE-1, that is present in all Hordeum species, was clearly correlated with altitude in the canyon. Plants growing at the top of the canyon on both north- and south-facing slopes had significantly more copies of intact BARE-1 elements than those at the bottom (Fig. 3A). In addition, solo copies of the LTR, that are thought to be generated by intra-element recombination followed by loss of the internal domain, occur at a lower ratio to full-length copies in the most extreme habitats compared with the less extreme ones. This appears to have resulted in an increased frequency of the BARE-1 elements in the driest habitats (Fig. 3B and C). These results suggest a relationship between the number of BARE-1 elements and eco-geography and Kalendar et al. (2000) also present evidence that shows that the north- and south-facing populations of H. spontaneum are genetically distinct from each other. Differences in C-value between sampling sites were not significant as they were within the range of the experimental error of the measurement method (flow cytometry) but linear regression analysis indicated that genome size is weakly associated with the orientation of the slope, the samples from the south-facing slope having larger values than those from the north-facing slope (Kalendar et al., 2000). Other examples that relate C-value variation to stress, particularly drought, have been found in the genus Microseris. Plants growing in more mesic habitats have larger C-values than those growing in drier ones (Price et al., 1981a, b, 1986; Castro-Jimenez et al., 1989). Whether there is any commonality in the mechanism(s) behind these changes in the different genera remains to be seen, though there is ample evidence that retrotransposons, including those of plants, are activated under stress conditions (Grandbastien, 1998).
Fig. 3.
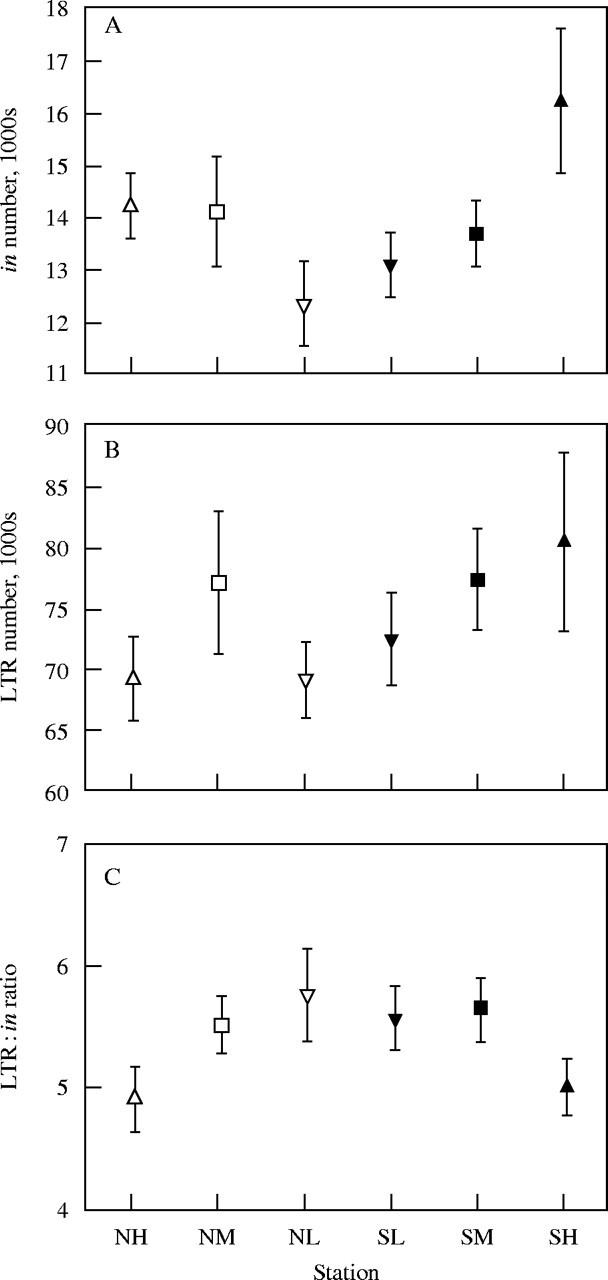
BARE-1 copy number in Hordeum spontaneum at different locations in Evolution Canyon, Israel. (A) The number of intact elements (in) at each location. (B) The number of solo long terminal repeats (LTR) at each location. (C) The ratio of intact BARE-1 elements to LTRs at each location. NH, north slope, high; NM, north slope, mid; NL, north slope, low SL, south slope; low, SM, south slope, mid; SH, south slope, high. Values are means ± standard errors. [Reproduced, with permission, from Kalendar R, Tanskanen J, Immonen S, Nevo E, Schulman AH. 2000. Genome evolution of wild barley (Hordeum spontaneum) by BARE-1 retrotransposon dynamics in response to sharp microclimate divergence. Proceedings of the National Academy of Sciences of the USA 97: 6603–6607. © National Academy of Sciences, USA.]
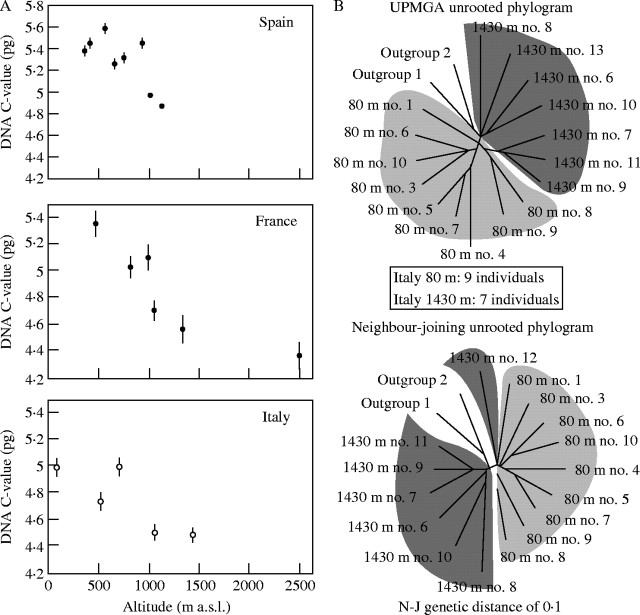
On a larger geographic scale, Reeves et al. (1998) working on Dactylis glomerata found that there was a negative correlation between C-value and altitude in plants from three distinct areas in southern Europe. Plants growing at lower altitudes have larger C-values than those at higher altitudes (Fig. 4A), which suggest that there is selection for smaller C-values with increasing altitude. As in the Hordeum example above, they also present evidence, based on AFLP variation, to show that the high- and low-altitude populations are genetically distinct (Fig. 4B). Intraspecific C-value variation, though to a lesser extent, has also been detected in Slovenian populations of the species but it was not correlated with differences in altitude (Vilhar et al., 2002). With both of these examples (Hordeum and Dactylis) we may be seeing incipient speciation that may eventually lead to taxonomic recognition should the populations become morphologically distinguishable from each other.
Fig. 4.
(A) The relationship between mean DNA C-value (±standard error) and altitude in populations of Dactylis glomerata at three sites in southern Europe, Spain, France and Italy. (B) The relationships between plants from low altitude (light shading) and high altitude (dark shading) populations of Dactylis glomerata based on AFLP variation using two different methods of analysis, neighbour-joining and UPGMA. [Reproduced, with permission, from Reeves G, Francis D, Davies MS, Rogers HJ, Hodkinson T. 1998. Genome size is negatively correlated with altitude in natural populations of Dactylis glomerata. Annals of Botany 82 (Suppl. A): 99–105.]
INTRASPECIFIC C-VALUE VARIATION AS AN INDICATOR OF TAXONOMIC HETEROGENEITY?
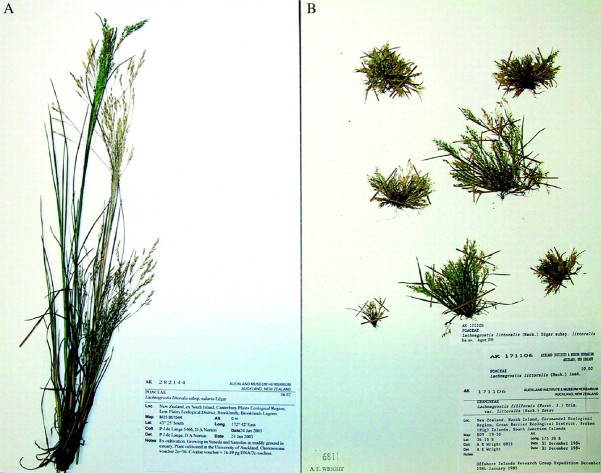
From a taxonomic standpoint, intraspecific C-value variation is probably most significant as an indicator that there may be more than one entity within a species. This is not a particularly new idea as Greilhuber and Speta (1985), for example, showed that, within the Scilla bifolia alliance, C-values ranged from 5·0 to 9·9 pg per 1C nucleus, an almost two-fold variation. They point out that whether this is intraspecific variation or not depends on the species concept applied and if a narrow concept is applied then the intraspecific variation disappears. Three instructive examples where intraspecific variation points to taxonomic heterogeneity have arisen from a recent survey of C-value variation in the Poaceae of New Zealand (B. G. Murray, P. J. de Lange and A. R. Ferguson, unpub. res.). In the first of these, Lachnagrostis littoralis, two subspecies, littoralis and salaria, have been recognized. The former is a small plant that seldom reaches more than 20 cm in height and has a C-value of 13·49 pg per 2C nucleus whereas the latter is much more robust, growing up to 60 cm and with a C-value of 16·61 pg per 2C nucleus (Fig. 5). The species shows intraspecific C-value variation, but with clear morphological and ecological differences between the subspecies (Edgar, 1995; Edgar and Connor, 2000) they should perhaps be recognized as distinct species and another example of intraspecific C-value variation would disappear. The other two examples, Lachnagrostis lyallii and Deyeuxia avenoides, are similar with large differences in C-value, 1·9-fold in the former and 1·2-fold in the latter, and have similar differences in plant vigour. In these latter two examples there has been no formal taxonomic recognition of intraspecific variation though both are known as highly variable species.
Fig. 5.
Herbarium sheets showing the difference in growth habit between (A) Lachnagrostis littoralis ssp. salaria with a 2C DNA amount of 16·61 pg and (B) L. littoralis ssp. littoralis with a 2C DNA amount of 13·49 pg.
CONCLUSIONS
A priority for the future must be to establish whether intraspecific C-value variation can be correlated with morphological variation in a variety of plant species. If a relationship can be demonstrated, then the nuclear variation will be shown to have some taxonomic significance. Without this information, the most significant aspect of intraspecific C-value variation must, at present, be its utility as a predictor of taxonomic heterogeneity and possibly as an indicator of speciation in progress. It will also be necessary to demonstrate that individuals with different C-values, that are considered to be conspecific, are capable of interbreeding and forming fertile hybrids, thus conforming to the biological species concept. If there is some reduction in fertility in such hybrids, then the entities probably do represent different species that should be formally recognized.
LITERATURE CITED
- Bennett MD. 1971. The duration of meiosis. Proceedings of the Royal Society of London, Series B 178: 277–299. [Google Scholar]
- Bennett MD. 1972. Nuclear DNA content and minimum generation time. Proceedings of the Royal Society of London, Series B 181: 109–135. [DOI] [PubMed] [Google Scholar]
- Bennett MD. 1976. DNA amount, latitude, and crop plant distribution. Environmental and Experimental Botany 16: 93–108. [Google Scholar]
- Bennett MD. 1987. Variation in genomic form in plants and its ecological implications. New Phytologist 106 (Suppl.): 177–200. [Google Scholar]
- Bennett ST, Thomas SM. 1991. Karyological analysis and genome size in Milium (Gramineae) with special reference to polyploidy and chromosomal evolution. Genome 34: 868–878. [Google Scholar]
- Bennetzen JL. 1996. The contribution of retroelements to plant genome organization, function and evolution. Trends in Microbiology 4: 347–353. [DOI] [PubMed] [Google Scholar]
- Castro-Jimenez Y, Newton RJ, Price HJ, Halliwell RS. 1989. Drought stress responses of Microseris species differing in nuclear DNA content. American Journal of Botany 76: 789–795. [Google Scholar]
- Dhir NK, Miksche JP. 1974. Intraspecific variation of nuclear DNA content in Pinus resinosa Ait. Canadian Journal of Genetics and Cytology 16: 77–83. [Google Scholar]
- Edgar E. 1995. New Zealand species of Deyeuxia P.Beauv. and Lachnagrostis Trin. (Gramineae: Aveneae). New Zealand Journal of Botany 33: 1–33. [Google Scholar]
- Edgar E, Connor HE. 2000.Flora of New Zealand. Vol. V. Gramineae. Lincoln, New Zealand: Manaaki Whenua Press. [Google Scholar]
- Futuyma DJ. 1998.Evolutionary biology. Sunderland, MA: Sinauer Associates. [Google Scholar]
- Grandbastien M-A. 1998. Activation of plant retrotransposons under stress conditions. Trends in Plant Science 3: 181–187. [Google Scholar]
- Greilhuber J. 1986. Severely distorted Feulgen DNA amounts in Pinus (Coniferophytina) after nonadditive fixations as a result of meristematic self-tanning with vacuole contents. Canadian Journal of Genetics and Cytology 28: 409–415. [Google Scholar]
- Greilhuber J. 1988. ‘Self-tanning’—a new and important source of stoichiometric error in cytophotometric determination of nuclear DNA content in plants. Plant Systematics and Evolution 158: 87–96. [Google Scholar]
- Greilhuber J. 1998. Intraspecific variation in genome size: a critical reassessment. Annals of Botany 82 (Suppl. A): 27–35. [Google Scholar]
- Greilhuber J. 2005. Intraspecific variation in genome size in angiosperms: identifying its existence. Annals of Botany 95: 91–98. [DOI] [PMC free article] [PubMed] [Google Scholar]
- Greilhuber J, Speta F. 1985. Geographical variation of genome size at low taxonomic levels in the Scilla bifolia alliance (Hyacinthaceae). Flora 176: 431–439. [Google Scholar]
- Gupta PK, Rees H. 1975. Tolerance of Lolium hybrids to quantitative variation in nuclear DNA. Nature 257: 587–588. [DOI] [PubMed] [Google Scholar]
- Hall SE, Dvorak WS, Johnston JS, Price HJ, Williams CG. 2000. Flow cytometric analysis of DNA content for tropical and temperate new world pines. Annals of Botany 86: 1081–1086. [Google Scholar]
- Hutchinson J, Rees H, Seal AG. 1979. An assay of the activity of supplementary DNA in Lolium. Heredity 43: 411–421. [Google Scholar]
- Judd WS, Campbell CS, Kellogg EA, Stevens PS. 1999.Plant systematics: a phylogenetic approach. Sunderland, MA: Sinauer Associates. [Google Scholar]
- Kalendar R, Tanskanen J, Immonen S, Nevo E, Schulman AH. 2000. Genome evolution of wild barley (Hordeum spontaneum) by BARE-1 retrotransposon dynamics in response to sharp microclimate divergence. Proceedings of the National Academy of Sciences of the USA 97: 6603–6607. [DOI] [PMC free article] [PubMed] [Google Scholar]
- Knight CA, Molinari N, Petrov DA. 2005. The large genome constraint hypothesis: evolution, ecology and phenotype. Annals of Botany 95: 177–190. [DOI] [PMC free article] [PubMed] [Google Scholar]
- Levin DA, Funderburg SW. 1979. Genome size in angiosperms: temperate versus tropical species. American Naturalist 114: 784–795. [Google Scholar]
- Mayr E. 1940. Speciation phenomena in birds. American Naturalist 100: 637–650. [Google Scholar]
- Mayr E. 1963.Animal species and evolution. Cambridge, MA: Harvard University Press. [Google Scholar]
- Meagher TR, Costich DE. 1994. Sexual dimorphism in nuclear DNA content and floral morphology in populations of Silene latifolia (Caryophyllaceae). American Journal of Botany 81: 1198–1204. [Google Scholar]
- Meagher TR, Costich DE. 1996. Nuclear DNA content and floral evolution in Silene latifolia Proceedings of the Royal Society of London, Series B 263: 1455–1460. [Google Scholar]
- Meagher TR, Gillies ACM, Costich DE. 2005. Genome size, quantitative genetics, and the genomic basis for flower size evolution in Silene latifolia Annals of Botany 95: 247–254. [DOI] [PMC free article] [PubMed] [Google Scholar]
- Miksche JP. 1971. Intraspecific variation of DNA per cell between Picea sitchensis (Bong.) Carr. provenances. Chromosoma 32: 343–352. [DOI] [PubMed] [Google Scholar]
- Moscone EA, Baryani M, Ebert I, Greilhuber J, Ehrendorfer F, Hunziker AT. 2003. Analysis of nuclear DNA content in Capsicum (Solanaceae) by flow cytometry and Feulgen densitometry. Annals of Botany 92: 21–29. [DOI] [PMC free article] [PubMed] [Google Scholar]
- Perrie LR, Brownsey PJ, Lockhart PJ, Large MF. 2003. Evidence for an allopolyploid complex in New Zealand Polystichum (Dryopteridaceae). New Zealand Journal of Botany 41: 189–215. [Google Scholar]
- Price HJ, Chambers KL, Bachmann K. 1981. Genome size variation in diploid Microseris bigelovii (Asteraceae). Botanical Gazette 142: 156–159. [Google Scholar]
- Price HJ, Chambers KL, Bachmann K. 1981. Geographic and ecological distribution of genomic DNA content variation in Microseris douglasii (Asteraceae). Botanical Gazette 142: 415–426. [Google Scholar]
- Price HJ, Chambers KL, Bachmann K, Riggs J. 1986. Patterns of mean nuclear DNA content in Microseris douglasii (Asteraceae) populations. Botanical Gazette 147: 496–507. [Google Scholar]
- Reeves G, Francis D, Davies MS, Rogers HJ, Hodkinson T. 1998. Genome size is negatively correlated with altitude in natural populations of Dactylis glomerata Annals of Botany 82 (Suppl. A): 99–105. [Google Scholar]
- Singh G. 1999.Plant systematics. Enfield, NH: Science Publishers. [Google Scholar]
- Stebbins GL. 1971.Chromosomal evolution in higher plants. London: Arnold. [Google Scholar]
- Teoh SB, Rees H. 1976. Nuclear DNA amounts in populations of Picea and Pinus species. Heredity 36: 123–137. [Google Scholar]
- Vilhar B, Vidic T, Jogan N, Dermastia M. 2002. Genome size and the nucleolar number as estimators of ploidy level in Dactylis glomerata in the Slovenian Alps. Plant Systematics and Evolution 234: 1–13. [Google Scholar]


