

Abstract
• Background Nuclear genome size varies 300 000-fold, whereas transcriptome size varies merely 17-fold. In the largest genomes nearly all DNA is non-genic secondary DNA, mostly intergenic but also within introns. There is now compelling evidence that secondary DNA is functional, i.e. positively selected by organismal selection, not the purely neutral or ‘selfish’ outcome of mutation pressure. The skeletal DNA theory argued that nuclear volumes are genetically determined primarily by nuclear DNA amounts, modulated somewhat by genes affecting the degree of DNA packing or unfolding; the huge spread of nuclear genome sizes is the necessary consequence of the origin of the nuclear envelope and the nucleation of its assembly by DNA, plus the adaptively significant 300 000-fold range of cell volumes and selection for balanced growth by optimizing karyoplasmic volume ratios (essentially invariant with cell volume in growing/multiplying cells). This simple explanation of the C-value paradox is refined here in the light of new insights into the nature of heterochromatin and the nuclear lamina, the genetic control of cell volume, and large-scale eukaryote phylogeny, placing special emphasis on protist test cases of the basic principles of nuclear genome size evolution.
• Genome Miniaturization and Expansion Intracellular parasites (e.g. Plasmodium, microsporidia) dwarfed their genomes by gene loss and eliminating virtually all secondary DNA. The primary driving forces for genome reduction are metabolic and spatial economy and cell multiplication speed. Most extreme nuclear shrinkage yielded genomes as tiny as 0·38 Mb (making the nuclear genome size range effectively 1·8 million-fold!) in some minute enslaved nuclei (nucleomorphs) of cryptomonads and chlorarachneans, chimaeric cells that also retain a separate normal large nucleus. The latter shows typical correlation between genome size and cell volume, but nucleomorphs do not despite co-existing in the same cell for >500 My. Thus mutation pressure does not inexorably increase genome size; selection can eliminate essentially all non-coding DNA if need be. Nucleomorphs and microsporidia even reduced gene size. Expansion of secondary DNA in the main nucleus, and in large-celled eukaryotes generally, must be positively selected for function. Ciliate nuclear dimorphism provides a key test that refutes the selfish DNA and strongly supports the skeletal DNA/karyoplasmic ratio interpretation of genome size evolution.
• Genetic Control of Cell Volume is Multigenic The quantitatively proportional correlation between genome size and cell size cannot be explained by purely mutational theories, as eukaryote cell volumes are causally determined by cell cycle control genes, not by DNA amounts.
Keywords: Skeletal DNA, genome size evolution, nucleomorphs, heterochromatin, karyoplasmic ratio, cell volume determination, selection for economy, origin of the nucleus, nuclear volume
INTRODUCTION
For over half a century biologists have been greatly puzzled because the amount of DNA in cell nuclei does not generally correlate significantly with the number of genes, as would have been expected if DNA's sole function was genic (Mirsky and Ris, 1951). The solution to this so-called ‘C-value paradox’ is simple: genes—whether encoding proteins or specifying functional RNAs like rRNA or tRNA—are not the only function of DNA. DNA also has structural, non-genic functions. Furthermore, during the origin of eukaryotes these structural roles dramatically changed as a result of the origin of mitosis and the cell nucleus, explaining why eukaryote genome size is immensely more variable than that of bacteria (Cavalier-Smith, 1993). The novel cell structures and cell cycle controls of eukaryotes, plus the much larger cell volumes they allow, are keys to understanding the ‘C-value paradox’. It was solved in principle 25 years ago (Cavalier-Smith, 1978) and refined in detail subsequently (Cavalier-Smith, 1980a, b, 1982a, 1985a–d, 1991b, 2003; Cavalier-Smith and Beaton, 1999): the vast amounts of non-genic DNA in many eukaryotes are the necessary outcome of novel cell structures imposing novel selective forces—genomes and cell architecture co-evolve. This removes the paradox.
It should go without saying that mutations are the primary cause of any evolutionary changes and that selection can only act on those that actually occur. Although understanding the causes of and biases among mutations is desirable in itself, to focus on mutations at the expense of selective forces (Petrov, 2001), far from giving new insights into the C-value paradox, sidesteps the core issues. We need to understand both mutations and their differential survival (selection). Mutational biases alone cannot explain the most important facts about genome size evolution; mutational processes stayed essentially unchanged across the bacteria– eukaryote divide. What changed fundamentally was cell structure and the manner of coevolution between genomes and cells, transforming the selective forces on genomic changes (Cavalier-Smith, 1993). The main reason why many do not realise that we already have a basically sound explanation of the C-value paradox is not that we do not understand mutations well enough, but that the solution I have offered, and develop further here, is a synthesis drawing on cell and molecular biology, population and evolutionary biology, developmental biology and ecology; evaluating such a complex synthesis is tough to a specialist in just one area. Population geneticists might prefer to be able to solve evolutionary problems strictly in their own terms and ignore detailed cell biology; cytologists might prefer to do the same and ignore abstruse population genetic arguments; molecular biologists might prefer to sequence DNA and ignore both the cell biology and the population biology. But for deeper understanding we must make the effort to combine the explanatory modes of all relevant disciplines.
Mirsky and Ris (1951) first showed a very strong quantitative correlation between cell size and genome size in vertebrate animals. This proved equally true for plants and unicellular eukaryotes (protists) (Cavalier-Smith, 1985a), as did the lack of correlation with organismal complexity or the inferred number of genes (Cavalier-Smith, 1985b). Nuclear volume also correlates with genome size in just the same way in both animals and plants (Vialli, 1957; Baetke et al., 1967). Yet most molecular biologists and geneticists were so obsessed with sequence-related functions of DNA in the heyday of deciphering the genetic code that both fundamental cellular correlations were ignored. It was left to others to suggest that DNA may have functions additional to genic ones. Bennett (1972) suggested that DNA has a structural role in controlling nuclear volume and referred to this and other possible functions of genome size unrelated to sequence as nucleotypic. Commoner (1964) postulated that DNA amounts control cell size, and van't Hof and Sparrrow (1963) that they controlled cell-cycle length. Although Bennett (1972) also supported both suggestions, I argued that correlation of genome size and cell-cycle length was much weaker and more variable and indirect than for cell and nuclear volume (Cavalier-Smith, 1978, 1980a, 1982a). The two latter correlations typically essentially scale isometrically; organisms with 10, 100, 1000, 10 000 or 100 000-fold larger genomes than others have approximately 10, 100, 1000, 10 000 or 100 000-fold larger cells and nuclei (Fig. 1). This is not so for cell-cycle lengths or the inverse correlation of genome size with basal metabolic rates in animals emphasized by Szarski (1970, 1976, 1983) or the various other things that may correlate weakly with genome size; the latter are very indirect consequences of different cell volumes, have nothing directly to do with genome size, and can be modulated by many secondary processes (Cavalier-Smith, 1985a, b, 1991b).
Fig. 1.

Three contrasting scaling laws for genome size evolution. Law 1. Bacteria have single replicons per chromosome, so are under constant selective pressure to limit the accumulation of non-genic DNA that would lengthen replication times and slow reproductive rates. Thus their genome size (open circles) is related simply to gene numbers, which increase in proportion to metabolic and structural complexity—on average somewhat greater in larger cells (slope of 0·28). Law 2. Nuclei have numerous replicons origins per chromosome, which can be replicated simultaneously—so replication time is mechanistically independent of genome size and can be far less than in bacteria. When the nucleus evolved, DNA acquired a new function—to nucleate assembly of the nuclear envelope; in eukaryotes genome size scales proportionally to cell volume (slope 1·03, not significantly different from 1) because of this function and because the karyoplasmic volume ratio is essentially invariant with cell volume—probably because of a functionally essential quantitative balance between rates of nuclear RNA and cytoplasmic protein synthesis. The relationship is complicated by the presence of heterochromatin. It is simplest in unicellular eukaryotes with negligible amounts of heterochromatin (filled circles and line U: mostly green algae, diatoms and dinoflagellates, plus a few yeasts with tiny cells and amoebae with giant ones: Shuter et al., 1983), where the DNA/cell volume is minimal. In salamander red blood cells (S) the whole nucleus is heterochromatic and shrunken, so the DNA/cell volume ratio is about 50-fold greater. Cells with a mixture of compact heterochromatin and swollen euchromatin have intermediate DNA/cell volume ratios irrespective of whether they are unicellular (like cryptomonads: crosses) or multicellular (angiosperm meristem cells: dashed line). Law 3. Nucleomorph genome size is essentially invariant with cell volume because, unlike bacteria, their gene content is virtually constant and, unlike ordinary nuclei, their transcriptional/RNA processing needs do not increase significantly with cell volume (squares if volume measured by Beaton and Cavalier-Smith [1999] and stars if estimated from the literature); selection prevents non-coding DNA accumulating—because of its metabolic cost and perhaps also a constraint on chromosome arm length arising from the loss of higher-order chromatin folding (Cavalier-Smith, 1985b). Figure based on Shuter et al. (1983) and Cavalier-Smith and Beaton (1999).
In principle the remarkable universal correlation of eukaryote genome size and cell volume could have been explained in three contrasting ways:
(1) It might be the result of a purely mutational equilibrium, e.g. Petrov (2002) suggested that the spectrum of genome sizes is determined by a balance between a universal bias in favour of small deletions and a varying tendency to accumulate DNA by duplicative transposition of ‘selfish’ genetic elements. This or any other essentially mutational hypothesis (e.g. the original selfish DNA ideas: Doolittle and Sapienza, 1980; Orgel et al., 1980) are compatible with the correlation only if genome size directly causally determines cell size, i.e. if DNA has a nucleotypic function. I shall show that genome size does not determine cell volume and therefore that all purely mutational theories must be false: selection as a function of genome size must also be involved in addition to any mutation pressures that may exist. Another reason why selection must be involved is that the spread of cell volumes differs dramatically in different taxonomic groups in an apparently adaptive way. This cannot be explained by purely mutational theories.
(2) One can postulate a universal net excess of duplications over deletions that would inexorably increase genome size, coupled with threshold selection against excessive DNA that was a function of cell size—below the threshold mutational bias would increase DNA, above it selection would hold it in check. I pointed out earlier that such a mutation–selection equilibrium is the only way of making the idea of selfish DNA even remotely plausible as an explanation of the C-value paradox without invoking a nucleotypic function for DNA (Cavalier-Smith, 1985c). The central assumption behind this theory is that natural selection is ineffective at limiting or reducing genome size below a cell-size-determined threshold. In a later section I explain how the differential scaling of nucleomorph and nuclear genome sizes show that this assumption is false. Natural selection can reduce genome size very efficiently and if necessary eliminate essentially all non-coding DNA (Beaton and Cavalier-Smith, 1999).
(3) One therefore has to explain the correlation by a varying balance between two opposing selective forces: selection against extra nuclear DNA in smaller cells and selection for it in larger cells (Cavalier-Smith, 1978). This is sometimes called the optimal DNA theory (Orgel et al., 1980). But no biological optimization is ever perfect. Physical and developmental constraints and recurrent harmful mutations inevitably mean that any structure or process is to some degree suboptimal, so it might be better named the near-optimal DNA theory.
To be satisfactory any theory must explain, preferably quantitatively, the sharp contrast between the bacterial and eukaryote scaling laws shown in Fig. 1. Only the skeletal DNA theory has seriously addressed this. Labelling this interpretation of eukaryote genome evolution as the ‘skeletal DNA theory’ is an oversimplifying convenience. The skeletal DNA idea is but one of seven principles that must be combined to understand eukaryote nuclear genome size evolution. I reassert them briefly in updated form:
(1) The central factor is cell volume. This is generally highly adaptive in both multicellular organisms and protists. A huge range (roughly 300 000-fold) of cell sizes has evolved in eukaryotes for adaptive reasons; but the spectrum is markedly different in breadth and mean in different groups, which is also adaptively explicable. The spectrum results from opposing advantages and disadvantages of small versus large cells. Cell volume for protists is the same as body size and thus fundamentally and centrally important for defining their ecological niche (Cavalier-Smith, 1980a). Understanding the importance of cell size in plants, and even more so in animals, is greatly complicated by the immense variation in cell volume possible from tissue to tissue and by the false but widespread dogma that cell size does not matter for multicells and that only body size counts (Gould, 1977). Botanists have been more ready to recognize that somatic cell size is physiologically important, because much functional machinery in plants consists of individual cells, e.g. tracheids, phloem sieve tube elements, stomatal guard cells. But even in animals the size of blood cells in relation to capillaries and the size of nerve cells that have to stretch from an elephant's spine to its toes or from brain to the tip of its trunk, or to the tip of a blue whale's penis are functionally important (Cavalier-Smith, 1991b). Throughout biology size matters.
(2) Eukaryote cell volumes evolve by mutating cell-cycle control genes, not by changing genome size. Genetic control of cell size is crucial for understanding nuclear genome size evolution, because had the hypothesis that genome size determines cell size (Commoner, 1964) been correct, it would have provided a simple explanation of their universal correlation: mutations increasing or decreasing nuclear DNA amounts would necessarily proportionally increase or decrease cell volumes. A purely mutational theory of genome size (Petrov, 2002) contradicts both principles 1 and 2 by assuming that: (a) DNA amounts causally determine cell volumes (with a scaling of 1 on Fig. 1), and (b) cell volume is a neutral character not subject to selection. If either assumption is false, the purely neutral theory is wrong and selection is also involved. I have previously given many reasons why cell volume is adaptive and the purely neutral theory false (Cavalier-Smith, 1985a). But understanding of eukaryote cell cycles was insufficient then to reject the theory that DNA amounts determine cell volumes; only indirect arguments could be given against it.
(3) DNA is the fundamental nuclear skeleton. As the nuclear envelope assembles around chromatin and is always attached to it during interphase, nuclear DNA content plus its tightness of packing or degree of unfolding causally determine nuclear volumes; total nuclear DNA therefore has a non-genic nucleotypic function. By contrast, bacterial, mitochondrial and chloroplast DNAs do not. The assertion by Gregory (2001) that my use of the term nucleotypic for this skeletal function is contrary to its original definition by Bennett (1972) is mistaken.
(4) The karyoplasmic ratio is optimized. The ratio of the volume of the nucleus to that of the cytoplasm (karyoplasmic ratio: Strasburger, 1893; Wilson, 1925) is functionally important and essentially invariant with cell volume across many orders of magnitude (Trombetta, 1942). Its importance is not, as originally suggested (Cavalier-Smith, 1978) and Gregory (2001) unnecessarily dwells on, because transport across the nuclear envelope is rate-limiting for growth, which is not generally true for cycling cells, but may be for a few giant ones (Cavalier-Smith, 1982a). Instead it lies in the unavoidable requirement to balance the overall rate of RNA synthesis (mass per unit time) and processing (which both require nuclear machinery that occupies space) with the rate of protein synthesis (which requires ribosomes, which occupy a major part of the cytoplasmic space) in actively multiplying cells undergoing balanced growth (defined as growth that leaves the quantitative proportion of different cell constituents unchanged from one cell generation to the next: Ingraham et al., 1983).
(5) Therefore, bigger cells need larger nuclei. When cell size increases in evolution there is positive selection for a corresponding increase in nuclear volume; it is generally easier to achieve this by increasing the amount of DNA rather than by altering its folding parameters.
(6) There is universal selection against excessive amounts of DNA. This stems from pervasive selection to maintain economy in the use of energy, nutrients and space and maximize the output of grandchildren cells from limited resources. Therefore when cell size decreases in evolution there is stronger selection for deletions than insertions to reduce the now partly wasteful non-coding DNA until the optimal karyoplasmic ratio is restored.
(7) As a result of these opposing selective forces, larger genomes have relatively more non-coding skeletal DNA. This DNA provides a larger habitat for selfish genetic elements that spread by duplicative transposition, so they will inevitably be much more numerous in larger genomes than small ones—but their abundance is a consequence, not a cause of the larger genomes. Although the sequence of such transposable elements can be regarded as ‘selfish’ and of no benefit to the host cell, their DNA contributes as effectively as non-transposon secondary DNA and genic DNA to the overall skeleton and volume of the nucleus and thus benefits the cell; calling them ‘selfish’ is partially misleading. Alhough ‘selfish’ in origin, there is continual turnover of different types of transposable element within a chromosomal habitat size, determined not by the elements themselves but by principles 1–6 above; thus as some families increase, others will decline. This is well shown in mammals, where all eutherian orders have essentially the same genome size, except bats which, like birds, have smaller cells to allow more rapid gas exchange by red cells during flight. This near-constancy in mammalian genome size reflects strong stabilizing selection for cell size and implies that mammalian genome size has been essentially constant for 70 million years. But different kinds of transposable elements spread in different groups. Thus the fact that the human genome is made up about 40 % of Alu sequences, similarly abundant in primates but not in other orders, does not mean that transpositional spread of Alu sequences increased genome size in the long term (briefly they must have, the more so if they spread faster than compensatory elimination of non-coding DNA); they probably simply replaced other non-coding sequences.
It is important not to confuse correlation with causation. Consider the maize genome, packed with six major families of transposable elements constituting 70 % of its mass, none older than about 5 million years. It has been assumed that this means that its genome increased twofold during this period (SanMiguel et al., 1998). But without independent evidence for genome increase (e.g. from fossil cell size) this is circular reasoning. Maize also deleted many genes since diverging from sorghum (Ilic et al., 2003). Its genome size might have increased as assumed, decreased or remained the same subject only to genomic turnover, with new retrotransposon families replacing old ones or other secondary DNA. I think it may have increased—not through transposition pressure, but as a result of selection by humans for larger seeds (on average associated with larger genomes: Thompson, 1990), which would favour larger cells (although endopolyploidy makes larger cells for starch storage in the endosperm, a larger starting size might also contribute).
All seven principles were stated 25 years ago (Cavalier-Smith, 1978), but the evidence has increased considerably since; some of the numerous subsidiary arguments in that paper have been supported by new evidence, but a few have been disproved. This paper has three purposes: first, to present the basic theory more thoroughly then before, in the light of recent molecular data; second, to discuss examples that support it and contradict rival theories; third, to criticize misunderstandings of the theory and explain why existing alternatives are unsatisfactory.
After briefly listing the mutational causes of genome size evolution, I explain the dual nucleotypic/genic control of nuclear volume (principle 3), refining skeletal DNA theory to take account of new molecular information about heterochromatin and the involvement of the nuclear lamina in nuclear assembly around DNA, and discuss the origins of these mechanisms in the ancestral eukaryote. I then explain the importance of the karyoplasmic ratio (principle 4) and universal selection for economy. After emphasizing that the skeletal role of DNA and the karyoplasmic ratio's constancy are both essential for understanding coevolution of genome size and cell size, I present case examples, mainly in protists, exemplifying these principles. Finally, I consider fallacious criticisms of the theory and explain that eukaryote cell-cycle controls are such that they do not involve overall DNA amounts as causal factors. The control of eukaryote cell size is therefore multigenic not nucleotypic, allowing us to reject decisively purely mutational theories of nuclear genome size evolution.
MUTATIONAL MECHANISMS OF GENOME SIZE CHANGE
There are five major ones:
(1) Local indels of a few nucleotides probably mainly caused by replication errors; these will affect the lengths of introns and intergenic spacers.
(2) Duplication/deletion of whole genes or major chromosomal segments, probably mainly caused by recombination errors, e.g. unequal sister chromatid exchanges.
(3) Duplicative transposition of transposons.
(4) Errors in chromosome disjunction causing aneuploidy.
(5) If polyploids gradually become functional diploids and stabilize with more DNA than before, polyploidy can be an important cause of increased genome size (this often occurs transiently).
Mechanisms (2), (3) and (4) are most important for changing gene number. However, although selection has the major influence on genome size, mutational biases probably more dominantly affect many features of secondary DNA composition (Cavalier-Smith, 1993).
For genome size increase, (2), (4) and (5) may be the most important mechanisms. Each event makes a much bigger increase than for (1), and in contrast to (3) the new DNA already comes with appropriately spaced replicon origins and attachment regions for chromosomal core proteins to allow reversible folding into chromosomes and proper attachment to the nuclear lamina and matrix in interphase (Cavalier-Smith, 1985b). A sixth potential mechanism is insertion of foreign genes by lateral gene transfer (probably involving illegitimate recombination); lateral gene transfer may have had quantitatively significant effects on genome size in a few bacteria (notably in the acquisition of numerous hyperthermophilic genes by some eubacteria and numerous mesophilic genes by some archaebacteria: Cavalier-Smith, 2002b) but is probably quantitatively minor in eukaryotes—however even microsporidia, the eukaryote cells with the smallest genomes, got at least one foreign gene thus (Fast et al., 2003).
For genome shrinking, mechanism (2) (unequal recombination) is probably most important. Since large segmental deletions and insertions are much easier by homologous than by illegitimate recombination, the rates should be substantially greater in a genome with numerous related transposable elements than one lacking them with mostly unique DNA. Therefore selfish DNA and former selfish DNA may provide the most powerful means of genomic reduction available to a cell, the opposite of what its original proponents imagined. It is therefore not obvious that the net effects of transposable elements need be to increase genome size. Gregory (2003) correctly criticised the idea that small local indels are the major mutational cause of genome reduction (Petrov, 2002), as they would be much less effective than larger deletions. Nonetheless it is of considerable interest that deletions locally may exceed duplications/insertions (Petrov, 2002). Unless this apparent bias is really the result of selection (Charlesworth, 1996) it provides another piece of evidence that mutational bias is not invariably upwards.
HOW DNA AMOUNTS CONTROL NUCLEAR VOLUME: THE BASICS
In interphase the nuclear envelope is physically attached to chromatin. In animals and plants, having open mitosis, it assembles on the surface of condensed chromatin at telophase. The volume of the interphase nucleus is set by the total volume of the chromatin (determined by the genome size and the DNA/protein packing ratio H; i.e. the ratio of the total volume of a 30 nm chromatin thread [DNA + proteins] to that of the DNA within it) plus the swelling factor (s, how many times the chromatin polyelectrolyte gel increases in volume subsequent to telophase). Thus the volume (V) of interphase nuclei is given by the formula: V = aHpsC, where a is a universal constant depending only on the measurement units, p is the ploidy, and C the genome size or C-value. It is therefore necessarily the case that interphase nuclear volume is determined jointly nucleotypically (by C) and genically (by H and s). The genome size, C, determines the theoretical minimal volume; genes for chromatin proteins (typically mainly histones) determine the minimal practical packing ratio H (e.g. tighter packing and smaller nuclei are allowed in many sperm by protamines than by histones in somatic cells, such as most vertebrate red blood cells); and various gene products influence the swelling factor by unwinding or condensing chromatin to different degrees. But s partly depends on fundamental physical properties of polyelectrolytes and their counterions, and thus is also subject to basic physical constraints.
Thus genome size (C) does causally affect nuclear volumes, but these are not exclusively controlled by genome size. Changes in genome size necessarily change nuclear volume in direct proportion, in the absence of changes to genes influencing H or s. This is not the case for cell volume. Skeletal DNA theory asserts that the normal and major way that nuclear volume changes in evolution is by changing C, not H or s. As we know that H is essentially invariant because of conservatism of histones, nucleosomes and the folding pattern of the basic chromatin thread, the only way nuclear volume could change significantly is by caltering C or s. Empirically what has changed is C not s. The swelling factor s, unlike C is not a constant but increases with the degree of transcription and can be experimentally manipulated by changing ionic conditions, as expected by polyelectrolyte theory (Nicolini et al., 1984); therefore cells have a range of physiologically acceptable s-values, not a single fixed one. One question not satisfactorily answered is whether s has a fixed upper limit. We know that in animal oocytes that are halted in meiosis, during which chromatin connections to the nuclear envelope are broken—as in mitosis—the nuclear envelope can swell to an immensely greater diameter than is possible in interphase. Thus there is no inherent limitation to its growth when not constrained by being bound to chromatin. But attachment of the nuclear envelope to DNA imposes an upper limit to nuclear volume.
Injection experiments of mammalian HeLa nuclei into frog oocytes, which immediately swell about 50-fold (Gurdon, 1968), give an empirical estimate of an upper limit to s. Equally illuminating were cell fusion experiments to make heterokaryons between genetically inactive chicken red blood cell nuclei with maximally condensed chromatin and transcriptionally active HeLa nuclei (Harris, 1970). The inactive nuclei swell at least 20-fold and then are transcribed and replicated. Harris stressed that the cytoplasm controls gene activity not the DNA; by supplying swelling factors (ultimately coded by genes in the usual chicken-and-egg way of biology) it also affects nuclear volume. Of course, the chicken nuclei remain smaller than the HeLa one, as expected from their 3-fold smaller genomes. Using these nuclear injection and cell fusion experiments as a guide, I suggest that the maximum possible range for s is of the order of a thousand-fold, over two orders of magnitude less than the 300 000-fold range of cell volume. Since the practical limit for transcribing, growing nuclear volume ranges may be closer to 50-fold, germ-line cells (which cannot resort to endopolyploidy, as many somatic cells do, especially in invertebrates and angiosperms) obviously must rely mainly on evolving different genome sizes to adjust their nuclear volumes in proportion to their vastly differing cell volumes (if we include nucleomorphs, with smallest genomes six times less than the smallest microsporidia, the total range in nuclear DNA content is 1 800 000-fold assuming a uniform degree of folding). Using the term skeleton for the size-determining function of DNA does not imply that it is rigid; at the local level it is not—segments writhe, flex and diffuse as far as their attachments allow (Vazquez et al., 2001; Ostashevsky, 2002).
When I spoke frequently on skeletal DNA over 20 years ago, a common reaction was why not make the nuclear skeleton of protein? One sometimes felt that one's critics would prefer any material but DNA—protein, chitin, even steel or teflon. Why use DNA? A key advantage of DNA as a nuclear skeleton is that as a polyelectrolyte gel its volume can stretch or shrink within certain limits by binding specific proteins that modify its self-repulsive negative electrical charge (notably the highly positive core histones that induce it to wrap around them) and by modifying the charge on such binding proteins themselves by phosphorylation (adding negative charge) and dephosphorylation (removing it) or by acetylation (reducing positive charge) or deacetylation (increasing it), methylation or demethylation. Core histones are also covalently modified by ubiquitination, glycosylation, ADP ribosylation, and sumoylation: Shiio and Eisenman, 2003.
Gregory (2001) wrote that nobody disputes that DNA amounts causally determine nuclear volumes. I wish that were so, but he also cites Vinogradov (1998), who asserts that a nucleoskeleton ‘does not require the DNA molecule and could be fulfilled by a proteinaceous cytoskeleton without involving the precarious informational molecules’. The volume considerations in previous paragraphs indicate that, so long as DNA remains attached to the envelope, it is physically impossible for a (hypothetical) protein skeleton to achieve the expansion in size that occurs in the largest cells unless the DNA amount also increases hugely. Thus Vinogradov's assertion is strongly contradicted by the facts and amounts to saying that he would have designed things differently. But nature chose DNA because it was there, convenient, and did the job with supreme efficiency. For that job, size, flexibility and potential to swell with activity and shrink into inaction, matter. Sequence does not, as shown by injection experiments, where any DNA (bacteriophage, plasmid or whatever) will nucleate the assembly first of chromatin and then the nuclear pores and envelope to make morphologically normal nuclei (Forbes et al., 1983). The frog egg is packed with histones, pore complexes, membrane vesicles and soluble lamins, awaiting arrival of the sperm and the almost explosive replication of DNA during cleavage to spring into action and assemble thousands of nuclei without further RNA or protein synthesis or gene expression for nuclear structural proteins. If you inject any foreign DNA instead it nucleates assembly, the mass of nuclei assembled depending simply on how much is injected.
In principle, DNA's skeletal function is achieved in four ways:
(1) Nucleosome assembly by DNA coiling around core histones.
(2) Nucleosome supercoiling to form 30 nm chromatin threads.
(3) Folding 30 nm chromatin threads into large chromatin masses: either interphase heterochromatin or mitotic chromosomes (only partially understood: Belmont et al., 1999; Grewal and Moazad, 2003).
(4) Attachment of interphase chromatin to the nuclear lamina and inner nuclear matrix, or in mitotic chromosomes to the chromosome core and via the kinetochore to spindle microtubules.
These skeletal functions of DNA are achieved by two types of binding to nuclear proteins: partially sequence-specific binding, notably by DNA at centromeres, telomeres and the very numerous local regions that mediate attachment to the nuclear matrix (matrix attachment regions, MARs); and a more generalized, largely sequence-independent binding, notably to core histones but also to the nuclear lamina. As nuclear volume changes in evolution, amounts of both skeletal DNA types will change in concert with each other and overall genome size. The geometrical position of these sequence-specific parts of the skeletal DNA is probably important for the DNA skeleton to alternate so dramatically between its interphase and mitotic state. At least part of the short evolutionarily conserved regions of intergenic non-coding DNA (Kondrashov and Shabalina, 2002) is likely to mediate attachments to the nuclear matrix and lamina. As most skeletal DNA has largely sequence-independent functions, changes in its amount contribute more to overall genome size than the sequence-specific components. In all eukaryotes telomeres are specifically attached to the nuclear envelope during interphase and meiotic prophase. Their movement in the plane of the membrane and aggregation to yield the bouquet stage is probably important for pairing. Centromeres commonly, but less invariably, associate with the nuclear envelope. Centromeres and telomeres are necessarily so disposed at the end of mitosis to make attachment to the nuclear envelope easy: Rabl (1885) first recognized that they typically maintain their positions after mitosis and that interphase nuclei are essentially swollen chromosome arms packed into a sphere, but maintaining much spatial concentration in distinct domains.
Acetylation and phosphorylation of histones are generally considered important in the switch between interphase and mitotic chromatin. There ought to be more study of how peridinean dinoflagellates, which apparently lack core histones and nucleosomes—at least in bulk DNA—and have supercoiled chromosomes throughout interphase, achieve this. Their condition is clearly derived, as they belong to the advanced protozoan group Alveolata (Fig. 2) and are not primitive eukaryotes (Cavalier-Smith, 2004b). Methylation of DNA and histones and histone deacetylation also help organize the more compact, typically genetically inactive state of heterochromatin (Grewal and Moazad, 2003). Heterochromatin is much more obvious in animals and plants than in fungi and protozoa, which long made it debatable whether it was a fundamental nuclear feature or an optional extra.
Fig. 2.

The tree of life based on molecular, ultrastructural and palaeontological evidence. Contrary to widespread assumptions, the root is among the eubacteria, probably within the double-enveloped Negibacteria, not between eubacteria and archaebacteria (Cavalier-Smith, 2002b); it may lie between Eobacteria and other Negibacteria (Cavalier-Smith, 2002b). The position of the eukaryotic root has been nearly as controversial, but is less hard to establish: it probably lies between unikonts and bikonts (Lang et al., 2002; Stechmann and Cavalier-Smith, 2002, 2003). For clarity the basal eukaryotic kingdom Protozoa is not labelled; it comprises four major groups (alveolates, cabozoa, Amoebozoa and Choanozoa) plus the small bikont phylum Apusozoa of unclear precise position; whether Heliozoa are protozoa as shown or chromists is uncertain (Cavalier-Smith, 2003b). Symbiogenetic cell enslavement occurred four or five times: in the origin of mitochondria and chloroplasts from different negibacteria, of chromalveolates by the enslaving of a red alga (Cavalier-Smith, 1999, 2003; Harper and Keeling, 2003) and in the origin of the green plastids of euglenoid (excavate) and chlorarachnean (cercozoan) algae—a green algal cell was enslaved either by the ancestral cabozoan (arrow) or (less likely) twice independently within excavates and Cercozoa (asterisks) (Cavalier-Smith, 2003a). The upper thumbnail sketch shows membrane topology in the chimaeric cryptophytes (class Cryptophyceae of the phylum Cryptista); in the ancestral chromist the former food vacuole membrane fused with the rough endoplasmic reticulum placing the enslaved cell within its lumen (red) to yield the complex membrane topology shown. The large host nucleus and the tiny nucleomorph are shown in blue, chloroplast green and mitochondrion purple. In chlorarachneans (class Chlorarachnea of phylum Cercozoa) the former food vacuole membrane remained topologically distinct from the ER to become an epiplastid membrane and so did not acquire ribosomes on its surface, but their membrane topology is otherwise similar to the cryptophytes. The other sketches portray the four major kinds of cell in the living world and their membrane topology. The upper ones show the contrasting ancestral microtubular cytoskeleton (ciliary roots, in red) of unikonts (a cone of single microtubules attaching the single centriole to the nucleus, blue) and bikonts (two bands of microtubules attached to the posterior centriole and an anterior fan of microtubules attached to the anterior centriole). The lower ones show the single plasma membrane of unibacteria (posibacteria plus archaebacteria), which were ancestral to eukaryotes and the double envelope of negibacteria, which were ancestral to mitochondria and chloroplasts (which retained the outer membrane, red).
HOW HETEROCHROMATIN COMPLICATES THE BASIC SKELETAL DNA THEORY
Two recent developments show that heterochromatinization is fundamental to the eukaryote state and probably originated in the ancestral eukaryote at the same time as mitosis. First, is major progress in establishing where the root of the eukaryote phylogenetic tree really lies. Contrary to previous ideas, the last common ancestor of animals and plants was also the last common ancestor (cenancestor) of fungi, chromists and all protozoa, i.e. the same as the last common ancestor of all eukaryotes (Fig. 2). Thus all features of animal and plant cells that are truly homologous (and did not travel between them by lateral gene transfer) must have already been present in the eukaryote cenancestor. Thus it not only had nucleosomes and histone acetylation and methylation, but was also sexual with meiosis and a bouquet stage. Any non-laterally transferred homologous feature present on both sides of the basal eukaryotic bifurcation (Fig. 2) must also have been present in the common ancestor, even if absent in some groups, e.g. centrioles were certainly present in the ancestors of higher fungi and plants, which both lack them. Until we rooted the eukaryote tree correctly it was harder to decide whether such features absent in some groups were ancestrally absent or secondarily lost.
For example, the much laxer chromatin folding in Saccharomyces cerevisiae chromosomes, which unlike in most eukaryotes allows transcription during mitosis, was postulated as primitive (Nasmyth, 1995). Almost certainly it is a secondary consequence of a major reduction in genome size after the budding yeast state evolved from a filamentous ancestor (Cavalier-Smith, 2000b); a lower degree of compaction can be tolerated by chromosomes with substantially less DNA without making arms too long to fit within the spindle (see Cavalier-Smith, 2003a). The combination of a much smaller genome and more numerous chromosomes than Schizosaccharomyces pombe allowed S. cerevisiae to have looser mitotic chromosomes without excessive arm lengths, unlike S. pombe that necessarily retains ancestrally tighter folding. Filamentous ascomycete fungi have nearly twice as many genes (Galagan et al., 2003) and are much more typical higher fungi than yeasts. S. cerevisiae is almost the worst possible model for a typical unicellular eukaryote. Compared with the cenancestor, S. cerevisiae has dramatically reduced genome size, lost most introns, centrioles, cilia, phagocytosis, intermediate filaments and the nuclear lamina, evolved a novel asymmetric mode of budding, and lost the highest levels of chromatin folding, and much else. Budding yeasts are unlike virtually all other eukaryotes in centromere structure (McAinsh et al., 2003); typically centromeres have a central core containing the kinetochore, which binds spindle microtubules, and peripheral repeated heterochromatic DNA with substantial bulk important for sister chromatid adhesion. But an ancestor of S. cerevisiae simplified its centromere to a single microtubule-binding element and dispensed with centromeric heterochromatin, substantially reducing this part of the skeletal DNA inventory; although it no longer needs centromeric heterochromatin it still uses heterochromatin silencing protein Sir1 (Hediger et al., 2002) to attract CAF1, an assembly factor helping direct CenpA to the centromere (Sharp et al., 2003), but it must do so bypassing the typical intermediate need for heterochromatin (Sharp and Kaufman, 2003).
The most reduced nuclear genomes of all (nucleomorphs: see later section) have no repeated DNA and no sign of heterochromatin ultrastructurally or in their sequences. In cryptophytes, members of the kingdom Chromista formed by red algal nuclear enslavement (Fig. 2), each of the three minute nucleomorph chromosomes has just enough space in one position for a tiny centromere like in S. cerevisiae; as one encodes the key centrosomal histone CenpA they have centromeres of unknown location and size. Nucleomorphs may even lack telomeric heterochromatin (the only kind S. cerevisiae kept); both sorts have telomeric sequences—typical in chlorarachneans, modified in cryptophytes.
Against this phylogenetic background the fact that heterochromatinization, with methylation of both DNA and histones centrally involved, is mechanistically fundamentally similar in animals and plants (Grewal and Moazad, 2003) indicates its presence in the eukaryote cenancestor. I have suggested that repetitive constitutive heterochromatin originated in the ancestral eukaryote because of its importance in the folding and attachments of centromeres and telomeres, and then spread essentially non-adaptively to intercalary positions, by ‘intragenomic drift’ (Cavalier-Smith, 1985b). The latter hypothesis explained why the relative amounts of constitutive heterochromatin vary among animals and plants independently of genome size and other adaptive variables. It now seems likely that heterochromatin's original role was in centromere assembly (notably helping direct CenpA rather than H3 to the kinetochore region) and function (notably in centromere cohesion; perhaps also in controlling its three-dimensional structure to ensure bipolar kinetochore attachment in mitosis and meiosis; S. cerevisiae monopolin may provide a novel simplified way of achieving this in meiosis I after losing centromeric heterochromatin: Toth et al., 2000; Clyne et al., 2003; Rabitsch et al., 2003).
Centromeres originated very early in eukaryotic evolution, most likely from the bacterial chromosome terminus after the origin of core histones (Cavalier-Smith, 1981). Such continuity between the bacterial and eukaryotic mechanism was literally vital, so centromere splitting arguably evolved from bacterial prokinetochore splitting (Cavalier-Smith, 1987b). This seems increasingly likely, as centromeres split by the destruction of cohesins, which form an evolutionarily related kleisin superfamily (Schleiffer et al., 2003) with bacterial Smc proteins (Soppa, 2001; Herrmann and Soppa, 2002; Schleiffer et al., 2003; Volkov et al., 2003) that bind to DNA as a ring-shaped structure (Volkov et al., 2003) like cohesins (Campbell and Cohen-Fix, 2002; Gruber et al., 2003). Thus the neomuran ancestor of eukaryotes already had Smc proteins for chromosome segregation and a core nucleosome particle of a H3/H4 tetramer (Cavalier-Smith, 2002a). What was new in the first eukaryote was a kinetochore for attaching microtubules (which originated from FtsZ, the bacterial segregator; Cavalier-Smith, 2002a) and tight and regular folding of the centromeric heterochromatin to orient them correctly (Cavalier-Smith, 1987b); the latter was probably the original function of heterochromatin. Chromatin folding at centromeres must also be tight and semi-rigid in order to withstand tension, important for the mitotic surveillance mechanism (Nasmyth, 1995). As hypoacetylation seems important in centromere maintenance, might this be a memory of an origin of their basic assembly mechanism before widespread chromatin acetylation evolved? From the beginning there would have been conflicting requirements between a tight, semi-rigid centromere folding for segregation and looser uncoiling during transcription. Evolution of CenpA and histones H2A and H2B perhaps helped make centromere folding tighter.
If much intercalary heterochromatin spread by intragenomic drift there would be quantitatively significant non-adaptive noise superimposed on adaptively significant changes in genome size, because constitutive heterochromatin has a quantitatively different impact on nuclear volume from euchromatin (as originally mentioned: Cavalier-Smith, 1978). Taking heterochromatin into account, and assuming that it does not unfold after telophase (its s = 0), the formula for nuclear volume becomes: V = apC(hf + Hbs), where h is the DNA/protein packing ratio for heterochromatin and H that for euchromatin, b the fraction of the genome that is euchromatin, and f the fraction that is heterochromatin. Putting b = 1 − f, V = apC(hf + Hs − Hfs). If h = H, probably a close approximation, the formula becomes V = apCH(f + s − fs).
Changes in the fraction, f, of heterochromatin inevitably alter genome size scaling with cell size simply because constitutive heterochromatin is more tightly folded. If f remains constant within a group but differs among groups, each will follow a scaling law with slope 1, but intercepts on the ordinates will differ, giving a series of parallel regression lines. If, however, f changed systematically with cell size within a group the slope would differ from 1. Erratic variation in f would increase point scatter around the line, not its slope. Fig. 1 illustrates these considerations. The main regression line U is for unicellular eukaryotes with negligible amounts of heterochromatin (possibly none in dinoflagellates, although I should not be surprised if they retained CenpA and other histones at least for their centromeres, and only very tiny amounts in yeasts, diatoms, amoeba and typical green algae). The dashed line is the regression line for meristem cells of herbaceous angiosperms, which have substantial amounts of heterochromatin but are also transcriptionally very active. The fact that nuclear volumes in both root and shoot meristems also scale with genome size with a slope of 0·826 not 1·0 (Fig. 3: Baetke et al., 1967) implies that the ratio of condensed chromatin to euchromatin is not invariant among the 30 taxa, but increases somewhat with cell size (microscopical observations appear consistent with this)—or that s decreases slightly with size. In small plant genomes, lysine 9 of histone H3 is strongly methylated only in constitutive heterochromatin, but in larger plant genomes methylation is more widespread (Houben et al., 2003) and might therefore be involved in greater facultative chromatin condensation. In the unicellular cryptophytes, we found a slope for genome size versus cell size distinctly below 1 (0·74: Fig. 1); either the measurements of cell volume and/or DNA content are systematically biased with size or some chromatin packing feature varies systematically across the class. Possibly in cryptophytes f declines with cell size—evolutionarily comprehensible if there is selection for using DNA as a nuclear skeleton more efficiently in larger unicells than in smaller ones by decreasing the heterochromatin fraction.
Fig. 3.

Scaling of nuclear volume (means of root and shoot meristem cells) with DNA content in 30 species of herbaceous angiosperms. Data from Baetke et al. (1967). Slope 0·826. From Cavalier-Smith (1985a).
I once assumed that selection could keep heterochromatin to the minimum needed for centromeres and telomeres in all unicells undergoing binary fission; if that were true, they should all have negligible amounts of heterochromatin and scale quantitatively like dinoflagellates, diatoms and amoebae (Cavalier-Smith, 1980b). Contrary to that assumption, cryptomonads have substantial amounts of heterochromatin arranged around the nuclear periphery, just like most growing animal and plant cells; the fact that they have only slightly lower DNA/cell volume DNA ratios than plant meristems (Fig. 1: Beaton and Cavalier-Smith, 1999), but consistently higher ones than protists lacking heterochromatin (curve U) is thus simply explained. Exceptions to my earlier generalization that heterochromatin should be rare in unicells occur in several groups of protozoa: thecomonads (phylum Apusozoa: see Cavalier-Smith and Chao, 2003) and bodonids and trypanosomes (Spadiliero et al., 2002) (both kinetoplastids, phylum Euglenozoa; it was previously known that their relatively close relatives the euglenoids had histone-containing chromosomes visible as chromosomes in interphase, like the histone-depleted chromosomes of Peridinea). It now seems that protozoa and unicellular algae are divisible into two groups; those with almost no heterochromatin visible in interphase (e.g. many Amoebozoa and Metamonada)—the classical vesicular nucleus of Raikov (1982)—and those that do not look significantly different from animal and plant nuclei, e.g. bodonids and even the tiny choanozoan cell Ministeria (Cavalier-Smith and Chao, 2003).
Protozoa with large masses of well-developed peripheral heterochromatin are scattered so widely across the tree (Fig. 2) that I now suggest that this was actually the ancestral state for eukaryotes and arose as a cortical nucleoskeletal shell of heterochromatin in the earliest eukaryotes. The very sparse, swollen chromatin typifying fungi and most groups of algae other than cryptomonads may be derived specializations to economize on DNA. I suggest that the key factor may have been phosphate economy and loss of phagotrophy. The first eukaryotes were phagotrophs that got lots of phosphate from their prey; both from its RNA and phospholipids, so phosphate would seldom be limiting. Fungi and algae that evolved cell walls gave up phagotrophy, making it advantageous to reduce DNA/nuclear volume ratios by reducing f to conserve phosphate. Algae that evolved walls had to abandon phagocytosis but those that evolved a complex pellicle instead (like dinoflagellates, euglenoids and cryptophytes) or retained a softer surface (like some chlorarachneans) could retain phagocytosis, like some cryptomonads, and might therefore retain a peripheral heterochromatin shell as their major nucleoskeleton. The larger-celled Amoebozoa may have been able to give up the use of a cortical skeleton of condensed chromatin because they evolved a much more complex and rigid nuclear lamina than any other protists except the aberrant dinoflagellate Noctiluca, which also lacks both heterochromatin (unlike more primitive members of the phylum Myzozoa to which it belongs: Cavalier-Smith and Chao, 2004) and interphase condensed chromosomes (unlike its sisters the Peridinea). This hypertrophied nuclear lamina probably evolved as protection against shearing damage caused by the exceptional development of amoeboid cytoplasmic motility of Amoebozoa.
The widespread presence of heterochromatin in vascular plants is probably not simply an inherited ancestral state, as most green algae have relatively little. It is more likely a reversion to it, probably related to a need for substantially different nuclear volumes at different stages of the life history (Cavalier-Smith, 1980a, 1982a), which arose after the origin of a vascular system led to large cell size increase (see later section). Animals also need different nuclear volumes in different differentiated cell types—met by controlling the degree of heterochromatinization and transmitted by epigenetic inheritance. The latter is visually obvious in heterokaryons between mammalian cells (with the same genome size) but different average nuclear size, e.g. lymphocytes with smaller denser nuclei (because they have smaller cytoplasm: see next section) and macrophages with larger nuclei and looser chromatin (Harris, 1970). Such epigenetic inheritance across somatic cell generations is well accepted (Grewal and Moazad, 2003). It seems that animals and plants independently recruited the ancestral heterochromatinization process invented by unicells for ordinary cell cycle purposes to make substantial chromosome segments, sometimes whole chromosomes as in the inactive X in female mammals, facultatively inactive during development. Although heterochromatinization machinery is very well conserved among animals, fungi and plants, including use of non-coding transcripts RNAi (Gendrel et al., 2002; Johnson et al., 2002; Soppe et al., 2002; Hennig et al., 2003; Lehnertz et al., 2003; Stevenson and Jarvis, 2003; Tamaru et al., 2003; Tariq et al., 2003), the uses to which it has been secondarily put may be quite different and need not be conserved (Gaudin et al., 2001; Kotake et al., 2003). Their unicellular common ancestor would have had no distinction between germ line and soma; its only cell differentiation would have been alternation between naked vegetative growth by phagotrophy and dormant walled cysts, plus associated sexual differentiation (switch to gametic and meiotic states). Possibly chromatin silencing by heterochromatinization is involved in these switches, but the only functionally necessary epigenetic inheritance would have been the differentiation of centromeric heterochromatin with CenpA and any needed for selective attachment of centromeric and telomeric heterochromatin to the nuclear lamina.
The concentration of many potentially harmful transposable elements in heterochromatin (Vershinin et al., 1995; Dasilva et al., 2002;) has stimulated the idea that cells may also use it to inactivate such harmful genetic parasites phenotypically. However, such genetic parasites may simply find it easier to accumulate in such regions (their lower recombination favours this: Charlesworth, 1988) or specifically target themselves there because selection against them is then weaker. SINES preferentially insert into MARs in Brassica (Tikhonov et al., 2001). It pays transposons to target such conserved non-genic regions present at above random concentration. Nonetheless the idea that cells can protect themselves against selfish DNA is well-founded, the clearest example being the RIP mechanism that Neurospora uses to destroy repeated DNA (Galagan et al., 2003).
THE NUCLEAR LAMINA AND ITS EVOLUTIONARY ORIGIN
Clearly, the nuclear skeleton consists not only of the chromatin mass but also of the nuclear lamina, which is firmly bound to its surface and mediates the attachment of the nuclear membranes to the DNA (Gerace and Blobel, 1982). It has only been well studied in animals, in which a meshwork of filaments, made of lamin proteins, are attached internally to chromatin and externally to a suite of integral membrane proteins embedded in the inner membrane of the envelope (Fig. 4). Lamins are coiled-coil rod-like proteins with a marked ability to form dimers and possessing N and C-terminal globular domains like other members of the intermediate filament superfamily to which they belong (Gruenbaum et al., 2003). Although they are concentrated in the nuclear lamina they also permeate the interior of the nucleus and can bind to MARs of DNA (Paddy et al., 1990). Mutations in lamins cause numerous human inherited diseases (Mounkes et al., 2003). Lamins and their attachments to DNA are dramatically reorganized during mitosis, which is open in animals, i.e. the nuclear envelope fragments into vesicles. The chromatin and the lamins therefore together form a two-phase nuclear skeleton that can exist in two mutually exclusive states: an interphase nucleus with peripheral inactive heterochromatin and an internal transcribed region of more dispersed euchromatin, both attached to lamin proteins, and mitotic chromosomes with all the chromatin arranged in the form of a highly condensed rod around a central core (Dietzel and Belmont, 2001). Several components of the inner nuclear membrane and the lamina have specific binding properties for DNA (Stierle et al., 2003), histones, telomere proteins or for specific heterochromatin proteins, and play a role in initiation of replication (Martins et al., 2003). An excess of the lamin-binding fragment of the inner membrane protein LAP2 inhibits interphase nuclear growth (Yang et al., 1997), I suggest by binding to the lamina so much as to make it too rigid to be expanded by chromatin swelling. In animals actin and a protein that binds to it also seem essential for nuclear assembly (Krauss et al., 2003).
Fig. 4.
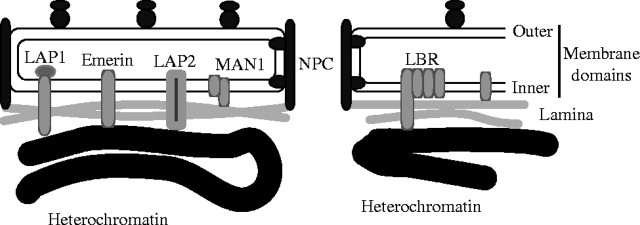
Proteins involved in the attachment of chromatin to the nuclear envelope in animals. The outer membrane domain of the envelope is ordinary rough endoplasmic reticulum (RER) with bound ribosomes; the inner membrane domain of the envelope is a specialized domain of the RER, separated from the ribosome-binding region by the integral membrane proteins that attach the nuclear pore complexes (NPC). A considerable variety of amphipathic integral membrane proteins are embedded in the inner membrane domain of the envelope and several mediate attachment to the underlying lamina and chromatin. The N-terminal regions of one phylogenetically widespread family of inner membrane proteins that includes lamina-associated protein2 (LAP2), emerin, and MAN1 share a 43-residue subterminal LEM domain (so called after their initials). All three bind to the nuclear lamina, while LAP2 and emerin also bind chromatin directly. The lamin B receptor (LBR) belongs to a different family of sterol biosynthesis enzymes found in the ER and can bind both the lamina and DNA in addition to its biosynthetic enzymatic activity. Lamin filaments also permeate the interior of the nucleus, as part of the inner nuclear matrix and can bind to specific matrix attachment regions (MARs) on the chromosomes. During mitosis the lamina is disassembled and the inner matrix is reorganized to form chromosomal cores.
It makes no sense to think of a nuclear skeleton independent of chromatin and DNA, except in the unique case of the late oocytes of animals with giant eggs, where chromosomes are temporarily detached from the lamina and the nuclei swell immensely more than is normally possible. To allow this, amphibians have evolved a unique oocyte lamin not expressed in somatic cells and absent from mammals or birds. As explained previously (Cavalier-Smith, 1991b), the sizes of these oocyte nuclei are therefore irrelevant to the skeletal DNA solution of the C-value paradox, contrary to my initial discussion (Cavalier-Smith, 1978).
In previous discussions of the origin of the nucleus, I assumed that the origin of the lamina was the key step in the origin of the nucleus and the novel selective forces it imposed on DNA (Cavalier-Smith 1987a, 1982b, 1988). Although electron microscopy reveals a nuclear lamina in many protozoa, evidence that lamins are found in any eukaryotes other than animals has been slow in coming and is still rather primitive. Antibodies against animal lamins stain similar-sized proteins on Western blots and/or the nuclear lamina in onion (Minguez and Moreno Diaz de la Espina, 1993) and other plants (but also stain more interior regions), and a variety of protozoa: the slime mould Physarum (phylum Amoebozoa), Euglena, Giardia (Lang and Loidl, 1993; Wen, 2000). However, no genes for the stained proteins have been identified, so sequence homology is unclear. Database searches are relatively ineffective at identifying constituents of the lamina outside animals because, although lamins are structurally highly conserved among animals from hydra to man, their amino acid sequences evolve rather rapidly and other coiled-coiled structural proteins, notably kinesins and myosins that also evolve relatively fast, can be confused with them. Though lamins are frequently claimed to be absent in fungi, protists and plants, I suspect that all major eukaryote groups have coiled-coiled nucleoskeletal proteins, some concentrated in the nuclear lamina and that their sequences simply diverge too fast to be recognized across kingdoms.
Despite sparse studies, two classes of coiled-coil proteins associated with the plant nuclear lamina have already been found by seeking proteins that bind to the envelope or matrix. A MAR-binding protein, MFP1, is well conserved among dicots and located in the nuclear lamina and/or thylakoids (Gindullis and Meier, 1999; Harder et al., 2000; Samaniego et al., 2001; Jeong et al., 2003). It has weak similarities to myosin heavy chains, but not obviously lamins. The FPP family was identified by binding to a nuclear membrane-associated protein and is well conserved within dicots but only weakly between dicots and monocots (Gindullis et al., 2002). A coiled-coil protein not obviously related in sequence to lamins or either plant protein has also been found in trypanosomes (phylum Euglenozoa on the plant side of the basic bifurcation: Fig. 2). It seems unlikely that the ancestral nucleus had no lamina and that coiled-coil proteins with dimerization potential and terminal globular domains able to bind both nuclear envelope proteins and DNA were recruited independently in animals, plants and trypanosomes. More likely coiled-coil proteins able to bind to both the newly internalized proto-ER membranes and protochromatin were recruited very early in evolution and diversified into various coiled-coil families as major lineages diverged. I suggest that the lamin/intermediate family proteins, myosins and kinesins, coiled-coil proteins of centrosomes and the Golgi diversified simultaneously in the stem eukaryotic lineage that gave rise to the eukaryote cenancestor. A nuclear envelope without a lamina but with the membrane bound to the chromatin directly by some of its integral membrane proteins would be less strong than one with coiled-coil proteins forming a peripheral skeleton. As protection from shearing forces was probably of key selective significance for the origin of the nucleus, the cenancestor probably had at least a proto-lamina. If a lamina is truly absent in yeast this is probably another secondary loss (like that of intermediate filaments).
Details of how the lamina evolved and functions are less important than the fact that attachment of the nuclear envelope to interphase chromatin began with the first eukaryote and has been unavoidably inherited ever since. This inescapable constraint on nuclear evolution is the primary reason why genome size evolves and scales with cell size so differently in nuclei compared with bacteria, mitochondria and chloroplasts. As already stressed, the universality of DNA attachment to the lamina/envelope in interphase growing cells means that nuclear volume cannot change substantially in evolution without changing genome size.
THE NUCLEOTYPIC SKELETAL FUNCTION OF DNA IS SIMPLE, DIRECT AND UNAVOIDABLE
From an evolutionary viewpoint DNA has the advantage as a skeletal material that merely changing its amount by deletion or duplication changes the skeleton size heritably, far more easily, and universally adaptably up and down almost without limit, than any other mechanism that I can conceive. Is there really a better way, and one easier to evolve? We must stop thinking of selection as a creator, designer or engineer. It's just a name for differential death or reproduction of entities created by physical forces from what already exists.
I am reasonably sure that the experimentally proven role of DNA in nucleating assembly of nuclei and determining the volume range possible for them is the key nucleotypic function of total nuclear DNA. Even if it is not, it at least has the merit of explaining quantitatively the correlation between genome size and cell volume and in being grounded in solid cell biology. The same cannot be said of most (any?) other supposed nucleotypic functions, e.g. Vinogradov (1998) suggested that DNA buffers ‘the effect of fluctuations in intracellular solute composition on operation of nuclear machinery’. I could express the opinion that proteins could achieve that vague ‘function’ equally well without involving DNA as he did for the skeletal theory. But a more powerful criticism is twofold: the ‘function’ seems purely imaginary and it totally fails to explain why large cells have more DNA. One might expect salt concentrations of larger cells to be less prone to fluctuate and more easily maintained by cell-surface ion pumps in the face of environmental fluctuations because of a more favourable surface to volume ratio, so would need less, not more intranuclear ‘buffering’. Vinogradov claimed that having more ‘buffering’ DNA would save energy by ‘allowing less precise control of nuclear machinery’ and ‘solute compositions’, but the logic and empirical basis of this assertion is obscure. He also overlooks that what we have to explain is not just repetitive DNA but also unique secondary DNA. Whenever and however DNA increases substantially it will start as repetitive; eventually most of it will inexorably diverge to uniqueness through mutation pressure. For the sequence-independent main bulk of skeletal DNA, whether it is repetitive or unique is immaterial—the size of the repetitive fraction simply reflects the rate of genomic turnover and the historical timing of increases and decreases and is not their driving force.
WHY EUKARYOTE GENOME SIZE IS SO VARIABLE
Nuclear volume is probably functionally important for initiation of DNA replication and the transition from G1 to S: replication appears to initiate and terminate at the nuclear periphery and require a critical nuclear volume for onset (Nicolini et al., 1986); G1 nuclear volume growth must depend on concerted expansion of both chromatin and the nuclear envelope. But the significance of nuclear volume for the evolution of genome size does not depend on this, but on its fundamental significance for transcription, RNA processing and export, the rates of which must universally be adjusted to the rate of cytoplasmic protein synthesis. This unavoidable need for an optimal nuclear/cytoplasmic (karyoplasmic) ratio to allow balanced growth of actively growing and dividing eukaryotic cells means that larger cells must evolve proportionally larger nuclei. They can do that only by having larger genomes or unfolding DNA more; the former is mutationally much easier and quantitatively less limited and therefore predominates during evolution. Selection for economy means that smaller cells must have smaller nuclei. Mutations expanding or contracting the genome are always occurring with high frequency and will be selected long before any changing DNA folding patterns radically occur. Those are the fundamental reasons why genome size increases in larger cells and decreases in smaller ones. Bacteria, chloroplasts or mitochondria have no nuclear envelope attached to their DNA and no segregation of RNA and protein synthesis in two fundamentally different compartments; that is why their genome evolution follows different scaling laws: there is no selection for larger genomes in larger bacterial cells. Before discussing the selective forces favouring larger or smaller genomes further, I shall outline the central logic of balanced growth and invariant karyoplasmic ratios, as many biologists are unfamiliar with or misunderstand this essential basis for understanding the expansion and reduction of nuclear genomes.
IMPORTANCE OF THE KARYOPLASMIC RATIO FOR PROLIFERATING CELLS
During balanced growth, cells undergoing binary fission must double the number of every kind of RNA and protein molecule every cell cycle. If a species has a cell 100 or 1000 times larger than another, but is otherwise identical, it must make 100 or 1000 times as many copies of every molecule every cell cycle. This must be true for every molecular species for which the smaller cell has more than a single copy per cell and which are present in the nucleus or cytoplasm; the sole exceptions are molecules forming the nuclear envelope and plasma membranes themselves, which would scale with the 2/3 power only of cell volume, not isometrically (if their composition was unchanged); DNA molecules would typically just be longer rather than more numerous. If there are any RNA or protein species that even the largest cells require in only single copies, which is very doubtful, this requirement would not apply to them; but if such molecules exist they would constitute such a small fraction of total RNA or protein that their contribution to cell mass would be quantitatively insignificant compared with those present in hundreds or billions of copies (imagine that there are as many as 2000 such genes encoding single-copy messengers of average mass 500 kD; the total mass of all these mRNAs would be only about 10−8 of the total mass of a human liver cell, an utterly trivial fraction). Therefore larger cells necessarily make proportionally more of every kind of multi-copy molecule (even those needed in only two copies by the smallest cells) if their composition is the same as smaller ones. If we compare cells of the same type, e.g. unicellular algae of the same class, embryonic cells of vertebrates or meristematic cells of plants, they will have essentially the same composition irrespective of their size and therefore will all be making total RNA and total protein in the same ratio.
A cell that that is 100 or 1000 times larger does not have a cell cycle 100 or 1000 times longer; it is longer but only marginally so. Therefore larger cells make proteins and RNA at massively higher absolute rates than do smaller cells. In both, the amount of their biosynthetic machinery is optimized for their cell size by selection. In the steady state the ribosomes and RNA polymerases are probably working flat out at maximal rates. Therefore for larger cells to make proteins and RNA at higher rates the cytoplasm must have proportionally more ribosomes (as is observed ultrastructurally), mRNAs, tRNAs, elongation factors and amino acid activating and synthesising enzymes and nucleotide and purine, pyrimidine, ribose and nucleoside synthesising enzymes, as well as correspondingly more intermediary-metabolic and energy-generating enzymes; the nucleus must have correspondingly more RNA polymerases, transcription factors, spliceosomes, mRNA capping enzymes and transport factors. In the steady state, the increase in the number of nuclear enzymes must be numerically the same as that for cytoplasmic ones when comparing cells that differ 100, 1000 or even 100 000 times in volume. Each enzyme or macromolecular assembly occupies a finite volume. Therefore one cannot increase the numbers of the nuclear RNAs and proteins in larger cells without increasing the volume of the nucleus by exactly the same factor as the cytoplasm, given that overall macromolecular concentration would already have been maximized in the smallest cells. The karyoplasmic ratio has to be essentially invariant across the 300 000-fold range in cell volume. This is an inescapable conclusion from steady-state kinetics and the fact that cellular machinery actually occupies volume. But to many biologists it is such an unfamiliar mode of thinking that they want somehow to escape its unavoidable consequences. The invariant karyoplasmic ratio is a basic fact of cell biology established for more than a century (but forgotten by two generations of textbooks, which are insufficiently quantitative) and a necessary consequence of the optimization of growth processes by selection for rapid and efficient cell reproduction. One cannot escape the need for larger nuclear volumes in larger cells by increasing concentrations. In cells of all sizes the active macromolecules occupy 25–40 % of the total space (the rest is vital solutes: water or fluid lipids) it would be physically impossible to increase concentrations even 3-fold, let alone 300 000-fold.
Gregory (2001) objects to such arguments as these on the grounds that ‘a great many protein products are not required in amounts proportional to cell volume’, but does not give a single example of such proteins or any citations to support the claim or attempt to estimate how quantitatively significant such exceptions might be—if they exist at all. Consider the plasma and nuclear membrane proteins that, as mentioned above, are the sole obvious exception to the isometric scaling argument, and suppose they do scale with the 2/3 power of cell volume. In a medium-sized cell 20 µm diameter with a nucleus 4 µm across and membranes 10 nm thick, the volume of the cell would be about 4000 fL (=µm3) and of the nucleus about 32 fL; but the volume of the plasma membrane would be only 13·6 fL and that of the double membranes of the nuclear envelope only about 0·5 fL. Thus the fraction of the total volume occupied by these membranes would be only 0·35 %. Assuming they have the same protein concentration (dissolved in lipid rather than water) as the cytoplasm and nucleoplasm, they would only use a similar fraction of cytoplasmic protein synthesis. If such a cell increased 10-fold in cytoplasmic and nuclear volume, the total protein increase would be 10·035-fold, on the assumption that membrane proteins increased isometrically but only about 10·017-fold if they scaled according to the increased surface area, i.e. about a 0·017 % difference from the simple assumption that scaling of all proteins is isometric. One might expect purely structural proteins in the nuclear envelope and plasma membrane to scale with the 2/3 power only of cell volume, not isometrically, but functional transport proteins in these membranes could become relatively more numerous and densely packed in the membrane in larger cells to cope with the extra demand of the increased volume and therefore be closer to isometric. In practice, therefore, the discrepancy from my simple assumption caused by these membrane proteins would probably only be about 0·01 %, far too small to be picked up by actual experimental measurements and therefore essentially irrelevant to the argument, which is why I ignored it in previous discussions.
Gregory (2001) also claims that cells in organisms with fewer genes should need smaller nuclei than those with more genes but the same cell size, and therefore that the karyoplasmic ratio should be inversely related to gene numbers rather than invariant. This argument is fallacious; if the cell size is indeed the same, then under balanced growth the copy number of each gene product must, on average, be higher in the cytoplasm of the one with fewer genes (assuming all are expressed and the total protein concentration is the same). Therefore the RNA synthesis needs of the nucleus will be correspondingly greater, as will its volume needs. The number of genes is irrelevant to these arguments. For a given total protein mass the synthetic needs are the same; it does not matter whether you need more copies of fewer different proteins (or their messengers) or fewer copies of more. It is the mass balance that matters.
In practice cells that are 100 or 1000 times larger do not actually make molecules 100 or 1000 times faster (number per cell per unit time); the factor of increase is somewhat less than would be necessary to maintain the cell cycle at the same length, so larger cells have somewhat longer cell cycles. Although their absolute growth rates are far greater than those of smaller cells, their relative reproductive rates are somewhat lower; thus for a 1000-fold increase in cell volume there is, on average, only about a four-fold increase in doubling time, so larger cells make things at only about 250 times the rate of 1000× smaller ones. This means either that it is not economic to increase rates enough to avoid lengthening the cell cycle (the cost could exceed the gain using the biological currency of grandchildren), or that there are other limits than synthesis rates as cells become larger. The most basic such extra limit, recognized for centuries, is the decreasing surface to volume ratio. Nutrient and food uptake/intracellular transport could become limiting as surface area increases with the square of the cell's radius, whereas need is set by mass and increases with its cube. However, growth rates do not scale with the one-third power of volume, as should apply if surface volume ratios were the dominant factor, but decline more gently with size; some studies (Shuter et al., 1983) suggest a quarter power law as predicted by some physical considerations (West et al., 1997, 1999, 2002; Brown et al., 2002), whereas others indicate a still shallower decline that varies in magnitude among taxonomic groups (Cavalier-Smith, 1985a). This suggests either that import rates are not generally rate-limiting or that cells compensate for extra size by putting more transporters per unit area into the plasma membrane or extra pores in the nuclear envelope. Unless copy number increases, gene dosage could become limiting in larger cells. It is well known that rRNA gene numbers do increase with cell volume. Alhough there is no clear evidence that protein genes also generally multiply, there are instances where exceptional demands have led to their copy number increasing (e.g. histone genes in animals that undergo rapid cleavage), so it is possible.
The fact that absolute growth rates do not increase sufficiently in larger cells to avoid some increase in doubling time does not affect the argument for an invariant karyoplasmic ratio. It may mean that larger cells could become somewhat more dilute in ribosomes; one has some impression from examining electron micrographs that this may to some extent be true, but if it is, the scale is not dramatic and other factors also could be involved, e.g. a possible requirement for devoting relatively more space to the cytoskeleton than to metabolism because of a greater need for mechanical support or transport. To the extent that cell composition changes with cell volume, scaling may not be precisely as expected by the simple theory emphasizing relative biosynthetic rates in nucleus and cytoplasm. But it is probably approximately correct. There are probably bigger experimental errors in measuring scaling than deviations caused by such complications. The real prediction is that the ratio of the biosynthetically active masses of the nucleus and cytoplasm and the volume fraction that they occupy should be constant. Taking total volume as a surrogate for this volume fraction is a practically convenient oversimplification, not a theoretical assertion. One factor that could have a larger effect is the presence of large cytoplasmic vacuoles, as in diatoms. If the fraction of the cell occupied by such vacuoles is invariant, the karyoplasmic ratio should be invariant within a group possessing them, but significantly lower (or the cytonuclear ratio higher) than in ones lacking them. As less organic synthesis would be needed per unit volume per cell cycle, cell doubling times should be higher that for non-vacuolate cells of the same size; comparably sized diatoms do multiply faster than non-vacuolate dinoflagellates (Cavalier-Smith, 1985a, fig. 4.11), but as they are diploid, not haploid, their gene dosage would be greater too. One would also expect that algal cells, where the chloroplast can occupy more of the cell than the nucleus but have a much lower ribosome density than the cytoplasm, might lead to a detectably different karyoplasmic ratio (and therefore DNA/cell volume ratio). Likewise, shifts in the fraction f of inactive heterochromatin should and do change the observed karyoplasmic ratio. Such changes are expected by and do not contradict the theory.
UNIVERSAL SELECTION FOR ECONOMY: WHY TOO MUCH DNA IS HARMFUL
Having explained why larger cells need more DNA, let us see why smaller ones need less. The argument is simply the converse. If cell size declines, the nucleus will be too large compared with the cytoplasm for optimal efficiency and the drain on the cell's resources for replicating all that extra DNA and making all the histones it needs will be uneconomic. There is universal selection for economy that applies equally to bacteria and eukaryotes. Therefore, as cells evolve a smaller size, deletions will be selectively favoured over duplications. The claim that the skeletal theory cannot explain genome reductions in smaller cells (Gregory, 2001) is puzzling: he seems to have overlooked this whole argument about economy, which I have made repeatedly (Cavalier-Smith, 1980a, 1985a, d, e, 1991a, 1993; Cavalier-Smith and Beaton, 1999). So let's repeat the point: the spectrum of eukaryote nuclear genome sizes results from a trade-off between universal selection for economy that in all organisms tends to minimize non-coding DNA amounts, and selection in larger eukaryotic cells for enough extra non-coding DNA (skeletal DNA) to function together with genic DNA in making nuclei the right size to maintain an invariant karyoplasmic ratio. The argument is that there is universal selection for economy and universal selection for rapid reproduction, but that the conflicting advantages of larger cells can offset these to differing degrees; the balance between these opposing selective forces is necessarily made at a different genome size in organisms that have different cell volumes (Cavalier-Smith, 1978).
Genomes become smaller by successive deletions and the selective advantages of the resulting smaller genomes. DNA has four inherent disadvantages, all of which get worse with increased genome size. Making it uses valuable nutrients, of which phosphate is particularly scarce in the biosphere, and scarce energy. It occupies space, thus competing with other functions, and it is prone to mutate so as to kill the cell or reduce its viability or fecundity. For all four reasons, the less DNA in the genome the better, unless it has compensating benefits. Therefore there is universal selection to keep genomes as small as possible without losing those benefits. Economies in energy, nutrients and space are more immediate benefits of genome reduction than reducing future harmful mutations, so must be the main reasons for genome reduction in smaller cells. In bacteria and their enslaved descendants, mitochondria and chloroplasts, where the genome is typically a single replicon, smaller genomes also save time as well as space, by reducing overall replication time. In many bacteria, replication time may be rate-limiting to the cell cycle so this may be a further selective force, as might intracellular competition for rapid genome duplication for mitochondria and plastids (Cavalier-Smith, 1985e). But in nuclei (including nucleomorphs) neither applies, as genomes comprise many replicons and overall genome size need never limit cell cycle length, and nuclei are subject to fundamentally different cell cycle controls that ensure that only one replicates per cycle, so they are not in replicative competition (Cavalier-Smith, 2003a). Some random deletions will be selected against because they remove or damage valuable genes, but others are bound to occur sooner or later, enabling selection to eliminate virtually all secondary DNA when removal is advantageous, as it is in the smallest cells.
It is a pity that this has to be a subtle argument, based on five major principles of cell and evolutionary biology (principles 1–4, 6), and therefore more difficult to grasp than a catchphrase like ‘selfish DNA’ that gives the illusion of a simpler explanation but actually avoids all the important issues, but that is how it is. The weakest of the universal reasons why too much DNA is harmful is probably the fourth: mutational load, for selection against this is less effective (because it only affects the future, and harmful mutations are relatively rare) than selection for economy, which affects every cell cycle; even a 10−5-fold improvement in either economy or reproductive speed could spread relatively fast through the population.
One should not suppose that selection normally acts on individual indels; typically it would be mass selection acting simultaneously on many depending on their net effect, like mass selection for removing mildly deleterious alleles (Crow, 1992).
EXAMPLES OF GENOME MINIATURIZATION AND EXPANSION IN PROTISTS
Four examples graphically illustrate the principles discussed above.
Virtually complete elimination of non-coding DNA has actually occurred in microsporidia, anaerobic intracellular parasites, mainly of arthropods. They evolved from aerobic fungi by converting mitochondria into tiny relict organelles, the mitosomes (Williams et al., 2002), now devoid of genomes and energy metabolism and retained only for making iron sulphur centres, and by evolving a novel apparatus for injecting themselves into host cells (Cavalier-Smith, 2000b; Keeling and Fast, 2002). Other cytoplasmic organelles were reduced to almost nothing except for ribosomes, also miniaturized; even vegetative cell walls were lost, although spores retain chitin walls. Microsporidia now have the smallest genomes of any eukaryotes, although some are several-fold larger than others. Their ancestors were probably zygomycotine fungi (Cavalier-Smith, 2000b; Keeling, 2003), which lack cilia and themselves evolved from chytridiomycete fungi with cilia, losing about 1000 genes in the process. Encephalitozoon cuniculi probably has at least three times fewer genes (∼2000, with 11 spliceosomal introns only) and 10–100 times less DNA than its protozoan ancestors. It lost so much DNA because intracellular parasitism allowed it to dispense with many functions and required a very small cell size to maximize spore output from a fixed mass of host tissue. Their small cell size in turn imposed much stronger selection for economy in space and materials in the nucleus, by favouring mutations that reduce non-coding DNA. Microsporidia are sexual and potentially as prone to the spread of sexually transmitted selfish transposons as any sexual eukaryote, but selection for small cell size and economy not merely held this potentially expansionist force in check but reduced genome size more drastically than in other eukaryotes. It is notable that the very size of the proteins and protein-coding genes was significantly reduced (Vivares et al., 2002), so powerful is the ability of selection to pare down nuclear genomes, when that is advantageous. Size, economy and organismic selection rule in the evolution of genome size. ‘Selfish DNA’ is a strictly subsidiary, often irrelevant force.
Another example is Sporozoa, which exemplify the opposing selective forces that act on cell size and genome size in extracellular versus intracellular parasites. Two classes are strictly intracellular parasites, Coccidia (e.g. Toxoplasma) and Hematozoa (e.g. Plasmodium, the malaria parasites), and so also have exceptionally small genomes (25 Mb, 5300 genes: Gardner et al., 2002), but not as small as microsporidia (2·3–19·5 Mb) as they have retained mitochondria and a much more complex cell structure and significantly larger cell volumes. Their sister group is the gregarines, most being virtually extracellular, only the cell apex being stuck into the host cell—the rest of the cell being in the lumen of the host's gut. Gregarine cells are gigantic (up to 1 mm long)—among the largest of any eukaryotes, as are their nuclei (which can exceed 90 mm—far larger than human liver cells) and chromosomes—if it were measured, their genome size would probably be tens of thousands of times greater than that of coccidians and Hematozoa. The common ancestor of both groups was probably a small-celled intracellular parasite, and this vast genomic expansion probably took place after the first gregarine evolved a capacity to live mainly in the gut and thus grow almost without limit—in marked contrast to the sister group that retained intracellular parasitism and probably even reduced their genome size further (Cavalier-Smith, 2004b). Organismal selection for gigantic cells and nuclei in gregarines and tiny cells and nuclei in strictly intracellular sporozoa readily explains, in conjunction with the skeletal DNA and invariant karyoplasmic ratio principles, the dramatic differences in their genome size, which purely mutational/selfish theories emphatically cannot.
Two further examples show even more decisively the power of selection to reduce genome size and eliminate excess DNA. These concern the miniaturized enslaved nuclei (nucleomorphs) of two groups of algae, cryptophytes and chlorarachneans (Cavalier-Smith, 2002c). Hundred of millions of years ago the protozoan ancestors of each group ate a eukaryotic algal prey but instead of digesting it, converted it into a permanent organelle complex from which they could tap photosynthate for their own needs. In both cases mitochondria, peroxisomes and Golgi apparatus of the enslaved alga were dispensed with but their chloroplasts were retained for photosynthesis, as were their nuclei as nucleomorphs and their plasma membranes as a novel kind of membrane—the periplastid membrane (Cavalier-Smith, 2003a). As the enslaved alga was a green alga in Chlorarachnea (phylum Cercozoa, kingdom Protozoa) but a red alga in cryptophytes (kingdom Chromista), these are two independent natural experiments in nuclear enslavement and dramatic nuclear genome reduction. Nucleomorphs have a typical nuclear envelope and multiply by division, probably with the help of spindle microtubules and relict centrosomes (Zauner et al., 2000). Yet they have the smallest nuclear genomes known: the cryptophyte Guillardia theta has only 551 264 nucleotides and the chlorarachnean Bigelowiella a mere 380 kb (6× smaller than the smallest microsporidian genomes), both spread across three linear chromosomes with telomeres, each so short that they may be single replicons (Douglas et al., 2001). As in microsporidia, some genes are shorter than in other eukaryotes and there is virtually no non-coding DNA: in Guillardia 44 genes actually overlap, so intense has been selection to reduce genome size.
What is most striking is that this tremendous genome reduction over many orders of magnitude occurred in nuclei that have coexisted in the same cell for hundreds of millions of years with former host nuclei that underwent no reduction! Indeed, in cryptomonads cell volume varies considerably from species to species, as does host nuclear genome size; DNA contents of the main host nucleus scale with cell volume in the same way as in all other eukaryotes, but the nucleomorph genome size is invariant with cell volume (Fig. 1: Beaton and Cavalier-Smith, 1999). Thus for hundreds of millions of years natural selection has prevented any increase in nucleomorph genome size since the original massive reduction, but has favoured increases in nuclear genomes in larger cells and/or decreases in smaller cells just like in other cells. Thus selection can reduce genome size in one nucleus and increase it in another in the very same cell. This provides compelling evidence that the expansion in the main nucleus was driven by positive selection for larger genomes (i.e. for a function of non-coding DNA) in the main nucleus. Since its genome size scales in essentially the same way with cell volume as in other cells, this strongly implies that all larger eukaryotic cells similarly benefit from having proportionally more DNA in their nuclear genomes, i.e. that there is a genuine universal function for nuclear non-coding DNA.
Population geneticists are obsessed with sex and prone to suggest that genomes will expand in sexual cases by transposon spread but not in asexual ones, e.g. it was suggested mitochondrial and plastid genomes became miniaturized because unlike nuclei they are asexual. Of course some do undergo recombination, yet in those that do the organelle genomes remain small—Chlamydomonas mitochondria have about the smallest, with no non-coding DNA. Not to be deterred by such ugly facts refuting the basic theory, some might still wish to ‘explain’ nucleomorph genomic contraction by the same discredited theory. Though sex is known in one cryptomonad, we do not know whether most are sexual or asexual or whether or not in the sexual species the periplastid compartment and the nucleomorphs and chloroplasts undergo fusion (as do Chlamydomonas chloroplasts: Cavalier-Smith, 1970) or not. Nor do we have any idea whether chlorarachneans are sexual or not. In my view, sex is probably totally irrelevant to the evolution of genome size: size matters but sex does not. One major, much-studied group with about 1000 large-celled species with large chromosomes in which sex is entirely unknown is the euglenoid protozoa; although it might be argued that euglenoid sex always occurs in private unlike with more exhibitionist protozoan groups, it would be special pleading to argue that we have simply not seen it. Euglenoids may actually have evolved large genomes without the help of selfish DNA; gene and chromosomal segment duplication are amply frequent enough to allow this, and it seems completely arbitrary to suppose that genomes can expand only by selfish DNA. Nor is it likely that selfish DNA necessarily causes expansion in the long term.
I have nothing against the idea of selfish DNA per se, having been first to invoke it to explain the origin of introns (Cavalier-Smith, 1978). Transposition pressure (a less anthropomorphic term for the main selfish DNA principle: Cavalier-Smith, 1982a) has a significant role in shaping the content of many genomes but only a very minor one in influencing their size. My original attempt to explain B-chromosomes in solely adaptive terms (Cavalier-Smith, 1978) was probably a mistake. I accept that most are probably selfish (Dhar et al., 2002; Gonzalez-Sanchez et al., 2003).
The cryptomonad nucleomorph genome has 12 tRNA introns totalling 36 nucleotides, and would almost certainly be better off without them, so it is probably at least 0·0065 % larger than optimal. It also has 17 spliceosomal introns of 42–52 nucleotides (showing that selection for transcriptional economy [Cavalier-Smith, 1991b] has kept their size down) and totalling 782 nucleotides; however, the fact that 11 are near the head of ribosomal proteins, like many of the few uneliminated ones of yeast (where some are functional), suggests that many, if not all may be functional. Actually, the optimal size for a nucleomorph genome is zero; the only reason why cryptophyte cells retained this genome is to encode over 40 genes for chloroplast proteins that it actually needs. It has a genetic and metabolic burden of over 420 other nucleomorph genes just to provide housekeeping functions to allow this essential core to be expressed (and itself to be replicated and segregated) and the ∼40 proteins to be imported into the chloroplast. Goniomonas, the sister of cryptophytes and the only cryptomonad that lost its plastid, could and did therefore dispense with the entire nucleomorph and periplastid membrane. In chromobiotes, the sister group of cryptomonads, an optimum of zero was achieved differently in the common ancestor of heterokont and haptophyte algae by transferring these 40 genes to the main nucleus (as alveolates, the sisters of chromists, did independently), enabling loss of the entire nucleomorph genome, although its envelope membrane persists as the periplastid reticulum (Cavalier-Smith, 2003a). Membrane heredity can be more long-lasting than genomes, as also shown by the persistence of the former mitochondrial envelope in microsporidian mitosomes after their mitochondrial genome reached its optimal size of zero.
Thus chromobiotes, Goniomonas and alveolates independently achieved the ultimate nuclear (nucleomorph) genome reduction to zero: selfish DNA for all its vaunted powers to expand genomes could do nothing to stop it. By transferring 40+ nucleomorph genes to the nucleus the ancestral chromobiote and alveolate replaced some of their non-coding skeletal DNA, as genic DNA is equally good at bulking out the nucleus. This saved the entire replication cost of a 0·5 Mb nuclear genome plus the transcriptional and translational costs of over 400 proteins. Over more than 500 million years cryptophytes failed to achieve this, probably because purely by chance they never had the requisite mutations to retarget these few proteins successfully. Thus phylogenetic inertia through lack of the right mutations for optimization can burden a cell with more DNA than is ideal; this is also the explanation of the persistence of so many useless introns in most eukaryotes (oddly overlooked by Vinogradov, 1999). Neither genomes nor organisms are actually optimized, but selection does its best to do so with the mutations that chance supplies.
Non-optimization is well shown by the 380 kb nucleomorph genome of the chlorarachnean Bigelowiella, which is riddled with bonsaied introns of 19 ± 1 nucleotides. The fact that this smallest known nuclear genome also has the highest known intron density and the shortest introns witnesses the extreme power of selection to whittle down useless non-coding DNA almost to nothing, and its inability to succeed totally without the right mutations (absolutely precise 19-nucleotide deletions). It was apparently easier to modify the splicing mechanism to allow shorter introns than ever before than to eliminate these introns (Cavalier-Smith, 2002b, c, 2003); actually we don't know they are useless, but I predict that someday most will be shown to be.
CILIATE NUCLEAR DIMORPHISM: HOW TO COMBINE LARGE CELLS AND RAPID GROWTH
Ciliate nuclear dualism is profoundly significant for understanding genome size evolution as it dissociates genome size from the DNA content of transcribed nuclei, and exemplifies how functional cell-biologically-based and selfish-DNA-style population genetic arguments are often both needed to understand genome evolution. Ciliates are alveolate protozoa that evolved unusually large cell sizes entirely differently from gregarines, with radically novel consequences for their genomes. Their ancestors were biciliate predators similar to the myzozoan Colponema. By multiplying cilia in numerous longitudinal rows held in a complex cortical architecture by underlying cytoskeletal elements, the ciliate ancestor could swim faster than flagellates and grow much larger. Other flagellates similarly expanded size by multiplying cilia (e.g. the heterokont Opalina, the apusozoan Hemimastix) but failed to achieve similar evolutionary success, for two reasons. By evolving a ventral mouth and gullet, as in Paramecium, with specially differentiated ciliary rows to suck in bacteria, ciliates could swim fast through the medium engulfing bacteria at unprecedented rates, thereby growing faster than the mouthless opalinids and hemimastigids. The percolozoan Stephanopogon also multiplied cilia and evolved a mouth, but still did not diversify like the ciliates, lacking the capstone to ciliate architectural success: nuclear dualism—segregating the genetic and physiological functions of the nucleus into separate organelles: non-transcribed diploid germ line micronuclei, which only replicate and carry out mitosis and meiosis, and somatic macronuclei that transcribe RNA and govern protein synthesis (and in most ciliates have mitotic cycles).
By multiplying genomes manyfold in the somatic macronuclei, DNA content and nuclear volume expanded massively without increasing genome size. It is the size of the multiploid transcribed macronucleus that scales with cell volume and follows the invariant karyoplasmic ratio law, not the size of the germ-line genome. Accordingly, ciliate genome sizes are orders of magnitude lower than in any other eukaryotes per unit cell volume—the exception that proves the rule of the causes of the genome size spectrum in eukaryotes: the nucleoskeletal function of DNA and optimization of the karyoplasmic ratio. The term multiploidy (Cavalier-Smith, 1985a) signifies that macronuclear genome multiplication is not simple polyploidy. Some sequences not needed for somatic functions are eliminated and the remaining DNA is often rearranged by recombination during macronuclear formation after sex, when one meiotic product undergoes multiploidization. Multiploidization not only increases nuclear volume and ensures a proper karyoplasmic ratio in a giant cell; by increasing gene dosage it removes a limitation to faster growth, allowing high absolute rates of transcription and translation. Ciliate cells can be very large and have fast growth rates (incompatible requirements for other eukaryotes), thereby outcompeting other large cells; they diversified into thousands of species taking all manner of different prey by modifying their complex mouthparts, dominating their adaptive zone (Cavalier-Smith 2004b gives details).
To maintain their complex surface structure—essential for motility and feeding—ciliates cannot undergo the massive dedifferentiation that other eukaryotes associate with sex. Transmission of cortical structure depends not just on DNA heredity and membrane heredity, like cell structure of other organisms, but also on direct transmission of pre-existing cytoskeletal structure (cytotaxis: Sonneborn, 1963) to perpetuate the number and polarity of ciliary rows (it may not apply to all ciliates; some seem secondarily to have evolved dedifferentiation within cysts). Therefore they evolved a unique form of reversible syngamy—conjugation—in which cells only partially fuse, exchange gamete nuclei and then separate. In ciliates each syngamy creates two zygotes, not one as in other eukaryotes. Unlike human or tree zygotes, both can swim off and feed at once. Encoding their vast complexity, ciliates have more genes than plants—but smaller genomes than most; Paramecium tetraurelia has about 50 % more genes than you (35 000: http://paramecium.cgm.cnrs-gif.fr/) but relatively little non-coding DNA (less than 30 % in the macronucleus and about 40 % in the micronucleus). Its genome size is about 100 Mb, about 30 times less than ours, despite their cells typically being hundreds of times larger—a mark of the economy in skeletal DNA that multiploidy allows. Thus the ratio of coding to non-coding DNA has nothing directly to do with evolution of genome size, contrary to Orgel and Crick (1980). What matters is the volume of the transcribed nucleus; macronuclear DNA content scales with cell volume precisely as in other protists without heterochromatin (Fig. 1; Shuter et al. 1983).
Alhough at the heart of ciliates' astounding success, nuclear dualism has a severe genetic cost. Non-transcription of the micronucleus for many cell generations allows harmful, even lethal mutations to accumulate more easily than in any other organism without being selected against until the next sexual generation, thus increasing genetic load. This is partly mitigated by suppressors of these harmful mutations also easily accumulating during that period. If they do, allowing the sexual offspring to survive, the genome can be altered more profoundly and non-adaptively than in other organisms. The most striking example is the pervasive gene scrambling that evolved in many ciliate micronuclei: numerous genes fragmented into pieces and their order in the genome became scrambled. Many acquired internal, non-coding sequences that are not introns but ‘internal eliminated sequences’ removed only during macronuclear formation, when each piece is put in the correct order by DNA breakage and rejoining. Like RNA editing and introns (Cavalier-Smith, 1993), unscrambling evolved as a phenotypic correction of otherwise lethal mutations. Remaking most or all genes every sexual generation is a huge but unavoidable genetic burden—a superb example of mutation pressure causing not simply non-adaptive, but actually harmful phenotypes, which evolved as an indirect consequence of one of the three innovations that made ciliates so successful. Genomes are certainly not optimized by selection. Selection is powerful, but not all-powerful. As for introns and RNA editing, the origin of a generalized unscrambling mechanism would allow any gene to become scrambled during the period of macronuclear latency as it could be unscrambled after sex: the hypotrich Sterkiellia rejoins 150 000 DNA fragments after every sexual act! I have suggested that the mechanism for cutting and rejoining DNA that evolved for eliminating certain sequences (e.g. heterochromatin) during multiploidization was recruited for removing unscrambling (Cavalier-Smith, 2004b).
In accord with basic selfish DNA theory, harmful transposons will also be particularly prone to accumulate in micronuclear DNA eliminated from the macronucleus. Macronuclear chromatin diminution is taken to extremes by stichotrichs, e.g. Sterkiella, which fragment their genomes into gene-sized pieces without rejoining them during multiploidization (∼24 500 in Sterkiella, which has ∼26 800 genes [Prescott et al., 2002]; unlike P. tetraurelia it is not an ancient polyploid, so it can eliminate more of its genome in the macronucleus; Stylonychia with a 12-fold larger genome eliminates 97 %). Such macronuclei discarded the telomeric and centromeric heterochromatin essential for accurate segregation in haploid and diploid cells, and rely on high gene copy numbers for avoiding losing essential genes at nuclear division (which is amitotic). This fails within a few score generations, forcing them to regenerate the macronucleus by sex from the micronucleus that retained these essential elements and the linkage of genic and other skeletal DNA to them. Consequently the Sterkiella macronucleus that discarded all skeletal DNA and relies just on proteins for its nuclear skeleton has no long-term future: a clear instance of DNA being a better long-term nuclear skeleton that protein. Ciliates like Tetrahymena that retain macronuclear centromeres and the linkage of genic and skeletal DNA in proper chromosomes can even evolve amicronucleate strains; although these have sacrificed sex they can multiply indefinitely, proving that micronuclear gene expression is unimportant for anything except sex.
Ciliate genomes, although many orders of magnitude smaller than other comparably sized cells, still vary at least 367-fold. Is this because their cells vary over 1000-fold in volume and a larger nucleus is needed in larger cells for transient micronuclear gene expression at conjugation—or is micronuclear volume functionally irrelevant and the variation in ciliate genome size dominated by accumulation of selfish DNA? Such accumulation should be easier than in any other group because micronuclei are totally inactive for most of the life cycle. However, the range in genome size is essentially the same in ciliates that eliminate most of their DNA from the macronucleus to make gene-sized fragments and those that eliminate very little, so genome size is not related to the fraction eliminated as a simple selfish DNA interpretation might expect. More work is needed on the function of micronuclear transcription (associated with sex), and whether its rate scales with cell volume or not, to decide whether the skeletal theory applies even in this exceptional instance, which would be expected to be the most favourable of all to the selfish DNA hypothesis—currently the only case where it seems even remotely plausible as a partial explanation of nuclear genome size variation. If the selfish DNA principle were really the dominant factor in eukaryote genome expansion, one would expect that in ciliates genome size should be far larger for a given cell volume than in other eukaryotes in view of the greater ease of accumulating even severely harmful mutations in the micronucleus. But, in fact, ciliate genomes are far smaller for a given cell size, precisely as expected on the skeletal theory given nuclear dualism and macroploidy, and the precise opposite of what the selfish theory predicts. This seems as decisive a general refutation of the selfish DNA interpretation as the nucleomorph examples, but one where nobody can argue that selfish DNA is not spreading because the nuclei are not sexual!
In contrast to ciliates, Opalina combined large cell size and the need for fast growth by evolving numerous genetically equivalent nuclei per cell (like siphoneous algae and many hyphal saprotrophs—fungi and pseudofungi). This also allows their genome size to be small for their cell size (a prediction: not yet measured) but avoided the genetic burden that nuclear dualism imposed on ciliates. However, Opalina did not diversify to form a whole phylum for multiple reasons. Firstly, it arose long after ciliates, which already filled virtually all major adaptive zones for a multiciliate phagotroph; secondly, it is not a phagotroph, having evolved from an osmotrophic flagellate in the rich but restrictive environment of the tetrapod rectum and never evolved a mouth to compete with orally dominant ciliates; thirdly its reversion to a small, uninucleate state for syngamy prior to cyst formation for host reinfection meant that large cell size and its potential for morphogenetic complexity could not be maintained throughout the life cycle.
EXAMPLES OF GENOME EXPANSION AND REDUCTION IN MULTICELLS: WHEN IS EXTRA DNA BENEFICIAL?
It is much harder in multicells than in protists to decide which cell types have the most decisive selective impact on genome size evolution. Natural selection must sum up the selective forces on all tissues at all stages of the life cycle and on the gametes themselves. Its force will be affected by all manner of confusing details, e.g. whether a given group has mechanisms like somatic polyploidy (many invertebrates, and angiosperms: but not gymnosperms, and minimally in vertebrates), cell fusion/multinuclearity (e.g. somatic muscles) or dramatic cell expansion by vacuolization to make certain somatic cells immensely larger than germ-line ones (tracheophytes). Except for vertebrate platelets, animal sperm, and red blood cells in a few amphibians, mechanisms for making cells dramatically smaller than in the germ line are unknown: therefore the size of the germ-line/meristematic cells forms the minimum baseline from which differentiated cells can expand further. It is therefore the size of the germ-line/meristematic cells that is most fundamentally significant, not that of post-differentiated cells that have ceased to divide. However, if certain differentiated cells have particular size requirements that are sufficiently powerful, this factor may indirectly influence the sizes of the proliferating cells that generate them and therefore of their nuclei and genome sizes. In land plants (embryophytes) and vertebrates, cells of the vascular system probably played such a key role in influencing large-scale patterns of cell and genome size evolution.
A striking feature of land plant evolution is that genome sizes of mosses are uniformly low (Vogelmayr, 2000), whereas those of vascular plants are one or more orders of magnitude higher (Bennett et al., 1998; Leitch et al., 2001; Obermayer et al., 2002). This implies that mosses are systematically selected for smaller, and tracheophytes for larger cells. I suggest that the small-celled bryophytes (mosses and most liverworts) represent the ancestral state, and that tracheophytes underwent a systematic upward shift in optimal cell size because of the evolution of the tracheid and selection for much larger plants. For effective sap uplift in large plants, especially trees, tracheids need to have a large diameter. Because of the rigidity of cell walls and the way they are packed together in three dimensions in tracheophyte tissue, cells generated in primary meristems cannot greatly expand laterally in thickish stems during differentiation, but can vertically. Thus primary tracheids cannot expand significantly during differentiation in cross-sectional area, which matters for rapid sap ascent. Therefore apical meristem cells have to be relatively large in tracheophytes. Cambial growth allows pretracheid cells to expand radially after they leave the cell cycle, but not much circumferentially. This inability to expand in more than one of the three dimensions during differentiation into tracheids severely limits the post-cycle expansion factor for tracheids, compared with what is possible in soft-tissued animals; tracheids cannot be orders of magnitude larger than their meristematic precursors. Contrast this with the single-cell-thick leaves of mosses and liverworts that can expand dramatically by vacuolization in all three dimensions. Thus strong selection for large-diameter primary tracheids and relatively long and wide secondary tracheids would indirectly require large-celled meristems in early vascular plants, and hence (because of karyoplasmic ratio and skeletal DNA epigenetic constraints) large genomes. That is why vascular plants have much larger genomes than bryophytes.
Angiosperms, however, often have much smaller genomes than all gymnosperms and most pteridophytes. The phylogenetic evidence suggests, albeit not decisively, that the ancestral angiosperm had a relatively small genome—smaller than any gymnosperm (Leitch et al. 2005). I have suggested earlier that this is because evolution of somatic endopolyploidy (absent from gymnosperms) and vessels allowed the first angiosperms to make wider diameter, very long vessels from small meristematic cells (Cavalier-Smith, 1978). Endopolyploidy swells cells proportionally to ploidy and vessels are made long by joining many short cells end to end. The dramatic reduction in meristematic cell size that these two innovations allowed increased cell reproductive rates substantially, enabling more rapid life cycles and the origin of weeds and ephemerals; there is a hint here of the secondary origin of leptocauly from pachycauly, so loved by Corner (1964). In 1978 I spoke on ‘Why are there no gymnosperm weeds?’; my answer was that having no vessels or somatic endopolyploidy they must have large meristematic cells for generating tracheids, so cannot possibly go through a complete life cycle fast like the ephemeral Arabidopsis. Water ferns (Marsilea, Azolla, Salvinia) are the only ferns with markedly low genome size; I suggested that this also is because Marsilea has vessels in its roots and Salvinia has a degenerate vascular system that evolved long ago, allowing substantial reductions in cell and genome size (Cavalier-Smith, 1978) favoured by selection for rapid cell multiplication, which has enabled them to become notorious weeds. The other especially weedy fern is bracken, which also unusually for pteridophytes has vessels. But as it spreads rapidly by stolons rather than whole-plant multiplication via a sexual cycle, it has not been subject to such great selection for small cell and genome size. Selaginella, which also can have vessels, turns out to have a smaller genome size than water ferns. However, both water ferns and Selaginella are also heterosporous, unlike any other pteridophytes except Isoetales. Could the fact that their gametophytes are endosporous rather than free-living impose a downward selection on cell size? Isoetes helps discriminate between these explanations as it lacks vessels and has a large genome (11·96 pg: Leitch et al., 2005) despite being heterosporous, suggesting that vascular evolution is the key factor.
Variation in genome size in angiosperms is far broader than in any in other class of multicell. Why? Obviously because some are selected for the smallest cells possible to allow ephemeral growth like Arabidopsis (the smallest), whereas others like lilies, fritillaries and Trillium are selected for cellular gigantism. Bulbs have a very different life strategy from ephemeral weeds. Their cells have to be large to store vast amounts of food during dormancy (cold winters in high latitudes, dry summers in hotter places) most efficiently. Cell multiplication rates are not at a premium because most bulbs prepare their leaf and flower primordia months in advance of their use and simply expand the pre-existing cells suddenly by massive vacuolization and wall synthesis. To expand fast, the larger the starting cells that can store more precursors the better. Food storage and rapid expansion by bulbs, corms and fleshy tubers is not the only reason why some plants have much larger cells (hence genomes) than others but it is the most widespread and obvious one, especially on monocots. Water storage may be another, so succulents often have large meristematic cells and use somatic endopolyploidy to make giant vacuolate cells. In dicots the largest genomes are typically in herbaceous perennials in which turgor, rather than secondary thickening, plays a major skeletal role. Of course there is a trade-off between such advantages of large cells and the disadvantages of slower cell multiplication. But angiosperm life forms and niches are so varied, with much of their organismic machinery being cells where size matters, that a vast spectrum of cell-size has been favoured by selection. Their highly varied genome size is a purely secondary consequence, not a cause of this. One of the nicest demonstrations of such an ecological spectrum is the finding that in herbs of English deciduous woodland, the earlier the shoots emerge the larger the genome (Grime and Mowforth, 1982). Here, temporally displayed, is a trade-off between rapid shoot emergence from dormancy in early spring (cell expansion only) and rapid cell multiplication in the summer. However, the overall trend is dominated by a few extremely early plants with large genomes, like bluebells, and late ones with small genomes; there is much more scatter among those with middle-sized genomes, suggesting that more factors are involved. Phylogenetic studies indicate that genome size decreases as well as increases within a genus (Wendel et al., 2002; Price et al. 2005), so there is no inexorable upward trend.
The different genome size spectra among land plants make perfect cell-biological developmental and ecological sense in the light of the nucleoskeletal function of DNA and selection for cell size and growth rates, but none at all in terms of purely mutational equilibria. When trying to explain variation in nuclear DNA across environmental gradients, as in a study of 401 species which suggested that species with large genomes also have special requirements (Knight and Ackerley, 2002), it is important to think in terms of the relatively poorly understood physiological significance of differing cell sizes, not of genome size itself, because genome size variation is a purely secondary consequence of this, for which the skeletal DNA/karyoplasmic ratio theory has already provided a satisfactory generally applicable explanation.
The same is true of the marked variations among vertebrates, for which I only briefly assert a few key points, having reviewed them in detail elsewhere (Cavalier-Smith, 1991b). In essence, stabilizing selection for optimal red blood cell size accounts for the far narrower range in genome size in warm-blooded vertebrates, and to a lesser degree in the more active exothermic reptiles, than in fish or amphibians. The range is narrowest in fliers (bats and birds, where metabolic demands are greatest) and systematically lower than in most mammals. Within amphibians, the largest cells and genomes are in very sluggish salamanders and the smallest in actively hopping frogs. The largest genome of all is in the lungfish that aestivate for months in cocoons and need large cells to store glycogen and minimize energy costs of ion-pumping across the plasma membrane for homeostasis.
Whatever group one examines reveals sensible adaptive reasons for the observed spectrum of cell size that account for the correlated genome size spectrum. To understand these one has to be familiar with the developmental biology and ecology of the group; a purely genetic or purely biochemical approach gets nowhere.
FALLACIOUS CRITICISMS OF THE SKELETAL DNA THEORY
Given the strong evidence for the skeletal DNA theory, it is a puzzle why it is still not widely accepted as the solution to the C-value paradox. A historical reason for it being widely ignored is that the anthropomorphic phrase ‘selfish DNA’ coined soon afterwards seemed to provide an even simpler ‘explanation’ and became even more popular than the earlier, equally non-explanatory term ‘junk DNA’ (Ohno, 1972). Proponents of selfish DNA never explained how it could account for the basic data of the correlation between genome size, cell size and nuclear volume. The nucleus is imagined as a mere bag that would fill up with selfish DNA or junk DNA, or even expand under mutation pressure (in which I include transposition pressure). Supporters of the selfish theory seemed not to bother about detailed cell biology and to welcome the excuse provided by a simple catchphrase to ignore developmental biology and also ecology—an attractive option in an age where over-specialization often hides the big picture. Those few who dispute the skeletal theory, rather than ignoring it, implicitly assume either that nuclear volume and karyoplasmic ratios are functionally unimportant (nobody seems to have explicitly argued this) or that when nuclear volume does change it does so by changing s. The latter is firmly contradicted by the fact that volume correlates with C, which shows that s must be constant, at least for animal red blood cells and plant shoot and root meristems, the only systems with extensive data. Another reason is that our understanding of the genetic control of cell volume has been so poor until recently that many favoured the alternative that DNA contents determine cell volume. Perhaps now that this has been reasonably well disproved (as explained in the next section), and our understanding of the skeletal interplay between chromatin and the nuclear lamina has improved, the skeletal DNA/karyoplasmic ratio theory will be taken more seriously. It fits and explains the facts and is contradicted by none.
Gregory (2001), although rejecting the selfish DNA ‘explanation’, asserted that a serious problem with the skeletal theory is that it does not explain quantization of genome sizes (overlooking the fact that neither does his or any other theory!). Several authors, notably Narayan (1983) have asserted that increases in angiosperm genome size are quantized, not continuous, but most, if not all, this apparent quantization is probably a statistical artifact of poor data sampling and analysis. If it were true, it would be an interesting phenomenon requiring explanation: either genomes increase by the same amount within a genus (but different amounts among genera) or selection weeds out intermediate values—neither would necessarily conflict with the skeletal hypothesis, although both are implausible on any theory. As I have emphasized before (Cavalier-Smith, 1985a), the vast majority of taxa do not show quantization, but a more-or-less continuous spread of sizes, often distributed roughly log-normally; to focus on the few that appear to, may be a misleading selection of mere coincidences. Baranyi and Greilhuber (1999) showed that Allium, one genus that Narayan claimed to show quantization, does not, and that there was sufficient inaccuracy in the genome size data for several species to interchange positions among the supposedly quantized classes. Recent claims for quantization in animals (Gregory et al., 2000) are still more questionable. For flatworms, varying 300-fold in genome size, Gregory et al., (2000) suggested that ‘Stenostomum closely approximate quantum series with steps of 0·12’; but the actual differences between the five (only!) species were 0·28, 0·06, 0·14, 0·88. As the average of these differences is 0·34 and they are quite irregular, assertion of quantization is unjustified. The three (!) species of Macrostomum (one misspelt as Microstomum in the paper) ‘follow a series with a basal unit of 0·3 pg’: the actual differences are 0·62 and 0·26 pg! To cap it all ‘among the two [!] members of Dugesia examined, there is the suggestion of a series with steps [note the plural!] of 1·3 pg’. With such sparse data you can read almost anything into it, it seems. It is no criticism of theory that it does not explain ‘facts’ as dubious as these. The copepods, which vary 7-fold in genome size, are held to show a ‘quantum series of ∼3 pg’ in Hesperidiaptomus (five species actually differing by 2·52, 0·5, 1·58 and 0·52 pg), said to be ‘consistent with’ variation among other copepods with a basal value of ∼4. All these are 2C values; my earlier comment (Cavalier-Smith, 1985b, p. 170) that ‘a quantized mode of increase by 2 or 4 pg per genome is also unattractive because there are numerous organisms with a total genome size of 0·05–1 pg, showing that much smaller increments in genome size than the postulated quantum step can occur…’ remains valid.
A very indirect statistical analysis of developmental rate and cell size (Pagel and Johnstone, 1992) claimed to favour the junk over the skeletal DNA theory. Their two key findings held to support this conclusion were (1) that nuclear genome size is correlated with developmental rate even after effects of nuclear and cytoplasmic volume have been removed, and (2) genome size is not correlated with cytoplasmic volume after controlling for developmental rate. Both arguments refer not to the primary statistical correlations, which are as expected by the skeletal DNA theory, but to minor residuals left over after statistical manipulation. Even if point (1) were true (which is doubtful, see below), it would not follow that the junk DNA theory is correct, as claimed; suppose that DNA amount were to causally affect developmental rate independently of nuclear and cell volume—that would be a function for it contrary to the original idea of junk DNA. If the DNA does not directly affect developmental rate, what is the reason for the residual correlation with developmental rate? The junk DNA theory does not per se predict such a residual correlation any more than does the skeletal theory. Pagel and Johnstone's (1992) discussion of the theories was confused and misrepresents both. Their claim to discriminate between them was based on two assertions: that (a) the junk/selfish theory predicts that genome size should be related to developmental rate independently of cell size, and (b) that skeletal DNA theory predicts it should not. Both are false. The inverse measure they used for developmental rate was time from egg laying to larval hatching. This must depend on two things: average cell cycle length and number of cell cycles needed to make the hatchling. The former will be loosely related to cell size (but the scaling is weak, ignored by these authors, but not specifically predicted by the present skeletal theory) while the latter will not, but will strongly depend on adult body size (Salthe, 1969). This might partially explain why the 1-m Amphiuma takes nearly three times longer to hatch than the 33-cm Necturus (27 times smaller body mass) that has a larger genome, which cannot be explained by their development time version of the junk theory.
They twice assert that Cavalier-Smith (1985a) argued that nuclear surface area is a central selective force to the skeletal function of DNA, whereas in fact that chapter spent many pages explaining why that early idea is mistaken, and that gene dosage rather than nucleocytoplasmic transport is probably often the limiting factor for growth rates. They assert that junk DNA theories expect genome size to increase with hatching time, but others had not asserted that and its logic escapes me. They say that junk DNA theories expect genome size to increase until the cost of replication becomes too great. But the only cost they mention is not of nutrients, energy or space, which are real costs, but of extra time to replicate, which is a myth for eukaryotes; they fail to cite or refute the arguments (Cavalier-Smith, 1985d) that show that DNA amounts do not increase eukaryote cell cycle lengths (unlike bacteria)—their assumption that they do is based on fundamentally misunderstanding how eukaryotic DNA replication is organized and on confusing correlation of genome size and minimum generation times (Bennett, 1972) with causation. In one place they assert that ‘junk DNA’ has negligible effect on the organism and in another that it functions by lengthening cell cycles. Both cannot be true; probably both are false. The actual replication cost of extra secondary DNA should increase with its amount; neither Pagel and Johnstone (1992) nor any other junk/selfish DNA proponents have given plausible reasons why the amount of non-coding DNA should scale roughly isometrically with cell size, whereas a relationship with developmental time is very weak and often non-existent for multicells.
It is optimistic to suppose that statistics can solve the problem in the absence of a physical/biological understanding of the causes of the correlations, both the main ones and the residuals. The real problem overlooked by Pagel and Johnstone (1992) is that the measurements used in their analysis are of characters so far away from the key issues that separate the major theories that numerous secondary factors can affect them in a confusing way. Thus the nuclear and cytoplasmic volumes used are those of red blood cells, which have relatively little to do with the central tenet of the skeletal DNA theory, which relates to the karyoplasmic ratio in exponentially multiplying growing cells, not non-dividing differentiated cells, where the nucleus is deliberately shrunken and all ribosomes have been eliminated from the cytoplasm, which has acquired a very different shape. The selective forces acting on mature red cells are very different from those on cycling cells that form the core of the theory; to predict what it would expect for red cells would demand a quantitative secondary theory about how changes in the karyoplasmic ratio during red cell differentiation should scale with mean cycling cell size. The apparently stronger correlation of nuclear and cytoplasmic volumes with each other than with genome size may simply be telling us that post-cell-cycle shrinkage of red blood cells is not invariant with genome size but affects both cell compartments similarly. The analysis also overlooks the experimental errors in measurements; many cell and nuclear size measurements were done on dried smears so there will be shrinkage and distortion (possibly by a different factor in different species) as well as systematic bias from the assumption that they are elliptical-based cylinders. These errors must significantly affect residuals and might even be sufficient to account for their higher mutual correlation than with genome size (which ought to be substantially more accurate, as drying artefacts are absent and linear errors are not cubed).
Furthermore, the very use of residuals as the key argument in this case is statistically suspect. The Pagel and Harvey independent comparison method aims to produce residuals that are normally distributed (Harvey and Pagel, 1991). The genome size residuals seem approximately to be, but the development time ones are clearly skewed. If the three long-development extreme outlier species were excluded there would be virtually no correlation with genome size for the remainder in their fig. 3. Hatching time is strongly skewed, especially because three salamanders shown in their table 1 (which accidentally omitted Cryptobranchus) take exceptionally long times to hatch. Though Amphiuma is large the other two are not, so they must either have exceptionally long cell cycles or a period of virtual dormancy. There is no reason whatever to suppose that their developmental time was directly caused by, or caused their large genomes. A genic change could delay development immensely if of selective advantage (12× greater than the fastest), but no genic mutation could possibly speed up the development of the slower ones by 12, given their giant cells; thus urodele development time cannot evolve randomly in any direction and does not fit the basic Brownian motion model assumed by the independent comparisons approach. Extra slow oddballs can arise, but extra fast ones cannot. Whatever the causes of the slow development of these three species, the sheer magnitude of their deviation from the norm is so great compared with the variation in genome and cell sizes that the attempt to statistically control the ‘correlation’ for cell size was probably invalid, and largely meaningless.
GENETIC CONTROL OF EUKARYOTE CELL SIZE IS POLYGENIC, NOT NUCLEOTYPIC
This section is necessary to refute the assumption by some, including Petrov (2002) and Gregory (2001), that DNA amounts causally determine eukaryotic cell volumes (but not bacterial ones) and that such a (to me imaginary) nucleotypic function is an important part of the explanation of eukaryotic genome size evolution.
Cell volume of proliferating cells is controlled by three cell cycle processes: growth (mass/volume increase), timers and sizers. Mean cell size depends on growth rates and the quantitative settings of timers (processes affecting when things happen in a cell size-independent way) and sizers (processes affecting timing that are modulated by cell size). Eukaryotes have two superficially different kinds of cell cycle: (a) binary fission in which cells continuously grow and divide on average once every cell volume doubling; and (b) multiple fission cell cycles where the cell grows manyfold and then a large number of DNA replications (S-phases) and mitoses (M-phases) occur without intervening G1 phases or growth, so cell volume repeatedly halves until a minimum size is reached after which growth recommences, e.g. animal oocytes/cleavage, the green alga Chlamydomonas (Craigie and Cavalier-Smith, 1982) or sporozoan protozoa like the malaria parasite Plasmodium. Most binary fission cycles have a G1 phase with no DNA synthesis interpolated between M and S phases, e.g. in post-cleavage animals and higher plants; the sizer then controls the G1/S-transition. In a minority of protists (notably fission yeast S. pombe and probably all protozoa of phylum Amoebozoa, e.g. Amoeba and slime moulds: Cavalier-Smith et al., 2004) there is no G1 and the sizer operates during G2 prior to mitosis. As previously explained (Cavalier-Smith, 1985a) the key to understanding genetic control of size in proliferating eukaryote cells is the nature of sizer control over the initiation of S-phase and/or mitosis: variations in the duration of timers have proportionally less influence, while growth rates are determined as in bacteria primarily by ribosome numbers and rates of gene transcription (RNA synthesis). Variations in sizer setting are responsible for the extremely broad size spread of eukaryotic cells.
Believing that all three cell cycle types are variants of a basic mechanism, I have proposed that chromatin can be switched between two states, one that in principle can be replicated and one that cannot, and that in binary G1 cycles replication switches the chromatin to a non-replicatable state whereas mitosis followed by a sizer control switches it back again (Cavalier-Smith, 1985d). In G1-less cycles the sizer simply acts later and in multiple fission cycles it is alternately blocked and released. This formal model has been proved correct and fleshed out in great molecular detail. The switch to the replicatable state involves licensing factors (origin recognition [Orc] proteins and Mcm proteins) that bind to origins of replication after mitosis and prime them for replication; in cells with G1, replication itself starts later at the beginning of S. Early ideas about the control of the eukaryotic cell cycle emphasized initiators and inhibitors and their accumulation or dilution by growth, as in bacteria. However, in addition to replication licensing, we now know that the eukaryotic cell cycle has two other major novelties with no real counterpart in bacteria: first is the use of proteolysis of numerous proteins more-or-less simultaneously to reset the cell cycle every generation. This proteolysis is done by the proteasome, a tiny cylindrical protein assembly that apparently evolved from simpler precursors in the actinobacterial ancestors of eukaryotes and archaebacteria (Cavalier-Smith, 2002b); the novelty arising in the ancestral eukaryote was ubiquitin, a highly conserved, small protein that becomes covalently attached to numerous proteins to mark them for proteasomal degradation. The second major eukaryotic cell cycle novelty is the use of cyclin proteins to bind to and activate a series of serine/threonine protein kinases that modify the activity of numerous key proteins by phosphorylating them. These controls probably all originated at the same time as spindle microtubules evolved from bacterial FtsZ and played an equally important role in the transition from bacteria to eukaryotes (Cavalier-Smith, 2002a), with important consequences for the evolution of genome size.
Bacterial chromosomes can have only one replication terminus, because of their mode of DNA segregation (Cavalier-Smith, 1987a), but the origin of mitosis removed this requirement for only one terminus (Cavalier-Smith 1987b; 2002a; Nasmyth, 1995). Invention of the replication licensing system, by interposing a new level of control between the single decision to replicate and its execution at replicon origins allows origins to proliferate. Thus mitosis and replication licensing abolished the selective forces that previously prevented plural replicons per chromosome. Although I once suggested that eukaryote replicon origin numbers might be directly involved in cell cycle sizer controls and therefore in genetic control of cell size (Cavalier-Smith, 1978), I later considered this mechanistically implausible and that the decision to replicate (initiation of S-phase) and the initiation of individual replicons must be mechanistically distinct; S-phase initiation and the sizer controls over it must be oligogenic and not controlled either by DNA amounts (nucleotypic) or by the numbers of replicon origins (polygenic) (Cavalier-Smith, 1985e). This is indeed so.
The eukaryotic cell cycle is now seen as a bistable oscillator between two mutually exclusive states (Nasmyth, 1996; Novak et al., 1998) (Fig. 5) controlled by two oligogenic switches. The switch to the potentially replicatable state involves two things: (a) licensing factors prime replication origins for eventual replication; and (b) cyclin-dependent kinases (Cdks) that phosphorylate them (and histones and other proteins) to switch them from their initially inactive to the active state. As each origin starts replication its licensing factors are permanently inactivated, which prevents re-replication until after mitosis and renewed licensing. Active replication forks inhibit mitosis, which can occur only after replication is complete and tension is generated by proper attachment of daughter chromosomes to spindle fibres. The major switch that induces anaphase and allows relicensing is the destruction of cyclins (Cln or Clb), the cohesins that bind sister chromatids together, and other key mitotic proteins by hydrolysis by proteasomes after these proteins are marked for destruction by covalent attachment to ubiquitin by a 20S macromolecular complex (anaphase-promoting complex).
Fig. 5.

The eukaryote cell cycle as a bistable oscillator. The central logic of a typical binary fission cell cycle is that the cell can switch suddenly between two metastable states, one (G1) with low and one (S + M) with high cyclin-dependent kinase activity. The master controlling switch activates the anaphase-promoting complex (APC) that uses ubiquitin/proteasome-mediated proteolysis to digest the cohesins that bind sister chromatids together and reset the cell cycle by digesting cyclins and many other proteins. This sudden proteolytic destruction of cyclin-dependent kinase causes a precipitous drop in its activity (downward pointing arrow). As the cell grows the ratio of cyclins to their inhibitors increases gradually so eventually there is enough active cyclin to stimulate its associated kinase to initiate a burst of phosphorylations of numerous proteins critical to the G1/S-phase transition (called START in budding yeast, although the beginning of the cycle is more logically the onset of synthesis of origin recognition complexes, cyclins and their inhibitors immediately following the massive proteolysis that initiates anaphase). The upward pointing arrow represents this sudden activation of cyclin-dependent kinase without significant change in cyclin concentration, which typically occurs at a particular cell size effectively set by the rate of cyclin accumulation. Note that it is the ratio of cyclin to APC (abscissa) that is the master controller, not the absolute level of cyclin. START involves the initiation of DNA replication and of centriole duplication: like chromatin centrioles exist in two states, duplicatable and non-duplicatable. The centrosome and centriole evolved at the same time as the nucleus and their duplication cycles have been coupled ever since (Wong and Stearns, 2003); many organisms that lost cilia have also lost centrioles (e.g. higher plants and fungi) and are thus degenerate compared with animals and most protozoa. A second set of cyclin-dependent processes (not shown) is triggered after replication is complete to initiate chromosome condensation and spindle assembly.
Although details differ among species (e.g. in the number of different cyclins, Cdks and their roles in successive cell cycle stages), the principles apply to animals, fungi, plants, chromists and protozoa and must have evolved in the last common ancestor of all eukaryotes (Nasmyth, 1995; Cavalier-Smith, 2002a). Budding yeast (S. cerevisiae) is simpler than animals in having only one Cdk (∼12 000 molecules per diploid cell) that participates both in the G1/S switch and movement through S and M by binding to eight different cyclins, which vary in protein copy number from about 200–3000 per diploid cell (Cross et al., 2002). Different cyclins accumulate at different rates and times and their Cdks have many different targets for phosphorylation, e.g. the S. cerevisiae kinase bound to Clb3 (∼800 molecules) is the major histone phosphorylator and Clb5 with a peak number of about 2400 per diploid nucleus phosphorylates Orc2 (∼1200 copies per cell) at the 1100 origins (Cross et al., 2002). For simplicity and brevity I avoid the complexities embodied in quite realistic chemical kinetic models of the cell cycle (Chen et al., 2000; Sveizer et al., 2000) now being tested by sophisticated genetic manipulations (Cross et al., 2002), so as to focus on features most relevant to size control. Whether the sizer originally operated in G1, or in G2 as in Amoebozoa—which branch near the base of the eukaryote tree (Stechmann and Cavalier-Smith, 2003), is unclear. This distinction is probably not fundamental, as wee mutants of fission yeast have a G1 unlike wild type. In eukaryotes with a G1, the sizer involves accumulation of a cyclin functionally equivalent to Cln3 of budding yeast, which accumulates in nuclei during growth (averaging about 200 molecules per diploid S. cerevisiae nucleus: Cross et al., 2002).
Precisely how sizers work is unclear, but the early initiator accumulation/inhibitor models (Cavalier-Smith, 1985a) are essentially correct: the key initiators are cyclins, which mostly accumulate in proportion to cell mass and at a certain mass become sufficiently abundant to exceed the numbers of the inhibitors that bind stoichiometrically to some of them (e.g. Sic1 for Clb2, important for initiating mitosis, and Clb5 of S. cerevisiae and differently named homologues in animals), or escape the degradation by proteases. G1 cyclins can be thought of as integrators for physiological signals that modulate progression through G1 by affecting their transcription, translation, stability or activity (Laabs et al., 2003). Accumulation of Cln3 and Bck2 proteins to a critical level will activate transcription factors that are specific for Cln2 and Clb5, respectively, and cause a relatively sudden increase in their concentration that, by phosphorylating their various targets, switches the cell into S. The complexity of the regulatory networks is such that mutations in any of the genes for the participants that affect their affinity for their targets, or in promoter regions that affect their degree of transcription, can, in principle, increase or decrease cell volume. Numerous examples are known of the modulation of cell volume by such mutations (Cross et al., 2002).
There is no evidence that DNA amount plays any role at all in any of the feedback loops that affect these basic cell cycle switches. For DNA to have such an effect it would have to bind some protein stoichiometrically, but the very low copy number of the key proteins compared with the total mass of DNA completely rules this out. Thus we can be much more confident than before (Cavalier-Smith, 1985a, 1991a) that cell size is controlled by individual genes, not by total DNA amount. Thus the detailed studies of how the eukaryote cell cycle actually works give no role at all for DNA amounts; hence both assumptions underlying the neutralist, purely mutational theory of the evolution of genome size appear to be false (non-adaptiveness of cell size and size control by DNA), so the theory itself is doubly refuted.
However, Gregory (2001) suggested that DNA amounts might control cell size indirectly by affecting accumulation rates of G1 cyclins through its affect on nuclear volume. Making nuclei bigger by extra DNA would decrease their cyclin concentration, other things being equal. But other things will not be equal; there is no reason why the cell could not increase levels of the critical molecules proportionally with nuclear volumes by manipulating promoter strengths or degradation rates. Measurements of cyclin molecule number in larger cells than yeast, such as those of animals or plants, will probably show that this actually happened in evolution. Comparative arguments refute the basic assumption that nuclear volume necessarily limits the rate of cyclin accumulation. Compare the embryonic cleavage stage of Drosophila with that of later embryonic development. In both, DNA amounts are the same and nuclear volume similar; yet during cleavage cell cycles are orders of magnitude faster than they are later. Thus nuclear volume is not rate-limiting for cyclin accumulation. Faster cell cycles in animal cleavage occur because of dissociation between the replication cycle and growth; by temporarily bypassing sizer controls, repeated replication and division can occur at the maximal rate allowed by the cyclin-based G1/S and proteolytic anaphase switches and replication and mitotic processes; one bistable cycle after another is repeated in a free-running rhythm. Interestingly, during cleavage the cyclin accumulation mechanisms are at their simplest with the fewest regulatory molecules and steps. Moreover, although some cyclin concentrations increase during growth, others remain fairly constant during the cell cycle—dilution or destruction of inhibitors may be more critical to their effects.
The fallacy of Gregory's argument is similar to early assumptions that DNA amounts causally determine DNA replication times, refuted long ago (Cavalier-Smith, 1985d); as there explained, growth rates fundamentally limit cell cycle lengths, not replication or cyclin accumulation timers, which simply evolve to fit inside the time span dictated by growth rate limitations. There is a self-contradictory paradox in Gregory's argument. He claims that skeletal DNA is not the explanation of the C-value paradox, but then uses it as an intermediary mechanism in a model for cell volume control claimed to be such a solution! He also incorrectly claimed that nuclear volume control by genome size is not nucleotypic, confusingly contrasting ‘the skeletal theory’ with his ‘nucleotypic theory’.
RELEVANCE OR NOT OF POLYPLOIDY TO GENOME SIZE EVOLUTION
Many (e.g. Bennett, 1972; Nurse, 1985; Gregory, 2001) were tempted to suppose that DNA amounts determine cell volumes because newly formed polyploids have increased cell volumes in proportion to DNA content. To argue that this necessarily means that DNA content determines cell volume would be as fallacious as the converse argument that as the dosage of all genes also increases in proportion to ploidy this necessarily means that increased gene dosage is the cause of the proportionally increased cell volume! To use the facts of polyploidy to argue either way is selective and illogical; we need independent evidence where the two factors are not utterly confounded; that is now available from the new insights into cell cycle controls over the past 15 years (Broek et al., 1991; Nasmyth, 1995, 1996; Novak et al., 1998; Stern and Nurse, 1996; Lygerou and Nurse, 2000; Alberghina et al., 2001; Novak et al., 2001); to cite discussions predating these, e.g. Nurse (1985) as support for nucleotypic controls (Gregory 2001) is misleading.
An overlooked feature of a novel polyploid (e.g. one made in plants where mitosis is inhibited by colchicine) is that as well as twice the DNA amount and twice the number of genes, it also has twice the cell mass and volume from the outset. It needs to use neither its extra genes nor its extra DNA to make the cell larger (division failure made it so), so neither gene dosage nor DNA amount need be involved. Because colchicine does not inhibit the anaphase-promoting complex from splitting chromosomes and causing reversion to G1, the cell is fooled into starting another G1 with normal cell cycle controls. It thus unavoidably makes another batch of cyclin inhibitors and has to wait for another round of cyclin accumulation to replicate and divide—meanwhile, as growth necessarily occurs unimpededly, its volume will have doubled again by the next division. Thus a colchicine-induced autopolyploid necessarily has double the cell volume because that is what it started with, not because of genic or nucleotypic controls! It will have precisely the same ratio of all the genes involved in cell cycle controls and the same volume/gene and karyoplasmic ratio and function normally. This puts new light on the nature of the sizer: its size relatedness may be merely a consequence of cell growth, plus whatever sets cyclin synthesis rates, possibly simply promoter strengths.
Thus the higher volume of polyploid cells may have nothing to do with DNA amounts, whether genic or total, and just be epigenetic inertia—another example of heredity partially independent of DNA information (Harold, 1995), analogous to ciliate cortical inheritance (Sonneborn, 1963; Frankel, 1989) and membrane heredity (Cavalier-Smith, 1995, 2000a, 2003, 2004a). Biologists often attribute more power to DNA than it actually has (Harold, 1995). My argument would probably apply to naturally formed polyploids. If the new polyploid colonizes a niche where larger cell size is advantageous, it would be maintained by existing cell cycle controls; but if it were advantageous to have cells nearer the original size, sooner or later mutations would occur to other cell cycle control genes that could reduce it (e.g. by inactivating an extra gene copy of a cyclin inhibitor) and be selected. This may explain the sometimes rapid reversion to ancestral cell sizes (Nurse, 1985). It would much longer retain excess DNA and a larger nucleus than it needs, because it is much harder to eliminate extra DNA than modify cell size. Until it did its karyoplasmic ratio would be suboptimal. Mutations deleting DNA or causing parts to fold more tightly (heterochromatinization) will therefore be selected to reduce nuclear volume; those deleting DNA altogether would offer more economy and be selected in the long run.
Although fresh tetraploids have twice the normal DNA and do not quickly lose it, the fact that older polyploids have relatively much less also indicates that selection can and does reduce genome size and that the original diploid was relatively close to its optimal cell and genome size.
COEVOLUTION OF CELL SIZE, CELL GROWTH RATES AND GENOME SIZE
Before concluding, I restate the overall theory slightly differently.
Nuclear volume is genetically determined primarily by DNA amounts, proliferating cell volume is determined by cell cycle control genes. If mutations in either move the karyoplasmic ratio from its optimum, others (affecting DNA amounts or cell cycle controls) that make the ratio more nearly optimal will be selected. For didactic purposes I sometimes wrote as if cell volume changes precede those in genome size; often they may, but at any point either type of mutation could come first and would alter selective forces on the other. Whether the net effect is to maintain existing cell size, increase it or reduce it is not part of the theory, but contingent on ecological circumstances. For adaptation to different niches what matters is cell volume and cell growth rates, not genome size per se. As cell sizes and growth rates change during evolution, for reasons that differ greatly among groups, genome size will track these changes through selection for the optimal karyoplasmic ratio.
Genome size is a superb marker for the net outcome of this coevolution but not its determinant. The fact that it changes is an incidental consequence of DNA attachment to the nuclear envelope and it being easier to delete or duplicate DNA than to change its folding pattern. Understanding eukaryote genome size evolution involves universal principles of nuclear and cell volume determination, karyoplasmic ratio, and mutation-selection equilibria, and taxon-specific details of why particular cell sizes or growth rates were selected.
SUMMARY
(1) I explain how DNA amounts and folding determine nuclear volumes and provide the first mathematical formula embodying the main factors, both a simplified version ignoring heterochromatin and a more realistic one allowing for it, which quantitatively fit the observed scaling of nuclear genome size and cell volume. I explain how new evidence on the molecular basis of heterochromatinization, plus the recent rooting of the eukaryote phylogenetic tree between animals and plants, together mean that the ancestral eukaryote (a protozoan) had heterochromatin. I discuss and explain secondary loss of heterochromatin in budding yeast and its reduction in some protists.
(2) I discuss the origin of the nuclear lamina and heterochromatin in the ancestral eukaryote and reassert the idea that the origin of the nuclear envelope and mitosis, by imposing entirely novel selective forces on chromosomes, explains why the scaling laws for bacterial and eukaryotic genome sizes against cell size differ so profoundly.
(3) I explain more fully then previously why the karyoplasmic ratio has to be essentially constant for optimal cell growth. This constancy is the key, together with the structural role of DNA in nuclear assembly, for quantitatively explaining the correlation between cell size and nuclear genome size.
(4) I discuss three examples of genome miniaturization in protists that together show that natural selection can reduce nuclear genome size to an unlimited degree—even to zero in enslaved nuclei of certain algae (nucleomorphs)—if given suitable mutations. This convincingly disproves the selfish DNA theory's assumption that selection is too weak to check genome expansion. Genomic expansion of the cryptomonad host nucleus in the same cell, obeying the general eukaryotic scaling law, means that nuclear non-genic DNA is strongly positively selected for a quantitative function.
(5) I explain how nuclear dimorphism in ciliates uniquely allowed larger cells with smaller genomes and rapid growth to evolve by dissociating micronuclear genome size from macronuclear DNA content—but at the cost of allowing mutation pressure in the non-transcribed germ-line micronuclei to generate harmful mutations and their supressors, jointly able to survive more dramatically than in any other organisms. The much smaller genomes of micronuclei than in other eukaryotes with the same cell size refute the selfish DNA and clearly support the skeletal DNA/karyoplasmic ratio explanation of eukaryote genome sizes.
(6) I explain that although selection is very powerful, adjusting genome sizes freely up and down over large orders of magnitude, nuclear DNA contents are often not strictly optimal, especially if genome size increases suddenly (notably by polyploidy, to a lesser degree by massive transposition or B-chromosomes) when there can be considerable phylogenetic lag in optimization by selection against excess DNA. Sometimes unavailability of mutations retard or indefinitely limit optimization of genome size.
(7) Selfish transposable elements considerably affect the composition and turnover of non-genic DNA, but are not major determinants of its overall amount.
(8) I mention extra complexities of genome size evolution in multicellular organisms, emphasizing the key importance of larger cells for vascular tissue and storage tissues in plants.
(9) I refute fallacious criticisms of the skeletal DNA/karyoplasmic ratio theory of the evolution of nuclear genome size.
(10) The mean size of proliferating eukaryote cells depends on their growth rate plus cell cycle controls over initiation of DNA replication and mitosis. Evidence from recent major advances in cell cycle biology indicate that all three are fundamentally genic and that DNA amount plays no role in feedback loops that initiate DNA replication or mitosis. Therefore purely mutational theories cannot explain the universal correlation between nuclear genome size and cell volume.
Acknowledgments
I thank the UK NERC for research grants, and NERC and the Canadian Institute for Advanced Research for Fellowship support.
LITERATURE CITED
- Alberghina L, Porro D, Cazzador L. 2001. Towards a blueprint of the cell cycle. Oncogene 20: 1128–1134. [DOI] [PubMed] [Google Scholar]
- Baetke KP, Sparrow AH, Naumann CH. 1967. The relationship of DNA content to nuclear and chromosome volumes and to radiosensitivity (LD50). Proceedings of the National Academy of Sciences USA 58: 533–540. [DOI] [PMC free article] [PubMed] [Google Scholar]
- Baranyi M, Greilhuber J. 1999. Genome size in Allium: in quest of reproducible data. Annals of Botany 83: 687–695. [Google Scholar]
- Beaton MJ, Cavalier-Smith T. 1999. Eukaryotic non-coding DNA is functional: evidence from the differential scaling of cryptomonad genomes. Proceedings of the Royal Society of London, Series B 266: 2053–2059. [DOI] [PMC free article] [PubMed] [Google Scholar]
- Belmont AS, Dietzel S, Nye AC, Strukov YG, Tumbar T. 1999. Large-scale chromatin structure and function. Current Opinion in Cell Biology 11: 307–311. [DOI] [PubMed] [Google Scholar]
- Bennett MD. 1972. Nuclear DNA content and minimum generation time in herbaceous plants. Proceedings of the Royal Society of London, Series B 181: 109–135. [DOI] [PubMed] [Google Scholar]
- Bennett MD, Leitch IJ, Hanson L. 1998. DNA amounts in two samples of angiosperm weeds. Annals of Botany 82 (Suppl. A): 121–134. [Google Scholar]
- Broek D, Bartlett R, Crawford K, Nurse P. 1991. Involvement of p34cdc2 in establishing the dependency of S phase on mitosis. Nature 349: 388–393. [DOI] [PubMed] [Google Scholar]
- Brown JH, Gupta VK, Li BL, Milne BT, Restrepo C, West GB. 2002. The fractal nature of nature: power laws, ecological complexity and biodiversity. Philosophical Transactions of the Royal Society of London, Series B 357: 619–626. [DOI] [PMC free article] [PubMed] [Google Scholar]
- Campbell JL, Cohen-Fix O. 2002. Chromosome cohesion: ring around the sisters? Trends in Biochemical Sciences 27: 492–495. [DOI] [PubMed] [Google Scholar]
- Cavalier-Smith T. 1970. Electron microscopic evidence for chloroplast fusion in zygotes of Chlamydomonas reinhardii Nature 228: 333–335. [DOI] [PubMed] [Google Scholar]
- Cavalier-Smith T. 1978. Nuclear volume control by nucleoskeletal DNA, selection for cell volume and cell growth rate, and the solution of the DNA C-value paradox. Journal of Cell Science 34: 247–278. [DOI] [PubMed] [Google Scholar]
- Cavalier-Smith, T. 1980. How selfish is DNA? Nature 285: 617–618. [DOI] [PubMed] [Google Scholar]
- Cavalier-Smith T. 1980. r- and K-tactics in the evolution of protist developmental systems: cell and genome size, phenotype diversifying selection, and cell cycle patterns. BioSystems 12: 43–59. [DOI] [PubMed] [Google Scholar]
- Cavalier-Smith T. 1981. The origin and early evolution of the eukaryotic cell. In: Carlile MJ, Collins JF, Moseley BEB, eds. Molecular and cellular aspects of microbial evolution. Cambridge: Cambridge University Press, 33–84. [Google Scholar]
- Cavalier-Smith T. 1982. Skeletal DNA and the evolution of genome size. Annual Review of Biophysics and Bioengineering 11: 273–302. [DOI] [PubMed] [Google Scholar]
- Cavalier-Smith, T. 1982. The evolution of the nuclear matrix and envelope. In: The nuclear envelope and matrix. Maul GG, ed. New York: Alan R. Liss Inc., 307–318. [Google Scholar]
- Cavalier-Smith T. 1985. Cell volume and the evolution of genome size. In: Cavalier-Smith T, ed. The evolution of genome size. Chichester: Wiley, 105–184. [Google Scholar]
- Cavalier-Smith T. 1985. Eukaryote gene numbers, non-coding DNA and genome size. In: Cavalier-Smith T, ed. The evolution of genome size. Chichester: Wiley, 69–103. [Google Scholar]
- Cavalier-Smith T. 1985. Selfish DNA, intragenomic selection and genome size. In: Cavalier-Smith T. ed. The evolution of genome size. Chichester: Wiley, 253–276. [Google Scholar]
- Cavalier-Smith T. 1985. DNA replication and the evolution of genome size. In: Cavalier-Smith T, ed. The evolution of genome size. Chichester: Wiley, 211–251. [Google Scholar]
- Cavalier-Smith T. 1985. Introduction: the evolutionary significance of genome size. In: Cavalier Smith T, ed. The evolution of genome size. Chichester: Wiley, 1–36. [Google Scholar]
- Cavalier-Smith, T. 1987. Bacterial DNA segregation: its motors and positional control. Journal of Theoretical Biology 127: 361–372. [DOI] [PubMed] [Google Scholar]
- Cavalier-Smith T. 1987. The origin of eukaryotic and archaebacterial cells. Annals of the New York Academy of Sciences 503: 17–54. [DOI] [PubMed] [Google Scholar]
- Cavalier-Smith, T. 1988. Origin of the cell nucleus. BioEssays 9: 72–78. [DOI] [PubMed] [Google Scholar]
- Cavalier-Smith T. 1991. Intron phylogeny: a new hypothesis. Trends in Genetics 7: 145–148. [PubMed] [Google Scholar]
- Cavalier-Smith T 1991. Coevolution of vertebrate genome, cell and nuclear sizes. In: Ghiara G. et al eds. Symposium on the evolution of terrestrial vertebrates. Selected Symposia and Monographs V ZI, 4. Modena: Muchi, 51–88. [Google Scholar]
- Cavalier-Smith T. 1993. Evolution of the eukaryotic genome. In: Broda P, Oliver SG, Sims P, eds. The eukaryotic genome. Cambridge: Cambridge University Press, 333–385. [Google Scholar]
- Cavalier-Smith T. 1995. Membrane heredity, symbiogenesis, and the multiple origins of algae. In: Arai R, Kato M, Doi Y, eds. Biodiversity and evolution. Tokyo: The National Science Museum Foundation, 75–114. [Google Scholar]
- Cavalier-Smith T. 1999. Principles of protein and lipid targeting in secondary symbiogenesis: euglenoid, dinoflagellate, and sporozoan plastid origins and the eukaryotic family tree. Journal of Eukaryotic Microbiology 46: 347–366. [DOI] [PubMed] [Google Scholar]
- Cavalier-Smith T. 2000. Membrane heredity and early chloroplast evolution. Trends in Plant Sciences 5: 174–182. [DOI] [PubMed] [Google Scholar]
- Cavalier-Smith T 2000. What are fungi? In: McLaughlin DJ, McLaughlin EJ, Lemke P, eds. The Mycota. Berlin: Springer-Verlag, 3–37. [Google Scholar]
- Cavalier-Smith T. 2002. The phagotrophic origin of eukaryotes and phylogenetic classification of Protozoa. International Journal of Systematic and Evolutionary Microbiology 52: 297–354. [DOI] [PubMed] [Google Scholar]
- Cavalier-Smith T. 2002. The neomuran origin of archaebacteria, the negibacterial root of the universal tree and bacterial megaclassification. International Journal of Systematic and Evolutionary Microbiology 52: 7–76. [DOI] [PubMed] [Google Scholar]
- Cavalier-Smith T. 2002. Nucleomorphs: enslaved algal nuclei. Current Opinions in Microbiology 5: 612–619. [DOI] [PubMed] [Google Scholar]
- Cavalier-Smith T. 2003. Genomic reduction and evolution of novel genetic membranes and protein-targeting machinery in eukaryote-eukaryote chimaeras (meta-algae). Philosophical Transactions of the Royal Society of London, Series B 358: 109–134. [DOI] [PMC free article] [PubMed] [Google Scholar]
- Cavalier-Smith T. 2003. Protist phylogeny and the high-level classification of Protozoa. European Journal of Protistology 39: 338–348. [Google Scholar]
- Cavalier-Smith T. 2004. The membranome and membrane heredity in development and evolution. In: Hirt RP, Horner DS, eds. Organelles, genomes and eukaryote phylogeny. London: Taylor & Francis. [Google Scholar]
- Cavalier-Smith T. 2004. Chromalveolate diversity and cell megaevolution: interplay of membranes, genomes and cytoskeleton. In: Hirt RP, Horner DS, eds. Organelles, genomes and eukaryote phylogeny. London: CRC Press. [Google Scholar]
- Cavalier-Smith T, Beaton MJ. 1999. The skeletal function of non-genic nuclear DNA: new evidence from ancient cell chimaeras. Genetica 106: 3–13. [DOI] [PubMed] [Google Scholar]
- Cavalier-Smith T, Chao EE. 2003. Phylogeny of Choanozoa, Apusozoa, and other Protozoa and early eukaryote megaevolution. Journal of Molecular Evolution 56: 540–563. [DOI] [PubMed] [Google Scholar]
- Cavalier-Smith T, Chao EE. 2004. Protalveolate phylogeny and systematics and the origins of Sporozoa and dinoflagellates (phylum Myzozoa nom. nov.). European Journal of Protistology 40: 185–212. [Google Scholar]
- Cavalier-Smith T, Chao EE, Oates B. 2004. Molecular phylogeny of Amoebozoa and the evolutionary significance of the unikont Phalansterium European Journal of Protistology 40: 21–48. [Google Scholar]
- Charlesworth B. 1988. The maintenance of transposable elements in natural populations. Basic Life Sciences 47: 189–212. [DOI] [PubMed] [Google Scholar]
- Charlesworth B. 1996. The changing sizes of genes. Nature. 384: 315–316. [DOI] [PubMed] [Google Scholar]
- Chen KC, Csikasz-Nagy A, Gyorffy B, Val J, Novak B, Tyson JJ. 2000. Kinetic analysis of a molecular model of the budding yeast cell cycle. Molecular Biology of the Cell 11: 369–391. [DOI] [PMC free article] [PubMed] [Google Scholar]
- Clyne RK, Katis VL, Jessop L, Benjamin KR, Herskowitz I, Lichten M, Nasmyth K. 2003. Polo-like kinase Cdc5 promotes chiasmata formation and cosegregation of sister centromeres at meiosis I. Nature Cell Biology 5: 480–485. [DOI] [PubMed] [Google Scholar]
- Commoner B. 1964. Roles of deoxyribonucleic acid in inheritance. Nature 202: 960–968. [DOI] [PubMed] [Google Scholar]
- Corner EJH. 1964.The life of plants. London: Weidenfeld & Nicholson. [Google Scholar]
- Craigie RA, Cavalier-Smith T. 1982. Cell volume and the control of the Chlamydomonas cell cycle. Journal of Cell Science. 54: 173–191. [Google Scholar]
- Cross FR, Archambault V, Miller M, Klovstad M. 2002. Testing a mathematical model of the yeast cell cycle. Molecular Biology of the Cell 13: 52–70. [DOI] [PMC free article] [PubMed] [Google Scholar]
- Crow, JF. 1992. The high genomic mutation rate. Current Opinion in Genetics and Development 2: 605–607. [DOI] [PubMed] [Google Scholar]
- Dasilva C, Hadji H, Ozouf-Costaz C, Nicaud S, Jaillon O, Weissenbach J, Crollius HR. 2002. Remarkable compartmentalization of transposable elements and pseudogenes in the heterochromatin of the Tetraodon nigroviridis genome. Proceedings of the National Academy of Sciences USA 99: 13636–13641. [DOI] [PMC free article] [PubMed] [Google Scholar]
- Dhar MK, Friebe B, Koul AK, Gill BS. 2002. Origin of an apparent B chromosome by mutation, chromosome fragmentation and specific DNA sequence amplification. Chromosoma 111: 332–340. [DOI] [PubMed] [Google Scholar]
- Dietzel S, Belmont AS. 2001. Reproducible but dynamic positioning of DNA in chromosomes during mitosis. Nature Cell Biology 3: 767–770. [DOI] [PubMed] [Google Scholar]
- Doolittle WF, Sapienza C. 1980. Selfish genes, the phenotype paradigm and genome evolution. Nature 284: 601–603. [DOI] [PubMed] [Google Scholar]
- Douglas S, Zauner S, Fraunholz M, Beaton M, Penny S, Deng LT, Wu X, Reith M, Cavalier-Smith T, Maier UG. 2001. The highly reduced genome of an enslaved algal nucleus. Nature 410: 1091–1096. [DOI] [PubMed] [Google Scholar]
- Fast NM, Law JS, Williams BA, Keeling PJ. 2003. Bacterial catalase in the microsporidian Nosema locustae: implications for microsporidian metabolism and genome evolution. Eukaryotic Cell 2: 1069–1075. [DOI] [PMC free article] [PubMed] [Google Scholar]
- Forbes DJ, Kirschner MW, Newport JW. 1983. Spontaneous formation of nucleus-like structures around bacteriophage DNA microinjected into Xenopus eggs. Cell 34: 13–23. [DOI] [PubMed] [Google Scholar]
- Frankel J. 1989.Pattern formation: ciliate studies and models. Oxford: Oxford University Press. [Google Scholar]
- Galagan JE and 76 others. 2003. The genome sequence of the filamentous fungus Neurospora crassa Nature 422: 859–868. [DOI] [PubMed] [Google Scholar]
- Gardner MJ and 44 others. 2002. Genome sequence of the human malaria parasite Plasmodium falciparum Nature 419: 498–511. [DOI] [PMC free article] [PubMed] [Google Scholar]
- Gaudin V, Libault M, Pouteau S, Juul T, Zhao G, Lefebvre D, Grandjean O. 2001. Mutations in LIKE HETEROCHROMATIN PROTEIN 1 affect flowering time and plant architecture in Arabidopsis Development 128: 4847–4858. [DOI] [PubMed] [Google Scholar]
- Gendrel AV, Lippman Z, Yordan C, Colot V, Martienssen RA. 2002. Dependence of heterochromatic histone H3 methylation patterns on the Arabidopsis gene DDM1. Science 297: 1871–1873. [DOI] [PubMed] [Google Scholar]
- Gerace L, Blobel G. 1982. Nuclear lamina and the structural organization of the nuclear envelope. Cold Spring Harbor Symposia in Quantitative Biology 46 Pt 2: 967–978. [DOI] [PubMed] [Google Scholar]
- Gindullis F, Meier I. 1999. Matrix attachment region binding protein MFP1 is localized in discrete domains at the nuclear envelope. Plant Cell 11: 1117–1128. [DOI] [PMC free article] [PubMed] [Google Scholar]
- Gindullis F, Rose A, Patel S, Meier I. 2002. Four signature motifs define the first class of structurally related large coiled-coil proteins in plants. BMC Genomics 3: 9. [DOI] [PMC free article] [PubMed] [Google Scholar]
- Gonzalez-Sanchez M, Gonzalez-Gonzalez E, Molina F, Chiavarino AM, Rosato M, Puertas MJ. 2003. One gene determines maize B chromosome accumulation by preferential fertilisation; another gene(s) determines their meiotic loss. Heredity 90: 122–129. [DOI] [PubMed] [Google Scholar]
- Gould SJ. 1977.Ever since Darwin. New York: Norton. [Google Scholar]
- Gregory TR. 2001. Coincidence, coevolution, or causation? DNA content, cell size, and the C-value enigma. Biological Reviews of the Cambridge Philosophical Society 76: 65–101. [DOI] [PubMed] [Google Scholar]
- Gregory TR. 2003. Is small indel bias a determinant of genome size? Trends in Genetics 19: 485–488. [DOI] [PubMed] [Google Scholar]
- Gregory TR, Hebert PD, Kolasa J. 2000. Evolutionary implications of the relationship between genome size and body size in flatworms and copepods. Heredity 84: 201–208. [DOI] [PubMed] [Google Scholar]
- Grewal SIS, Moazad D. 2003. Heterochromatin and epigenetic control of gene expression. Science 301: 798–802. [DOI] [PubMed] [Google Scholar]
- Grime JP, Mowforth MA. 1982. Variation in genome size, an ecological interpretation. Nature 299: 151–153. [Google Scholar]
- Gruber S, Haering CH, Nasmyth K. 2003. Chromosomal cohesin forms a ring. Cell 112: 765–777. [DOI] [PubMed] [Google Scholar]
- Gruenbaum Y, Goldman RD, Meyuhas R, Mills E, Margalit A, Fridkin A, Dayani Y, Prokocimer M, Enosh A. 2003. The nuclear lamina and its functions in the nucleus. International Review of Cytology 226: 1–62. [DOI] [PubMed] [Google Scholar]
- Gurdon JR. 1968. The cytoplasmic control of nuclear activity in animal development. Biological Reviews 43: 233–267. [DOI] [PubMed] [Google Scholar]
- Harder PA, Silverstein RA, Meier I. 2000. Conservation of matrix attachment region-binding filament-like protein 1 among higher plants. Plant Physiology 122: 225–234. [DOI] [PMC free article] [PubMed] [Google Scholar]
- Harold F. 1995. From morphogenesis to morphogenesis. Microbiology 141: 2765–2778. [DOI] [PubMed] [Google Scholar]
- Harper JT, Keeling PJ. 2003. Nucleus-encoded, plastid-targeted glyceraldehyde-3-phosphate dehydrogenase (GAPDH) indicates a single origin for chromalveolate plastids. Molecular Biology and Evolution 20: 1730–1735. [DOI] [PubMed] [Google Scholar]
- Harris H. 1970Nucleus and cytoplasm. 2nd Ed. Oxford: Clarendon Press. [Google Scholar]
- Harvey P, Pagel M. 1991.The comparative method in evolutionary biology. Oxford: Oxford University Press. [Google Scholar]
- Hediger F, Neumann FR, Van Houwe G, Dubrana K, Gasser SM. 2002. Live imaging of telomeres: yKu and Sir proteins define redundant telomere-anchoring pathways in yeast. Current Biology 12: 2076–2089. [DOI] [PubMed] [Google Scholar]
- Hennig L, Taranto P, Walser M, Schonrock N, Gruissem W. 2003.Arabidopsis MSI1 is required for epigenetic maintenance of reproductive development. Development 130: 2555–2565. [DOI] [PubMed] [Google Scholar]
- Herrmann U, Soppa J. 2002. Cell cycle-dependent expression of an essential SMC-like protein and dynamic chromosome localization in the archaeon Halobacterium salinarum Molecular Microbiology 46: 395–409. [DOI] [PubMed] [Google Scholar]
- van't Hof J, Sparrrow AH. 1963. A relationship between DNA content, nuclear volume and minimum mitotic cycle time. Proceedings of the National Academy of Sciences USA 49: 897–902. [DOI] [PMC free article] [PubMed] [Google Scholar]
- Houben A, Demidov D, Gernand D, Meister A, Leach CR, Schubert I. 2003. Methylation of histone H3 in euchromatin of plant chromosomes depends on basic nuclear DNA content. Plant Journal 33: 967–973. [DOI] [PubMed] [Google Scholar]
- Ilic K, SanMiguel PJ, Bennetzen JL. 2003. A complex history of rearrangement in an orthologous region of the maize, sorghum, and rice genomes. Proceedings of the National Academy of Sciences USA 100: 12265–12270. [DOI] [PMC free article] [PubMed] [Google Scholar]
- Ingraham JL, Maaløe O, Neidhardt FC. 1983.Growth of the bacterial cell. Sunderland, MA: Sinauer. [Google Scholar]
- Jeong SY, Rose A, Meier I. 2003. MFP1 is a thylakoid-associated, nucleoid-binding protein with a coiled-coil structure. Nucleic Acids Research 31: 5175–5185. [DOI] [PMC free article] [PubMed] [Google Scholar]
- Johnson L, Cao X, Jacobsen S. 2002. Interplay between two epigenetic marks. DNA methylation and histone H3 lysine 9 methylation. Current Biology 12: 1360–1367. [DOI] [PubMed] [Google Scholar]
- Keeling PJ. 2003. Congruent evidence from alpha-tubulin and beta-tubulin gene phylogenies for a zygomycete origin of microsporidia. Fungal Genetics and Biology 38: 298–309. [DOI] [PubMed] [Google Scholar]
- Keeling PJ, Fast NM. 2002. Microsporidia: biology and evolution of highly reduced intracellular parasites. Annual Review of Microbiology 56: 93–116. [DOI] [PubMed] [Google Scholar]
- Knight CA, Ackerley DD. 2002. Variation in nuclear DNA content across environmental gradients: a quantile regression analysis. Ecology Letters 5: 66–76. [Google Scholar]
- Kondrashov AS, Shabalina SA. 2002. Classification of common conserved sequences in mammalian intergenic regions. Human Molecular Genetics 11: 669–674. [DOI] [PubMed] [Google Scholar]
- Kotake T, Takada S, Nakahigashi K, Ohto M, Goto K. 2003.Arabidopsis TERMINAL FLOWER 2 gene encodes a heterochromatin protein 1 homolog and represses both FLOWERING LOCUS T to regulate flowering time and several floral homeotic genes. Plant Cell Physiology 44: 555–564. [DOI] [PubMed] [Google Scholar]
- Krauss SW, Chen C, Penman S, Heald R. 2003. Nuclear actin and protein 4·1: essential interactions during nuclear assembly in vitro Proceedings of the National Academy of Sciences USA 100: 10752–10757. [DOI] [PMC free article] [PubMed] [Google Scholar]
- Laabs TL, Markwardt DD, Slattery MG, Newcomb LL, Stillman DJ, Heideman W. 2003. ACE2 is required for daughter cell-specific G1 delay in Saccharomyces cerevisiae Proceedings of the National Academy of Sciences USA 100: 10275–10280. [DOI] [PMC free article] [PubMed] [Google Scholar]
- Lang BF, O'Kelly C, Nerad T, Gray MW, Burger G. 2002. The closest unicellular relatives of animals. Current Biology 12: 1773–1778. [DOI] [PubMed] [Google Scholar]
- Lang S, Loidl J. 1993. Identification of proteins immunologiocally related to vertebrate lamins in the nuclear matrix of the myxomycete Physarum polycephalum European Journal of Cell Biology 61: 177–183. [PubMed] [Google Scholar]
- Lehnertz B, Ueda Y, Derijck AA, Braunschweig U, Perez-Burgos L, Kubicek S, Chen T, Li E, Jenuwein T, Peters AH. 2003. Suv39 h-mediated histone H3 lysine 9 methylation directs DNA methylation to major satellite repeats at pericentric heterochromatin. Current Biology 13: 1192–1200. [DOI] [PubMed] [Google Scholar]
- Leitch IJ, Hanson L, Winfield D, Parker J, Bennett MD. 2001. Nuclear DNA C-values complete familial representation in gymnosperms. Annals of Botany 88: 843–849. [Google Scholar]
- Leitch IJ, Soltis DE, Soltis PS, Bennett MD. 2005. Evolution of DNA amounts across land plants (Embryophyta). Annals of Botany 95: 207–217. [DOI] [PMC free article] [PubMed] [Google Scholar]
- Lygerou Z, Nurse P. 2000. Controlling S-phase onset in fission yeast. Cold Spring Harbor Symposia in Quantitative Biology 65: 323–332. [DOI] [PubMed] [Google Scholar]
- McAinsh AD, Tytell JD, Sorger PK. 2003. Structure, function, and regulation of budding yeast kinetochores. Annual Review of Cell and Developmental Biology 19: 519–539. [DOI] [PubMed] [Google Scholar]
- Martins S, Eikvar S, Furukawa K, Collas P. 2003. HA95 and LAP2 beta mediate a novel chromatin-nuclear envelope interaction implicated in initiation of DNA replication. Journal of Cell Biology 160: 177–188. [DOI] [PMC free article] [PubMed] [Google Scholar]
- Minguez A, Moreno Diaz de la Espina S. 1993. Immunological characterization of lamins in the nuclear matrix of onion cells. Journal of Cell Science 106: 431–439. [DOI] [PubMed] [Google Scholar]
- Mirsky AE, Ris H. 1951. The DNA content of animal cells and its evolutionary significance. Journal of General Physiology 34: 451–462. [DOI] [PMC free article] [PubMed] [Google Scholar]
- Mounkes L, Kozlov S, Burke B, Stewart CL. 2003. The laminopathies: nuclear structure meets disease. Current Opinion in Genetics and Development 13: 223–230. [DOI] [PubMed] [Google Scholar]
- Narayan RKJ. 1983. Chromosome changes in evolution of Lathyrus species. In: Brandham PE, Bennett MD, eds. Kew chromosome conference II. London: Allen & Unwin, 243–250. [Google Scholar]
- Nasmyth K. 1995. Evolution of the cell cycle. Philosophical Transactions of the Royal Society of London, Series B 349: 271–281. [DOI] [PubMed] [Google Scholar]
- Nasmyth K. 1996. At the heart of the budding yeast cell cycle. Trends in Genetics 12: 405–412. [DOI] [PubMed] [Google Scholar]
- Nicolini C, Belmont AS, Martelli A. 1986. Critical nuclear DNA size and distribution associated with S phase initiation. Peripheral location of initiation and termination sites. Cell Biophysics 8: 103–117. [DOI] [PubMed] [Google Scholar]
- Nicolini C, Carlo P, Finollo R, Vigo F, Cavazza B, Ledda A, Ricci E, Brambilla G. 1984. Phase transitions in nuclei and chromatin. Is nuclear volume controlled by the chromatin or by the nuclear matrix? Cell Biophysics 6: 183–196. [DOI] [PubMed] [Google Scholar]
- Novak B, Csikasz-Nagy A, Gyorffy B, Nasmyth K, Tyson JJ. 1998. Model scenarios for evolution of the eukaryotic cell cycle. Philosophical Transactions of the Royal Society of London, Series B 353: 2063–2076. [DOI] [PMC free article] [PubMed] [Google Scholar]
- Novak B, Pataki Z, Ciliberto A, Tyson JJ. 2001. Mathematical model of the cell division cycle of fission yeast. Chaos 11: 277–286. [DOI] [PubMed] [Google Scholar]
- Nurse P. 1985. The genetic control of cell volume. In: Cavalier Smith T, ed. The evolution of genome size. Chichester: Wiley, 185–196. [Google Scholar]
- Obermayer R, Leitch IJ, Hanson L, Bennett MD. 2002. Nuclear DNA C-values in 30 species double the familial representation in pteridophytes. Annals of Botany 90: 209–217. [DOI] [PMC free article] [PubMed] [Google Scholar]
- Ohno S. 1972. So much ‘junk’ in our genome. In: Smith HH, ed. Evolution of genetic systems, Brookhaven symposia in biology. New York: Gordon & Breach, 366–370. [Google Scholar]
- Orgel LE, Crick FH. 1980. Selfish DNA: the ultimate parasite. Nature 284: 604–607. [DOI] [PubMed] [Google Scholar]
- Orgel LE, Crick FH, Sapienza C. 1980. Selfish DNA. Nature 288: 645–646. [DOI] [PubMed] [Google Scholar]
- Ostashevsky J. 2002. A polymer model for large-scale chromatin organization in lower eukaryotes. Molecular Biology of the Cell 13: 2157–2169. [DOI] [PMC free article] [PubMed] [Google Scholar]
- Paddy MR, Belmont AS, Saumweber H, Agard DA, Sedat JW. 1990. Interphase nuclear envelope lamins form a discontinuous network that interacts with only a fraction of the chromatin in the nuclear periphery. Cell 62: 89–106. [DOI] [PubMed] [Google Scholar]
- Pagel M, Johnstone RA. 1992. Variation across species in the size of the nuclear genome supports the junk-DNA hypothesis. Proceedings of the Royal Society of London, Series B 249: 119–124. [DOI] [PubMed] [Google Scholar]
- Petrov DA. 2001. Evolution of genome size: new approaches to an old problem. Trends in Genetics 17: 23–28. [DOI] [PubMed] [Google Scholar]
- Petrov DA. 2002. Mutational equilibrium model of genome size evolution. Theoretical Population Biology 61: 531–544. [DOI] [PubMed] [Google Scholar]
- Prescott DM, Prescott JD, Prescott RM. 2002. Coding properties of macronuclear DNA molecules in Sterkiella nova (Oxytricha nova). Protist 153: 71–77. [DOI] [PubMed] [Google Scholar]
- Price HJ, Dillon SL, Hodnett G, Rooney WL, Ross L, Johnston JS. 2005. Genome evolution in the genus Sorghum (Poaceae). Annals of Botany 95: 219–227. [DOI] [PMC free article] [PubMed] [Google Scholar]
- Rabitsch KP, Petronczki M, Javerzat JP, Genier S, Chwalla B, Schleiffer A, Tanaka TU, Nasmyth K. 2003. Kinetochore recruitment of two nucleolar proteins is required for homolog segregation in meiosis I. Developmental Cell 4: 535–948. [DOI] [PubMed] [Google Scholar]
- Rabl C. 1885. Uber Zelltheilung. Morphologishe Jahrbuch 10: 214–330. [Google Scholar]
- Raikov IB. 1982.The protozoan nucleus: morphology and evolution. Vienna: Springer-Verlag. [Google Scholar]
- Salthe S. 1969. Reproductive modes and the number and sizes of ova in the urodeles. American Midland Naturalist 81: 467–490. [Google Scholar]
- Samaniego R, Yu W, Meier I, Moreno Diaz de la Espina S. 2001. Characterisation and high-resolution distribution of a matrix attachment region-binding protein (MFP1) in proliferating cells of onion. Planta 212: 535–546. [DOI] [PubMed] [Google Scholar]
- SanMiguel P, Gaut BS, Tikhonov A, Nakajima Y, Bennetzen JL. 1998. The paleontology of intergene retrotransposons of maize. Nature Genetics 20: 43–45. [DOI] [PubMed] [Google Scholar]
- Schleiffer A, Kaitna S, Maurer-Stroh S, Glotzer M, Nasmyth K, Eisenhaber F. 2003. Kleisins: a superfamily of bacterial and eukaryotic SMC protein partners. Molecular Cell 11: 571–575. [DOI] [PubMed] [Google Scholar]
- Sharp JA, Kaufman PD. 2003. Chromatin proteins are determinants of centromere function. Current Topics in Microbiology and Immunology 274: 23–52. [DOI] [PMC free article] [PubMed] [Google Scholar]
- Sharp JA, Krawitz DC, Gardner KA, Fox CA, Kaufman PD. 2003. The budding yeast silencing protein Sir1 is a functional component of centromeric chromatin. Genes and Development 17: 2356–2361. [DOI] [PMC free article] [PubMed] [Google Scholar]
- Shiio Y, Eisenman RN. 2003. Histone sumoylation is associated with transcriptional repression. Proceedings of the National Academy of Sciences USA: [DOI] [PMC free article] [PubMed] [Google Scholar]
- Shuter BJ, Thomas JE, Taylor WD, Zimmerman AM. 1983. Phenotypic correlates of genomic DNA content in unicellular eukaryotes and other cells. American Naturalist 122: 26–54. [Google Scholar]
- Sonneborn TM. 1963. Does preformed structure play an essential role in cell heredity? In: Allen JM, ed. The nature of biological diversity. New York: McGraw Hill, 165–221. [Google Scholar]
- Soppa J. 2001. Prokaryotic structural maintenance of chromosomes (SMC) proteins: distribution, phylogeny, and comparison with MukBs and additional prokaryotic and eukaryotic coiled-coil proteins. Gene 278: 253–264. [DOI] [PubMed] [Google Scholar]
- Soppe WJ, Jasencakova Z, Houben A, Kakutani T, Meister A, Huang MS, Jacobsen SE, Schubert I, Fransz PF. 2002. DNA methylation controls histone H3 lysine 9 methylation and heterochromatin assembly in Arabidopsis EMBO Journal 21: 6549–6559. [DOI] [PMC free article] [PubMed] [Google Scholar]
- Spadiliero B, Nicolini C, Mascetti G, Henriquez D, Vergani L. 2002. Chromatin of Trypanosoma cruzi: in situ analysis revealed its unusual structure and nuclear organization. Journal of Cell Biochemistry 85: 798–808. [DOI] [PubMed] [Google Scholar]
- Stechmann A, Cavalier-Smith T. 2002. Rooting the eukaryote tree by using a derived gene fusion. Science 297: 89–91. [DOI] [PubMed] [Google Scholar]
- Stechmann A, Cavalier-Smith T. 2003. The root of the eukaryote tree pinpointed. Current Biology 13, R665–R666. [DOI] [PubMed] [Google Scholar]
- Stern B, Nurse P. 1996. A quantitative model for the cdc2 control of S phase and mitosis in fission yeast. Trends in Genetics 12: 345–350. [PubMed] [Google Scholar]
- Stevenson DS, Jarvis P. 2003. Chromatin silencing: RNA in the driving seat. Current Biology 13: R13–R15. [DOI] [PubMed] [Google Scholar]
- Stierle V, Couprie J, Ostlund C, Krimm I, Zinn-Justin S, Hossenlopp P, Worman HJ, Courvalin JC, Duband-Goulet I. 2003. The carboxyl-terminal region common to lamins A and C contains a DNA binding domain. Biochemistry 42: 4819–4828. [DOI] [PubMed] [Google Scholar]
- Strasburger E. 1893. Über die Wirkungssphäre der Kerne und die Zellengrösse. Histologische Beitrag 5: 97–124. [Google Scholar]
- Sveiczer A, Csikasz-Nagy A, Gyorffy B, Tyson JJ, Novak B. 2000. Modeling the fission yeast cell cycle: quantized cycle times in wee1-cdc25Delta mutant cells. Proceedings of the National Academy of Sciences USA 97: 7865–7870. [DOI] [PMC free article] [PubMed] [Google Scholar]
- Szarski H. 1970. Changes in the amount of DNA in cell nuclei during vertebrate evolution. Nature 226: 651–652. [DOI] [PubMed] [Google Scholar]
- Szarski H. 1976. Cell size and nuclear DNA content in vertebrates. International Review of Cytology 44: 93–111. [DOI] [PubMed] [Google Scholar]
- Szarski H. 1983. Cell size and the concept of wasteful and frugal evolutionary strategies. Journal of Theoretical Biology 105: 201–209. [DOI] [PubMed] [Google Scholar]
- Tamaru H, Zhang X, McMillen D, Singh PB, Nakayama J, Grewal SI, Allis CD, Cheng X, Selker EU. 2003. Trimethylated lysine 9 of histone H3 is a mark for DNA methylation in Neurospora crassa Nature Genetics 34: 75–79. [DOI] [PubMed] [Google Scholar]
- Tariq M, Saze H, Probst AV, Lichota J, Habu Y, Paszkowski J. 2003. Erasure of CpG methylation in Arabidopsis alters patterns of histone H3 methylation in heterochromatin. Proceedings of the National Academy of Sciences USA 100: 8823–8827. [DOI] [PMC free article] [PubMed] [Google Scholar]
- Thompson K. 1990. Genome size, seed size and germination temperature in herbaceous angiosperms. Evolutionary Trends in Plants 4: 113–116. [Google Scholar]
- Tikhonov AP, Lavie L, Tatout C, Bennetzen JL, Avramova Z, Deragon JM. 2001. Target sites for SINE integration in Brassica genomes display nuclear matrix binding activity. Chromosome Research 9: 325–337. [DOI] [PubMed] [Google Scholar]
- Toth A, Rabitsch KP, Galova M, Schleiffer A, Buonomo SB, Nasmyth K. 2000. Functional genomics identifies monopolin: a kinetochore protein required for segregation of homologs during meiosis I. Cell 103: 1155–1168. [DOI] [PubMed] [Google Scholar]
- Trombetta VV. 1942. The cytonuclear ratio. Botanical Review 8: 317–336. [Google Scholar]
- Vazquez J, Belmont AS, Sedat JW. 2001. Multiple regimes of constrained chromosome motion are regulated in the interphase Drosophila nucleus. Current Biology 11: 1227–1239. [DOI] [PubMed] [Google Scholar]
- Vershinin AV, Schwarzacher T, Heslop-Harrison JS. 1995. The large-scale genomic organization of repetitive DNA families at the telomeres of rye chromosomes. Plant Cell 7: 1823–1833. [DOI] [PMC free article] [PubMed] [Google Scholar]
- Vialli M. 1957. Volume et contenu en ADN par noyau. Experimental Cell Research, Suppl. 4: 283–293. [PubMed] [Google Scholar]
- Vinogradov AE. 1998. Buffering: a possible passive-homeostasis role for redundant DNA. Journal of Theoretical Biology 193: 197–199. [DOI] [PubMed] [Google Scholar]
- Vinogradov AE. 1999. Intron-genome size relationship on a large evolutionary scale. Journal of Molecular Evolution 49: 376–384. [DOI] [PubMed] [Google Scholar]
- Vivares C, Gouy M, Thomarat F, Metenier G. 2002. Functional and evolutionary analysis of a eukaryotic parasitic genome. Current Opinion in Microbiology 5: 499–503. [DOI] [PubMed] [Google Scholar]
- Vogelmayr H. 2000. Nuclear DNA amounts in mosses. Annals of Botany 85: 531–546. [Google Scholar]
- Volkov A, Mascarenhas J, Andrei-Selmer C, Ulrich HD, Graumann PL. 2003. A prokaryotic condensin/cohesin-like complex can actively compact chromosomes from a single position on the nucleoid and binds to DNA as a ring-like structure. Molecular Cell Biology 23: 5638–5650. [DOI] [PMC free article] [PubMed] [Google Scholar]
- Wen J. 2000. The nuclear matrix of Euglena gracilis (Euglenophyta): a stage in nuclear matrix evolution. Biology of the Cell 92: 125–131. [DOI] [PubMed] [Google Scholar]
- Wendel JF, Cronn RC, Johnston JS, Price HJ. 2002. Feast and famine in plant genomes. Genetica 115: 37–47. [DOI] [PubMed] [Google Scholar]
- West GB, Brown JH, Enquist BJ. 1997. A general model for the origin of allometric scaling laws in biology. Science 276: 122–126. [DOI] [PubMed] [Google Scholar]
- West GB, Brown JH, Enquist BJ. 1999. The fourth dimension of life: fractal geometry and allometric scaling of organisms. Science 284: 1677–1679. [DOI] [PubMed] [Google Scholar]
- West GB, Woodruff WH, Brown JH. 2002. Allometric scaling of metabolic rate from molecules and mitochondria to cells and mammals. Proceedings of the National Academy of Sciences USA 99 (Suppl 1): 2473–2478. [DOI] [PMC free article] [PubMed] [Google Scholar]
- Williams BA, Hirt RP, Lucocq JM, Embley TM. 2002. A mitochondrial remnant in the microsporidian Trachipleistophora hominis Nature 418: 865–869. [DOI] [PubMed] [Google Scholar]
- Wilson EB. 1925.The cell in development and heredity. 3rd Ed. New York: Macmillan. [Google Scholar]
- Wong C, Stearns, T. 2003. Centrosome number is controlled by a centrosome-intrinsic block to reduplication. Nature Cell Biology 5: 539–544. [DOI] [PubMed] [Google Scholar]
- Yang L, Guan T, Gerace L. 1997. Lamin-binding fragment of LAP2 inhibits increase in nuclear volume during the cell cycle and progression into S phase. Journal of Cell Biology 139: 1077–1087. [DOI] [PMC free article] [PubMed] [Google Scholar]
- Zauner S, Fraunholz M, Wastl J, Penny S, Beaton M, Cavalier-Smith T, Maier UG, Douglas S. 2000. Chloroplast protein and centrosomal genes, a tRNA intron, and odd telomeres in an unusually compact eukaryotic genome, the cryptomonad nucleomorph. Proceedings of the National Academy of Sciences USA 97: 200–205. [DOI] [PMC free article] [PubMed] [Google Scholar]