

Abstract
• Background and Aims Within Oncidiinae, there are several groups of species that are effectively annuals, and we wished to see if these species had smaller genome sizes than average for the subtribe.
• Methods Fifty-four genome size estimates (50 of which are new) for species in subtribe Oncidiinae (Orchidaceae) were examined for the first time in a phylogenetic context to evaluate hypotheses concerning genome sizes and life history traits.
• Results and Conclusions Within the limits of still relatively sparse sampling, the species that are effectively annuals do appear to have smaller genome sizes than average. However, the genome sizes of their immediate sister group are also small, indicating that changes in genome size preceded the change in life history traits. Genome sizes and chromosome numbers also do not correlate; some slowly growing species have lower chromosome numbers but large genomes and vice versa. Based on a survey of the literature on orchids, it is also clear that epiphytic species have smaller genome sizes than do terrestrial species, which could be an effect of different water relations or the fact that most terrestrial orchids are geophytic or have distinct growth and dormancy phases.
Keywords: Genome size, orchids, phylogenetics, Oncidiinae, twig epiphytes, character optimization, chromosome number
INTRODUCTION
The oncidioid orchids (Oncidiinae; Orchidaceae) are the second largest orchid subtribe in the New World tropics and subtropics (1700 species; 55 genera). They range from Argentina and Peru to northern Mexico and Florida and are common throughout the Caribbean region from sea level up to the páramos of the Andes, mostly as epiphytes but occasionally growing terrestrially. They occupy nearly all types of epiphytic sites, from the larger limbs of trees in dense shade to the ultimate axes, twigs, in high light (Chase, 1988). They are also diverse in their pollinator relationships and exhibit flower types adapted to a range of different animals, including butterflies, hummingbirds and several types of bees (even male euglossines that collect fragrance compounds; van der Pijl et al., 1966). Most species do not offer rewards to their pollen vectors, but rather attract visitors by deceit of various forms, including the pseudocopulatory syndrome (e.g. in Tolumnia henekenii, Telipogon, etc.) that also occurs independently in various European and Australian orchids.
Chromosome numbers of Oncidiinae have been the focus of much attention because of their great range, from n = 5–30 in what are apparently diploids, as well as some higher counts in obvious polyploids (those reported here and elsewhere in this paper are diploid counts reviewed in Chase, 1986a and Tanaka and Kamemoto, 1984). Some authors explained these numbers in terms of n = 5 being the base number, such that the higher numbers up to 30 are the products of hybridization followed by polyploidy (Garay, 1970), but others believed the primitive numbers in the subtribe to be n = 28, 30. The lower numbers would thus reflect the effects of chromosome fusions (Chase, 1986a, 1987). A study of isozyme numbers (Chase and Olmstead, 1988) demonstrated no particular patterns of duplication that would indicate changes in ploidy, leaving the impression that although the subtribe may have chromosome numbers indicative of ancestral polyploidy, the extant members are effectively diploids in terms of expression patterns.
Life history strategies in Oncidiinae are also good examples of extremes. Typical of many epiphytic orchids, most Oncidiinae are relatively slow to reach maturity. Many Oncidiinae take up to 5 years. These plants live in more typical epiphytic sites, such as the main axes of trees. Other Oncidiinae (e.g. Erycina, syn. Psygmorchis) develop extremely rapidly and are effectively annuals (Chase, 1988; Chase and Palmer, 1997). Although these rapid cyclers reach flowering size within a year from germination, they can persist longer if they occupy favourable sites. There are reports of flowering individuals occurring on leaves of bushes and trees such as Coffea (Rubiaceae), Hibiscus (Malvaceae) and Psidium (Myrtaceae), so it is clear that they develop quickly and live in sites completely devoid of other epiphytic taxa. These rapid cyclers also have lower chromosome numbers than plants living in more typical epiphytic sites, and these lower numbers presumably have been achieved through fusion. The species with the lowest number, Erycina (Psygmorchis) pusilla, n = 5, clearly has much larger chromosomes than species with n = 28, 30 (Chase, pers. obs.). It might be postulated that genome sizes of species with lower numbers are smaller and that fusing chromosomes might be involved in the process leading to reduction in genome size, which would then permit these plants to become rapid cyclers. Quick development or early onset of maturity would then permit these species to live on twigs, which are ephemeral epiphytic sites relative to other types (such as the larger axes like tree trunks). Heterochromatic shifts leading to paedomorphosis have been postulated as a mechanism to permit quick maturation (Chase and Palmer, 1997); all Oncidiinae have dimorphic development with the seedling stage being psygmoid (fan-shaped) with no pseudobulbs and unifacial leaves, versus the adults with most species having pseudobulbs and conduplicate leaves (for illustrations see Chase, 1986b, 1988). Many twig epiphytes, such as E. pusilla, never develop pseudobulbs or conduplicate leaves and flower while still psygmoid. However, not all species of Oncidiinae with lower chromosome numbers are rapid cyclers. For example, Trichocentrum species such as T. tigrinum and T. capistratum have n = 12 or 14, but these species occur in stable epiphytic sites such as the mossy trunks of trees and do not mature rapidly, so it is clear that lower chromosome numbers are not exclusively associated with ephemeral sites.
There are reasons in addition to reduction in genome size that have been suggested for why decreases in chromosome number would be advantageous. Stebbins (1950) hypothesized that fusion of chromosomes leading to lower numbers would lead to linkage groups of traits that otherwise sort independently, and thus fusion of chromosomes would link together genes with favourable combinations of alleles. This could thus be adaptive for plants that live in highly stressful environments, and many species with low chromosome numbers are adapted to harsh habitats, such as here with the twig epiphytes. The species of Trichocentrum mentioned above live in low-light situations and are often found covered by mosses, so it is possible that they are subjected to a degree of light stress, leading to chromosome fusions to link loci that could otherwise segregate independently. Furthermore, there is a correlation in taxa with lower chromosome numbers to modifications of habit. The unusual habits of many of the twig epiphytes are described above and in Chase (1988); in contrast those taxa living in more humid but shady sites, such as Trichocentrum, have no pseudobulbs (water-storage organs typical of the great majority of Oncidiinae taxa and other epiphytic groups of orchids) and either much wider leaves for their lengths (the latter perhaps adaptive in low light conditions) or terete leaves (another modification for drought).
With all these variations in chromosome number, vegetative morphology and life history strategies, species in Oncidiinae are an excellent group to study the dynamics of evolution (Chase and Palmer, 1997). Phylogenetic studies of Oncidiinae are at a highly advanced stage, starting with studies in the late 1980s using restriction endonuclease site mapping (Chase and Palmer, 1989, 1992) and continuing with DNA sequence studies involving regions from both the nuclear and plastid genomes (Williams et al., 2001a, b). These studies provide a robust framework from which to view these other phenomena; for example, the highly derivative status of species with the lowest chromosome numbers, such as E. pusilla, have been confirmed by these studies, and it is clear that the Trichocentrum species with the lowest numbers are derived terminal taxa within a clade in which a descending series can be observed (from n = 24 down to 12; Chase and Palmer, 1992).
Although variation in chromosome number in Oncidiinae has been well studied and good phylogenetic evidence exists for lower numbers and traits associated with twig epiphytism being derivative, no previous study has focused on genome size in these plants. Genome size has been documented to have a clear correlation with cell size and generation time (Bennett, 1972; Cavalier-Smith, 1978, 2005), and in the context of water relations then cell size may be subject to directional selection. The skeletal theory of genome size (Cavalier-Smith, 1978, 1985, 2005) would predict that selection for smaller cell size, perhaps through water relations mediated by guard cell size and size of the stoma, should have the effect of reducing genome size. Although chromosome fusion could also reduce genome size, this relationship could be confounded with those operating on cell volume and cell cycle. However, chromosome fusion need not have an effect on genome size, particularly if selection on cell size is directed at larger cells being adaptive, for example under conditions of higher humidity and low light. Oncidiinae with their diversity of characteristics are an ideal group in which to examine these ideas in a phylogenetic context.
Therefore, we will address in this paper the following topics: (1) the ranges of genome sizes in Orchidaceae, and particularly Oncidiinae and their outgroup tribes; (2) the putative relationship found between chromosome fusion leading to lower chromosome numbers, lower genome sizes, and rapid-cycling species, such as the twig epiphytes; (3) evidence for alterations in genome sizes, both up and down, in the context of a phylogenetic hypothesis for Oncidiinae; and (4) whether reductions/increases in genome size preceded the alterations in life history traits described above (i.e. do the more typical sister taxa of these modified plants have similar genome sizes?).
MATERIALS AND METHODS
Phylogenetic studies
The cladogram presented in Fig. 1 is a summary cladogram based on the studies of Williams, Chase, Whitten and collaborators (Chase and Palmer, 1992; Williams et al., 2001a, b). No new phylogenetic analyses were carried out for this paper; for details of DNA extraction, PCR, cycle sequencing and phylogenetic analyses see Williams et al. (2001a, b). The higher-level patterns of relationships shown are well supported (by the bootstrap) in the DNA sequence analyses, in particular the critical relationships of the taxa with alterations of life history strategies. We have not added bootstrap percentages to the figure because the taxa included here have never all been included in the same analysis, although all have been included in at least one of the published studies. Thus inclusion of bootstrap percentages is not appropriate because no analysis has studied the exact set of taxa summarized in this figure.
Fig. 1.
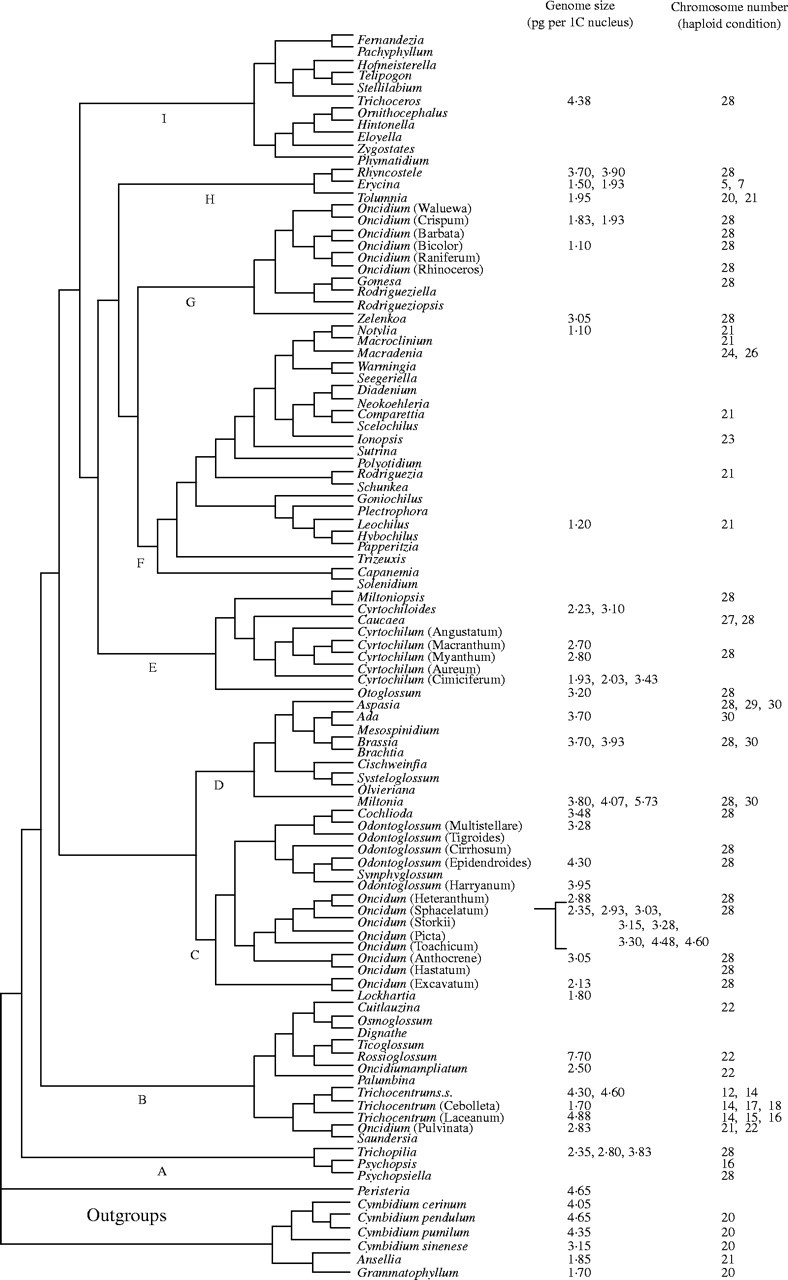
Summary cladogram (constructed by hand) based on results published by Chase and Palmer (1992) and Williams et al. (2001a, b). For genera in which more than one species group was included, the genus name followed by the species group name in brackets is indicated.
Genome size estimates
Two methods of analysis of genome sizes were employed in collecting the 50 new estimates reported here: Feulgen-staining with Hordeum and Vigna as the calibration standard (RBG, Kew, UK) and DAPI fluorescence with chick erythrocytes (Brown University, USA).
For Feulgen microdensitometry measurements, slides were measured on a Vickers M85a microdensitometer according to the methods described in Hanson et al. (2001). Hordeum vulgare ‘Sultan’ was used as a calibration standard for all species, having a known DNA C-value of 1C = 5·56 pg (Bennett and Leitch, 1995). Procedures for DAPI followed the standard ones (Geber and Hasibeder, 1980).
Some closely related species were evaluated by both methods with good agreement (e.g. Cyrtochilum serratum at 2·70 pg and C. loxense at 2·80 pg, both in a 1C nucleus; Table 1; http://www.rbgkew.org.uk/cval/homepage.html). Selection of taxa was governed by availability and a desire to obtain estimates from as many clades of Oncidiinae as possible. It is clear that some clades are poorly sampled, and this report with 54 estimates (Table 1) is preliminary in that for a subtribe of 1700 species more sampling is required (this is ongoing). It should be pointed out the availability of taxa is limited to what is in cultivation; laws regulating exchange of scientific materials for taxa listed in the CITES appendices (Convention on Trade in Endangered Species), which includes all Orchidaceae, require that the root tips needed for these studies must have CITES permits for their movement across national borders. Thus our sampling of these taxa is not as extensive as we would wish.
Table 1.
List of taxa sampled for genome sizes and literature citations for those previously published
| Genome size (pg per 1C nucleus) |
Source |
Voucher |
||||
|---|---|---|---|---|---|---|
| Outgroups | ||||||
| Cymbidiinae | ||||||
| Ansellia africana Lindl. | 1·85 | Jones et al., 1998, flow | ||||
| Cymbidium cerinum Schltr. | 4·05 | Capesius, 1976, re-naturation kinetics | ||||
| Cymbidium pendulum Sw. | 4·65 | Narayan et al., 1989) | ||||
| Cymbidium pumilum Rolfe | 4·35 | Nagl and Capesius, 1977, re-naturation kinetics | ||||
| Cymbidium sinenseWilld. | 3·15 | Jones et al., 1998, flow | ||||
| Grammatophyllum scriptum Blume. | 1·70 | Jones et al., 1998, flow | ||||
| Coeliopsidinae | ||||||
| Peristeria elata Hook. | 4·65 | Jones et al., 1998, flow | ||||
| Oncidiinae (mostly sampled for this study) | ||||||
| Ada ocanensis (Lindl.) N. H. Williams | 3·70 | This paper | Chase 87312 | |||
| Brassia maculata R. Br. | 1·85 | Jones et al., 1998 (flow) | ||||
| Brassia maculata | 3·70 | This paper, DAPI | Chase 85074 | |||
| Brassia verrucosa Lindl. | 3·93 | This paper | Chase 83162 | |||
| Cochlioda noezliana Rolfe | 3·48 | This paper | Chase 8169 | |||
| Cyrtochiloides cardiochila (Lindl.) N. H. Williams and M. W. Chase | 3·10 | This paper | Chase 6622 | |||
| Cyrtochiloides ochmatochila (Rchb. f.) N. H. Williams and M. W. Chase | 2·23 | This paper | Chase 83003 | |||
| Cyrtochilum aff. cimiciferum (Rchb. f.) Dalström | 3·43 | This paper | Chase 84502 | |||
| Cyrtochilum loxense Kränzl. | 2·80 | This paper | No voucher | |||
| Cyrtochilum ovatilabium (Schweinf.) Dalström | 1·93 | This paper | Chase O-654 | |||
| Cyrtochilum serratum (Lindl.) Kränzl. | 2·70 | This paper, DAPI | Chase O-32 | |||
| Cyrtochilum tricostatum Kränzl. | 2·03 | This paper | Chase 8165 | |||
| Erycina diaphana Schltr. | 1·93 | This paper | Chase 6598 | |||
| Erycina pusilla (L.) N. H. Williams and M. W. Chase | 1·50 | This paper, DAPI | Chase 85027 | |||
| Leochilus oncidioides Knowles & Westc. | 1·20 | This paper, DAPI | Chase 83417 | |||
| Lockhartia oerstedii Rchb. f. | 1·80 | This paper | Chase 6609 | |||
| Miltonia clowesii Lindl. | 3·80 | This paper | Chase 84514 | |||
| Miltonia phymatochila (Lindl.) N. H. Williams and M. W. Chase | 5·73 | This paper | Chase O-208 | |||
| Miltonia regnellii Rchb. f. | 4·70 | This paper | Chase 86059 | |||
| Notylia barkeri Lindl. | 1·10 | This paper, DAPI | Chase 82070 | |||
| Odontoglossum spectatissimum Lindl. | 4·30 | This paper | Chase 6594 | |||
| Odontoglossum wyattianum G. Wilson | 3·95 | This paper | No voucher | |||
| Oncidium aloisii Schltr. | 3·05 | This paper | Chase 6604 | |||
| Oncidium ampliatum Lindl. | 2·50 | This paper, DAPI | Chase 84104 | |||
| Oncidium ansiferum Rchb. f. | 3·15 | This paper | Chase 8168 | |||
| Oncidium baueri Lindl. | 4·48 | This paper | Chase 87023 | |||
| Oncidium bracteatum Warcz. ex Rchb. f. | 3·28 | This paper | No voucher | |||
| Oncidium crispum Lodd. | 1·93 | This paper | Chase 84504 | |||
| Oncidium endocharis Rchb. f. | 4·60 | This paper | Chase 6606 | |||
| Oncidium excavatum Lindl. | 2·13 | This paper | Chase 7343 | |||
| Oncidium flexuosum Lindl. | 1·10 | This paper, DAPI | Chase 6618 | |||
| Oncidium ensatum Lindl. | 3·30 | This paper | Chase 9671 | |||
| Oncidium leucochilum Bateman | 0·60 | This paper, DAPI | Chase 83374 | |||
| Oncidium marshallianum Rchb. f. | 1·83 | This paper, DAPI | Chase 8163 | |||
| Oncidium ornithorynchum Kunth | 2·88 | This paper | Chase 82214 | |||
| Oncidium robustissimum Rchb. f. | 2·83 | This paper | Chase 8546 | |||
| Oncidium sphacelatum Lindl. | 2·35 | Jones et al., 1998, flow | ||||
| Oncidium stenotis Rchb. f. | 3·03 | This paper | Chase 85071 | |||
| Oncidium trilobum (Schtr.) Garay & Stacy | 3·28 | This paper | Chase 8539 | |||
| Oncidium wentworthianum Bateman ex Lindl. | 2·93 | This paper | Chase 87029 | |||
| Otoglossum globuliferum (Kunth) N. H. Williams and M. W. Chase | 3·20 | This paper | Chase 86097 | |||
| Rhynchostele cervantesii (Llave & Lex.) Soto Arenas & G. A. Salazar | 3·70 | This paper | Chase 83140 | |||
| Rhynchostele cordata (Lindl.) Soto Arenas & G. A. Salazar | 3·90 | This paper | Chase 8166 | |||
| Rossioglossum williamsianum (Rchb.f.) Garay & G. C. Kennedy | 7·70 | This paper | No voucher | |||
| Tolumnia varvelum Moir | 1·95 | Jones et al., 1998, flow | ||||
| Trichocentrum ascendens (Lindl.) M. W. Chase & N. H. Williams | 1·70 | This paper, DAPI | Chase O-1275 | |||
| Trichocentrum capistratum Linden & Rchb. f. | 4·60 | This paper, DAPI | Chase 84106 | |||
| Trichocentrum microchilum (Bateman ex Lindl.) M. W. Chase & N. H. Williams | 4·88 | This paper | Chase 83181 | |||
| Trichocentrum panamense Rolfe | 4·30 | This paper, DAPI | Chase 84077 | |||
| Trichoceros antennifer Kunth | 4·38 | This paper | Chase 6601 | |||
| Trichopilia maculata Rchb. f. | 2·35 | Jones et al., 1998, flow | ||||
| Trichopilia marginata Henfr. | 2·80 | This paper, DAPI | Chase 83187 | |||
| Trichopilia sanguinolenta Rchb. f. | 3·83 | This paper | Chase 84547 | |||
| Zelenkoa onusta (Lindl.) M. W. Chase & N. H. Williams | 3·05 | This paper | Chase 6592 | |||
All estimates, including the new ones for this paper, are also available on http://www.rbgkew.org.uk/cval/homepage.html. Unless otherwise stated, measurements were performed with Feulgen staining. Vouchers for new estimates are in the pickled collection at RBG, Kew (K).
RESULTS
We present 52 genome size estimates (49 of the new estimates and three from the literature) on the summary cladogram; there is one of our new estimates and one previous one that we did not include because we think that they are spurious (see below). We also list published chromosome numbers (diploid counts only) for each group. Chromosome numbers for Oncidiinae range from n = 5–30; the numbers are discontinuous. There are two outliers at n = 5, 7, a couple of species at 14, and the majority from 21–30. The outgroups (tribe Maxillarieae; not shown in Fig. 1) are n = 20, 22 and 24. Clade A, which are sister to the rest of Oncidiinae, has chromosome numbers of n = 16, 28. Clade B is highly variable (n = 12–22), and there appears to be a descending series with the lowest numbers in the most-derived clades. The majority of rest of the clades (C–I) have only n = 28, except for the twig epiphyte clades, F and H, which are n = 21–26 and 5–28, respectively, and clade D with n = 28–30. In clade H, only Erycina and Tolumnia are twig epiphytes; the species of Rhynchostele live on larger branches.
Genome sizes in the close outgroups (seven estimates) range from 1·70–4·65 pg in a 1C nucleus (all estimates given in this paper in pg per 1C nucleus). Within Oncidiinae (52 estimates), genome sizes range from 1·10–7·70 (Table 1). Although in some cases the estimates with DAPI correspond well with those made using Feulgen, the DAPI estimates generally fall near the lower end of range. We are in the process of checking either the same species or closely related ones. We have re-checked Oncidium leucochilum which, at 0·60, has been the smallest orchid genome in the database (http://www.rbgkew.org.uk/cval/homepage.html), which seemed to the first author to be too low. Preliminary experiments revealed that this species has at least 3·00 when measured on a Partec PA II flow cytometer using Pisum sativum ‘Minerva Maple’ as the calibration standard and propidium iodide as the fluorochrome (methods according to Hanson et al., 2003). We also have doubts about the measurements of Trichocentrum ascendens (clade B), which at 1·70 is much smaller than any other species of that genus (4·30–4·88, some measured with each technique). However, the estimate for Oncidium flexuosum, 1·10, is only 30 % less than others in its clade (G; 1·83–1·93); Erycina pusilla (1·50) is only 20 % less than E. diaphana (1·93). Unfortunately, for clade F, we have only DAPI measurements so far. We will not include the measurements of O. leucochilum (0·60) in our results or discussion; this is clearly a mistake. The distribution of sizes in clade A is compatible with a hypothesis of ancestral sizes being in the 2·30–3·90 range (three estimates). In clade B, there are two or perhaps three species' groups in which sizes are higher, up to 7·70 in Rossioglossum (one estimate) and 4·30–4·88 in Trichocentrum (four). Estimates in clade C range from 1·80–4·60 (16); D, 3·70–5·73 (six); E, 1·93–3·43 (eight); F, 1·10–1·20 (two); G, 1·10–3·05 (four); H, 1·50–3·90 (five); and I, 4·38 (one).
Chromosome numbers and genome sizes show no relationship at all; some groups with lower chromosome numbers have smaller genomes, in the 1·10–1·93 range (clades F and H, which both have rapid cycling twig epiphytes), but in Trichocentrum (clade B), plants with lower chromosome numbers have somewhat higher genome sizes, 4·30–4·88. In yet other cases, plants with n = 28 have genome sizes as small as the twig epiphytes (some species in clade G, 1·10–3·05). Within clades, it is not unusual to find ranges in which the smallest genome sizes are 2·5 times smaller than the largest.
DISCUSSION
Genome sizes of Oncidiinae
Genome sizes in these tropical epiphytes would not be expected to be large (>10 pg in 1C nucleus) because they grow more or less continually. The largest plant genomes are in plants that have distinct and short periods of growth followed by long periods of dormancy (e.g. geophytes in the monocot orders Asparagales and Liliales; http://www.rbgkew.org.uk/cval/homepage.html). The species of Oncidiinae examined also do not have the smallest genomes reported for tropical epiphytes; many species of Dendrobium are around 1·0 (Jones et al., 1998; although we are suspicious that these measurements made with flow cytometry may be systematically low; see below). The largest size reported for a tropical epiphytic species thus far is that of Rossioglossum williamsianum (7·70; this paper); the smallest genome in a terrestrial orchid species is that of Microstylis wallichii (2·50; Narayan et al., 1989). Thus the reported range for epiphytes versus terrestrials is 0·75–7·70 and 2·50–38·83, respectively (193 estimates in the C-value database).
This difference is undoubtedly due to the ability of many terrestrial species to be able to either grow slowly or produce the next season's growth during a dormant period, the latter particularly the case for those species in the temperate zones. The difference between these two groups could be reflected in selection for small cell sizes in the epiphytes, which although growing in rain or cloud forest conditions, are nonetheless under considerable constraint imposed by intermittent water availability. Many of these species exhibit other characteristics associated with drought, such as thick cuticles and water-storage organs (e.g. pseudobulbs). Cell size, particularly that of guard cells, is clearly related to management of water resources for these plants, and thus we would expect to see these different patterns exhibited by terrestrial and epiphytic species. Microstylis and its relatives (Malaxidae), although often growing on the ground, have pseudobulbs (probably indicating epiphytic origins) and thus are really semi-terrestrial.
There are few data on genome sizes in other families in which both terrestrial and epiphytic species are frequent. For the family with the second greatest percentage of epiphytic species, Bromeliaceae, there are only two C-value estimates, both for Ananas (pineapple), of 0·45 and 0·55. Ananas is a terrestrial genus, but it grows continuously, whereas most terrestrial orchids have distinct active and dormant phases. The difference in Orchidaceae between terrestrial and epiphytic species is somewhat different than we find in other families with both life histories because in orchids terrestrial species are largely not tropical and do have distinct phases of dormancy. Species of Cymbidium and Peristeria (members of the outgroup to Oncidiinae) are mostly terrestrial, and all are tropical; they have smaller genome sizes than most other terrestrial species, and they do grow more or less continually. Thus the marked differences among terrestrial and epiphytic species have more to do with the fact that most terrestrial orchids are geophytes, and geophytes have the largest plant genomes (e.g. in Fritillaria assyriaca; http://www.rbgkew.org.uk/cval/homepage.html).
Reliability of different methods for estimating genome sizes
DAPI methods were used for a number of Oncidiinae estimates, and these are generally similar to those found with Feulgen staining, but the range with DAPI falls on the lower end of the overall range in Oncidiinae. The DAPI C-value of 0·60 for Oncidium leucochilum was suspiciously low, and when checked with Feulgen methods this species was found to be much closer to the other estimates for its clade (C, Fig. 1). The estimate for Brassia maculata, 1·85, with flow cytometry (Jones et al., 1998) is also suspicious; with DAPI this species was estimated to be 3·70, which is similar to that with Feulgen for another species of Brassia, B. verrucosa, with 3·93, and the related genus, Ada, A. ocanensis with 3·70. We will discount the DAPI estimate for Oncidium leucochilum and the flow cytometry estimate for B. maculata. Other DAPI estimates might also be suspect, but they are not highly dissimilar from Feulgen estimates for closely related species: Trichopilia maginata, 2·80 with DAPI, and T. sanguinolenta, 3·83 with Feulgen; Erycina pusilla, 1·50 with DAPI, and E. diaphana, 1·93 with Feulgen; Oncidium flexuosum, 1·10 with DAPI, and O. crispum, 1·93 with Feulgen. As mentioned in the Materials and Methods, other DAPI estimates are similar in closely related species estimated with Feulgen. As a general comment, the estimates with flow cytometry (Jones et al., 1998) are all at the low end of estimates for epiphytic species, and these need to be checked with other methods to determine their reliability. The estimates by Jones et al. (1998) for species of Dendrobium, for example, are all much lower than those for a different set of Dendrobium species performed with Feulgen staining (Narayan et al., 1989). There are debates about which method is the most accurate, and each of them requires some expertise to be carried out accurately, as well as for appropriate guidelines to be followed (e.g. see Doležel and Bartos, 2005; Greilhuber, 2005; Noirot et al., 2005).
Mapping genome size on phylogentic trees: problems and prospects
There are several software programs that can be used to optimize characters of any sort on phylogenetics trees (e.g. MacClade; Maddison and Maddison, 1992), and these procedures can be applied mechanically to estimate how a character such as genome size of a group has changed. Character optimization on a cladogram is best suited to discrete (non-quantitative) data. When the character under study can be more or less continuously varying (as in this case), then optimization is inappropriate. Beyond this problem, there are several other considerations to which attention should be paid or else the results will be meaningless. The first is the question of sampling for both the phylogenetic study and the character under study. If the group is large and the character variable, then sampling for both becomes an important issue. If variability is unknown or high, then a nearly complete set of species should be included or else the optimization becomes trivial. Leitch et al. (1998) looked at general patterns of genome sizes in angiosperms and concluded that genomes in these plants were ancestrally small because none of the clades attached to the basal-most nodes had large genomes. In several clades, larger genome sizes occurred, so it was clear that increases had occurred within these. Leitch et al. (1998) did not optimize genome sizes on the tree, but rather looked at whole clades and the ranges they exhibited, and this allowed them to reach some conclusions. The phylogenetic tree used in the Leitch et al. (1998) paper was not based solely on the taxa for which genome size estimates were available, and those authors did not make specific comments about at which nodes changes in size occurred. Variation was known to be large within the angiosperms, and many taxa were unsampled (even though the sample size itself was extensive). We advocate here a similar approach for Oncidiinae.
We could, conversely, have created a phylogenetic tree for just the taxa of Oncidiinae sampled thus far for genome size and used one of the software programs to optimize sizes onto the tree and hypothesized changes in genome size on this basis. This approach is highly flawed and almost certainly would be as likely to mislead as inform. The effects of taxon sampling on accuracy of phylogenetic results have been demonstrated in simulations (Hillis, 1997; Purvis and Quicke, 1997; Poe, 1998a, b), and in empirical studies similar patterns have been detected (Chase et al., 1993). If specific hypotheses of increases and decreases in genome size are to be documented at each node of the phylogenetic tree, then taxon sampling must be nearly complete for both the tree and genome sizes. Under-sampling of taxa will lead either to spurious patterns of phylogenetic relationships or to spurious estimates of genome sizes, or both. This approach is not appropriate for a large group such as Oncidiinae in which we are unlikely ever to be able to sample taxa for DNA sequences and genome sizes in such great detail.
Both issues of sampling (to produce the phylogenetic tree and for genome sizes) are critical, which would seem to jeopardize efforts unless sampling of both is exhaustive. The Leitch et al. (1998) effort and the approach applied here do not attempt to be so explicit and look for more general patterns that do not depend heavily on sampling. The relevant question is, then, how do you know when you have sampled enough within a clade that you can characterize its typical (modal) genome size. This is not a question that can easily be answered, but some general guidelines can be offered. First of all, species representing the morphological variation within the clade should be adequately sampled so that the cladogram is representative of taxonomic diversity. In this case, we have sampled roughly 600 species of the 1700 (35 %) in Oncidiinae; the summary tree illustrated in Fig. 1 is based on those larger analyses. We obviously cannot be certain that we have sampled all critical taxa, so we must attach some caveats to our conclusions. However, several of the authors have worked on the evolution and taxonomy of Oncidiinae for up to 40 years, and our sampling of taxa has been guided by that experience. Thus, we are confident that major new clades will not be found.
Genome size estimates should be sampled evenly across the groups within the major clades, focusing neither exclusively on what some people term the ‘basal’ clades (i.e. those sister to larger clades) nor the more terminal ones. The position of a genus such as Zelenkoa (monospecific) in clade G means that it should be sampled, but the fact that it has a genome size atypically large (3·05) for clade G and its sister clade, F, means that most likely it has independently experienced an increase, rather than hypothesizing that clade G started out with a large genome size. The range and mean of genome sizes should be little affected by adding additional samples; if either is greatly affected by new additions, then clearly not enough is known about that clade to be confident about the general patterns of size variation within it.
Evenness of taxonomic sampling of genome size in Oncidiinae
There are obvious gaps in our current level of sampling that will compromise our ability to reach robust conclusions about genome size change in Oncidiinae. If we had simply created a tree for just the taxa for which genome size estimates were available, we would not be able to assess the gaps in our sampling. Clades B, F and I are clearly too sparsely sampled, and we are actively seeking material so that we have a better idea of sizes. However, in the case of clade F, we find that its sister clade G, which is much better sampled, has similar sizes to the two estimates we have thus far for clade F. Conversely, clade I is sister to a clade that has a great deal of variability, which therefore limits our ability to formulate hypotheses that include it.
The fact that we have only seven outgroup taxa sampled also limits this assessment as well. We have data for two of the six subtribes of tribe Cymbidieae, and these form a consistent pattern of mostly 1·70–4·65, which is generally similar to what we find in many Oncidiinae (the two lowest estimates are again from Jones et al., 1998, using flow cytometry). Clades A and B are sampled too sparsely, and clade B has too much variation for much to be concluded about what is happening there, so our ability to make comments on what is the ancestral genome size in Oncidiinae is somewhat limited. Nevertheless, some estimates within clade A and B are similar to those for the outgroups as well as many of the ingroup clades, whereas others are both higher and lower, leading to the conclusion that some taxa within clade B have experienced increases (e.g. T. microchilum with Feulgen, T. capistratum and T. panamense with DAPI and Rossioglossum williamsianum with Feulgen). Clade B should be a focus of future work because they exhibit a descending chromosome series (n = 22–14) and have modified vegetative features and life history traits (loss of pseudobulbs in many taxa with storage functions transferred to fleshy or terete leaves and occupation of shadier sites in at least some taxa).
The great bulk of Oncidiinae that have standard habits (pseudobulbs and folded leaves) occur in clades C–E. Clade A exhibits a range of 2·35–3·83 (three estimates), which is similar to that observed in the outgroups, and clade C (16 estimates) is similar as well, 1·80–4·60. Clade D (six estimates) appears to be experiencing some increases in genome size, 3·70–5·73. Clade E (six estimates) also exhibits a range similar to most of the others, 1·93–3·20.
Clade G (four estimates) has at least some species with much smaller genome sizes, 1·10–1·95, which are similar to those observed in clade F (two estimates), 1·10–1·20 (even if we exclude the three DAPI estimates, we still get 1·83–1·95). Clade F includes the rapid cyclers with paedomorphic habits (the bulk of Oncidiinae twig epiphytes), whereas clade G are typical members of Oncidiinae with longer development times and standard habits (pseudobulbs and folded leaves). Zelenkoa onusta, as mentioned above, has a larger genome size (3·05) than the rest of these two clades, which we think is likely to turn out to be a case of size increase. Although the members of clade F have smaller genome sizes, which might be expected given their rapid life history, vegetative reduction and preference for extremely harsh sites, their sister clade, G, has similar genome sizes as well, and this clade exhibits none of the specializations of clade F (except perhaps for Rodrigueziella and Rodrigueziopsis, but we have no data thus far for their habitat/site preferences). It would appear here as well as elsewhere in the angiosperms that changes in genome size occur before alterations of life history traits. We must, of course, acknowledge the paucity of data we have for clade F, which limits the robustness of these conclusions, but we intend to sample more of these taxa. Unfortunately, they are rare in collections.
Clade H includes only three genera, two that have at least some species that are rapid cyclers, Erycina and Tolumnia, with smaller genome sizes, 1·50–1·93 (three estimates, some with Feulgen and DAPI) and a more standard genus, Rhynchostele, with more typical Oncidiinae genome sizes, 3·70, 3·90 (two estimates, both with Feulgen). Chromosome numbers are lower in both of the twig epiphyte genera, n = 20, 21 in Tolumnia and n = 5, 7 in Erycina, whereas in Rhynchostele we find n = 28, the most common number in Oncidiinae. On a coarse level, it appears that in clade H the smaller genome sizes are associated only with rapid cyclers, but the situation is probably more complex than this. Within Erycina and Tolumnia, there are small species that inhabit less extreme sites and for which we lack detailed life history data, so it may be that the same principle as with clades F and G applies here: smaller genome sizes were under selection first for other reasons, which then facilitated further alteration of life histories. It could also be that like Zelenkoa, Rhynchostele species have experienced an increase in genome sizes and that the ancestral genome size for clades F and G was small relative to the rest of the Oncidiinae taxa. Collecting more estimates of genome size should help us to more precisely identify the patterns in these clades.
As mentioned above, the other clade containing some twig epiphytes, I, is much too poorly sampled for genome sizes to venture any conclusions. The one estimate that we do have, 4·38 (with Feulgen staining), is similar in size to most outgroup and ingroup taxa. These taxa also exhibit a range of habits and site preferences that make them atypical relative to the other twig epiphytes (clades F and H); they lack the seed structure typical of other twig epiphytes (Chase, 1986b, 1988; Chase and Pippen, 1988), and some, e.g. Pachyphyllum, even grow terrestrially. Little is known about chromosome number in clade I; the only genus for which there is a count is n = 28 in Trichoceros. Clearly a great deal more work needs to be focused on the genera in this group, which prior to molecular studies (Williams et al., 2001a) were not considered either to be related to each other or to Oncidiinae. For example, Dressler (1993) treated these as subtribes, Pachyphyllinae and Ornithocephalinae.
CONCLUSIONS
Oncidiinae are unusual among Orchidaceae for their diversity of life histories, habits and chromosome numbers, which makes them an ideal group for evolutionary studies of many types. Genome size variation would be expected as well within a group exhibiting such diversity in other traits, particularly given that some members of the subtribe are rapid cyclers. Although their range in genome sizes is not large relative to that known among other Orchidaceae, particularly in terrestrial orchids such as Cypripedium (e.g. C. molle with 4·14 up to C. henryi with 38·8), they occupy the lower end of known genome sizes in Orchidaceae and exhibit a seven-fold range: Notylia, 1·10, versus Rossioglossum, 7·70 (Fig. 1, Table 1). Epiphytic orchids have uniformly smaller genome sizes than terrestrial orchid species, which may be the result of selection on cell size due to water stress. Within Oncidiinae, genome size was likely to have been in the 3–5 range ancestrally, and within most clades at least some species appear to have reduced genome size. Three clades have most of the smaller genome sizes, 1·10–2·00, and within these clades, rapid cyclers have evolved at least twice, accompanied by changes in habit, chromosome number (reduction) and habitat preferences. More sampling is required to obtain a clearer picture of these phenomena, in particular to examine cell sizes of these taxa to determine if cell size and genome size are correlated in diploid taxa.
LITERATURE CITED
- Bennett MD. 1972. Nuclear DNA content and minimum generation time in plants. Proceedings of the Royal Society of London, Series B 178: 259–275. [DOI] [PubMed] [Google Scholar]
- Bennett MD, Leitch IJ. 1995. Nuclear DNA amounts in angiosperms. Annals of Botany 76: 113–176. [Google Scholar]
- Cavalier-Smith, T. 1978. Nuclear volume control by nucleoskeletal DNA, selection for cell volume and cell growth rate, and the solution of the DNA C-value paradox. Journal of Cell Science 34: 247–278. [DOI] [PubMed] [Google Scholar]
- Cavalier-Smith T. 1985. Cell volume and the evolution of genome size. In: Cavalier-Smith T, ed. The evolution of genome size. Chichester, UK: Wiley. [Google Scholar]
- Cavalier-Smith T. 2005. Economy, speed and size matter: evolutionary forces driving nuclear genome miniaturization and expansion. Annals of Botany 95: 147–175. [DOI] [PMC free article] [PubMed] [Google Scholar]
- Chase MW. 1986. A reappraisal of the oncidioid orchids. Systematic Botany 11: 477–491. [Google Scholar]
- Chase MW. 1986. A revision of Leochilus (Orchidaceae). Systematic Botany Monographs 14: 1–97. [Google Scholar]
- Chase MW. 1987. Systematic implications of pollinarium morphology morphology in Oncidium Sw., Odontoglossum Kunth, and allied genera (Orchidaceae). Lindleyana 2: 8–28. [Google Scholar]
- Chase MW. 1988. Obligate twig epiphytes: a distinct subset of Neotropical orchidaceous epiphytes. Selbyana 10: 24–30. [Google Scholar]
- Chase MW, Olmstead RG. 1988. Isozyme number in subtribe Oncidiinae (Orchidaceae): an evaluation of polyploidy. American Journal of Botany 75: 1080–1085. [Google Scholar]
- Chase MW, Palmer JD. 1989. Chloroplast DNA systematics of lilioid of the lilioid monocots: feasibility, resources, and an example from the Orchidaceae. American Journal of Botany 76: 1720–1730. [Google Scholar]
- Chase MW, Palmer JD. 1992. Floral morphology and chromosome number in subtribe Oncidiinae (Orchidaceae): evolutionary insights from a phylogenetic analysis of chloroplast DNA restriction site variation. In: Soltis DE, Soltis PS, Doyle JJ, eds. Molecular systematics of plants. New York: Chapman and Hall, 324–339. [Google Scholar]
- Chase MW, Palmer JD. 1997. Leapfrog radiation in floral and vegetative traits among twig epiphytes in the orchid subtribe Oncidiinae. In: Givnish TJ, Sytsma KJ, eds. Molecular evolution and adaptive radiation. Cambridge: Cambridge University Press, 331–352. [Google Scholar]
- Chase MW, Pippen JS. 1988. Seed morphology in the subtribe Oncidiinae (Orchidaceae). Systematic Botany 13: 313–323. [Google Scholar]
- Chase MW, Soltis DE, Olmstead RG, Morgan D, Les DH, Mishler BD, Duvall MR, Price RA, Hills HG, Qiu YL, et al. 1993. Phylogenetics of seed plants: an analysis of nucleotide sequences from the plastid gene rbcL Annals of the Missouri Botanical Garden 80: 528–580. [Google Scholar]
- Doležel J, Bartos J. 2005. Plant DNA flow cytometry and estimation of nuclear genome size. Annals of Botany 95: 99–110. [DOI] [PMC free article] [PubMed] [Google Scholar]
- Dressler RL. 1993.Phylogeny and classification of the orchid family. Cambridge: Cambridge University Press. [Google Scholar]
- Garay LA. 1970. A reappraisal of the genus Oncidium Sw. Taxon 19: 443–467. [Google Scholar]
- Geber G, Hasibeder G. 1980. Cytophotometric estimation of DNA contents—comparison of a new DAPI fluorescence method with Feulgen absorbance photometry. Microscopica Acta Supplement 4: 31–35. [Google Scholar]
- Greilhuber J. 2005. Intraspecific variation in genome size in angiosperms: identifying its existence. Annals of Botany 95: 91–98. [DOI] [PMC free article] [PubMed] [Google Scholar]
- Hanson L, Brown RL, Boyd A, Johnson MAT, Bennett MD. 2003. First nuclear DNA C-values for 28 angiosperm genera. Annals of Botany 91: 31–38. [DOI] [PMC free article] [PubMed] [Google Scholar]
- Hanson L, McMahon KA, Johnson MAT, Bennett MD. 2001. First nuclear DNA C-values for 25 angiosperm families. Annals of Botany 87: 251–258. [DOI] [PubMed] [Google Scholar]
- Hillis DM. 1997. Are big trees indeed easy—reply. Trends in Ecology and Evolution 12: 358. [DOI] [PubMed] [Google Scholar]
- Jones WE, Kuehnle AR, Arumuganathan K. 1998. Nuclear DNA content of 26 orchid (Orchidaceae) genera with emphasis on Dendrobium Annals of Botany 82: 189–194. [Google Scholar]
- Leitch IJ, Chase MW, Bennett MD. 1998. Phylogenetic analysis of DNA C-values provides evidence for a small ancestral genome size in flowering plants. Annals of Botany 82: 85–94. [Google Scholar]
- Maddison WP, Maddison DR. 1992.MacClade. Analysis of phylogeny and character evolution. Sunderland, MA: Sinauer Associates. [DOI] [PubMed] [Google Scholar]
- Nagl W, Capesius I. 1977. Repetitive DNA and heterochomatin as factors of karyotype evolution on phylogeny and ontogeny of orchids. Chromosomes Today 6: 141–152. [Google Scholar]
- Narayan RKJ, Parida A, Vij SP. 1989. DNA variation in Orchidaceae. Nucleus 32: 71–75. [Google Scholar]
- Noirot M, Barre P, Duperray C, Hamon S, De Kochko A. 2005. Investigation on the origins of stoichiometric error in genome size estimation using heat experiments. Consequences on data interpretation. Annals of Botany 95: 111–118. [DOI] [PMC free article] [PubMed] [Google Scholar]
- Poe S. 1998. The effect of taxonomic sampling on accuracy of phylogeny estimation: Test case of a known phylogeny. Molecular Biology and Evolution 15: 1086–1090. [Google Scholar]
- Poe S. 1998. Sensitivity of phylogeny estimation to taxonomic sampling. Systematic Biology 47: 18–31. [DOI] [PubMed] [Google Scholar]
- Purvis A, Quicke DLJ. 1997. Building phylogenies—are the big easy? Trends in Ecology and Evolution 12: 49–50. [DOI] [PubMed] [Google Scholar]
- Stebbins GL. 1950.Variation and evolution in plants. New York: Colombia University Press. [Google Scholar]
- Tanaka R., Kamemoto H. 1984. Chromosomes in orchids: counting and numbers. In: Arditti, J, ed. Orchid biology—reviews and perspectives, III. Ithaca: Cornell University Press, 323–410. [Google Scholar]
- van der Pijl L, Dodson CH. 1966.Orchid flowers: their pollination and evolution. Coral Gables: University of Miami Press. [Google Scholar]
- Whitten WM, Williams NH, Chase MW. 2000. Subtribal and generic relationships of Maxillarieae (Orchidaceae) with emphasis on Stanhopeinae: combined molecular evidence. American Journal of Botany 87: 1842–1856. [PubMed] [Google Scholar]
- Williams NH, Chase MW, Fulcher T, Whitten WM. 2001. Molecular systematics of the Oncidiinae based on evidence from four DNA regions: expanded circumscriptions of Cyrtochilum, Erycina, Otoglossum and Trichocentrum and a new genus (Orchidaceae). Lindleyana 16: 113–139. [Google Scholar]
- Williams NH, Chase MW, Whitten WM. 2001. Phylogenetic positions of Miltoniopsis, Caucaea, a new genus Cyrtochloides, and Oncidum phymatochilum (Orchidaceae: Oncidiinae) based on nuclear and plastid DNA data. Lindleyana 16: 272–285. [Google Scholar]