

Abstract
• Background and Aims The roles of variation in DNA content in plant evolution and adaptation remain a major biological enigma. Chromosome number and 2C DNA content were determined for 21 of the 25 species of the genus Sorghum and analysed from a phylogenetic perspective.
• Methods DNA content was determined by flow cytometry. A Sorghum phylogeny was constructed based on combined nuclear ITS and chloroplast ndhF DNA sequences.
• Key Results Chromosome counts (2n = 10, 20, 30, 40) were, with few exceptions, concordant with published numbers. New chromosome numbers were obtained for S. amplum (2n = 30) and S. leiocladum (2n = 10). 2C DNA content varies 8·1-fold (1·27–10·30 pg) among the 21 Sorghum species. 2C DNA content varies 3·6-fold from 1·27 pg to 4·60 pg among the 2n = 10 species and 5·8-fold (1·52–8·79 pg) among the 2n = 20 species. The x = 5 genome size varies over an 8·8-fold range from 0·26 pg to 2·30 pg. The mean 2C DNA content of perennial species (6·20 pg) is significantly greater than the mean (2·92 pg) of the annuals. Among the 21 species studied, the mean x = 5 genome size of annuals (1·15 pg) and of perennials (1·29 pg) is not significantly different. Statistical analysis of Australian species showed: (a) mean 2C DNA content of annual (2·89 pg) and perennial (7·73 pg) species is significantly different; (b) mean x = 5 genome size of perennials (1·66 pg) is significantly greater than that of the annuals (1·09 pg); (c) the mean maximum latitude at which perennial species grow (−25·4 degrees) is significantly greater than the mean maximum latitude (−17·6) at which annual species grow.
• Conclusions The DNA sequence phylogeny splits Sorghum into two lineages, one comprising the 2n = 10 species with large genomes and their polyploid relatives, and the other with the 2n = 20, 40 species with relatively small genomes. An apparent phylogenetic reduction in genome size has occurred in the 2n = 10 lineage. Genome size evolution in the genus Sorghum apparently did not involve a ‘one way ticket to genomic obesity’ as has been proposed for the grasses.
Keywords: Sorghum bicolor, wild sorghum, genome size, DNA content, chromosome numbers, systematics
INTRODUCTION
Sorghum bicolor (L.) Moench, sorghum, is one of the world's major grain crops. It is extensively cultivated in marginal rainfall areas of the tropics and subtropics, and selected varieties are widely grown in temperate climates. The wild species of sorghum represent a potential diverse source of germplasm for sorghum breeding programmes. The genus Sorghum has 25 recognized species that have been taxonomically classified into five subgenera or sections: Eusorghum, Chaetosorghum, Heterosorghum, Parasorghum and Stiposorghum (Garber, 1950). Species of the genus have chromosome numbers of 2n = 10, 20, 30 or 40 (Garber, 1950; Lazarides et al., 1991).
Section Eusorghum includes cultivated sorghum S. bicolor and its subspecies drummondii and arundinaceum, and the wild species S. almum Parodi, S. propinquum (Kunth) Hitch. and S. halepense (L.) Pers. (deWet, 1978). Species of section Eusorghum have a natural range through Africa and southern Asia (deWet, 1978; Duvall and Doebley, 1990). Sorghum bicolor and S. propinquum are 2n = 20 species that are chromosomally similar. Hybrids of S. bicolor and S. propinquum are meiotically regular with ten bivalents observed at meiotic metaphase I (Doggett, 1988). Sorghum halepense (2n = 40) is polyploid. Meiotic analysis of S. bicolor × S. halepense hybrids revealed S. halepense to possess one genome very similar to S. bicolor, and another more divergent or rearranged genome, thus suggesting that S. halepense is a disomic polyploid (allopolyploid) or perhaps a ‘segmental allopolyploid’ (Duara and Stebbins, 1952; Endrizzi, 1957; Tang and Liang, 1988).
Section Parasorghum comprises seven Asian, Australian and central American species. Sections Chaetosorghum and Heterosorghum are monotypic and native to the Australo-Pacific region. The ten species of section Stiposorghum are found in northern Australia (Lazarides et al., 1991).
Phylogenies based on sequence analysis suggest that the Sorghum section designations may not correspond to evolutionary relationships (Spangler et al., 1999; Dillon et al., 2001). Recent sequence and systematic data have led Spangler (2003) to split Sorghum into three genera, Sorghum, Sarga and Vacoparis. However, the limitations of the available sequence-based phylogenies suggest that this reclassification is premature.
As part of a larger analysis of Sorghum systematics, phylogeny, genomics and germplasm, the DNA content has been determined and chromosome numbers obtained of 21 Sorghum species. The data acquired are discussed in an evolutionary and phylogenetic context.
METHODS
Plant material
The name, herbarium voucher number, accession number, life form and origin of the Sorghum species analysed for DNA content and chromosome number are listed in Table 1. All plants were grown from seeds in a glasshouse, except for S. halepense that was sampled directly from the field. The geographic and latitudinal distributions of native Australian Sorghum species were taken from Lazarides et al. (1991) and herbarium records of the Australian Tropical Crops and Forages Collection, Queensland.
Table 1.
Accession number, life form and origin of 21 Sorghum species analysed for DNA content and chromosome number
| Species |
Herbarium voucher |
Accession no.1 |
Life form |
Collection date and site, or source of seeds |
|---|---|---|---|---|
| Sorghum amplum Lazarides | CANB 4802602 | 3024552 | Annual | 17 Mar. 1994, 1·4 km E of Lake ArgleT/O on Great Northern Hwy, WA, Australia |
| S. angustum S. T. Blake | BRI AQ5859813 | 3026053 | Annual | 19 May 1995, Windmill Ck crossing, 18·8 km S of Musgrave, Station on Peninsula. Development Road, QLD, Australia |
| S. bicolor TX623 L. (Moench) | Annual | Seeds obtained from W. Rooney, Texas A&M University | ||
| S. bicolor Pioneer 8695 L. (Moench) | Annual | Seeds obtained from L. Rayburn, University of Illinois | ||
| S. brachypodum Lazarides | CANB 480293 | 302481 | Annual | 19 Mar. 1994, Jabiru Ring Road East, Jabiru, NT, Australia |
| S. bulbosum Lazarides | DNA D1294834 | 302645 | Annual | 25 Apr. 1996, 29·1 km S Wyndham T/O on HallsCreek Rd (Great Northern Hwy) NT, Australia |
| S. ecarinatum Lazarides | DNA D129486 | 302661 | Annual | 1 May 1996, 10·1 km NW of Windjana T/O on Gibb River Rd, Napier Range, Napier Creek, NT, Australia |
| S. exstans Lazarides | BRI AQ586005 | 302577 | Annual | 2 Apr. 1995, 37 km N Pickataramoor on Melville Island, Australia |
| S. halepense (L.) Pers. | Perennial | 14 June 2001, Hwy 60, 0·5 miles W of Brazos River, TAES Field Laboratory, Burleson County, TX, USA | ||
| S. interjectum Lazarides | JC 20875 | 302445 | Perennial | 54·1 km W of Halls Ck on Great Northern Hwy, WA, Australia |
| S. intrans F. Muell. Ex Benth. | JC 2023 | 302389 | Annual | 11 Mar. 1994, Hotel at Haynes Creek on Stuart Hwy, NT, Australia |
| S. laxiflorum Bailey | BRI AQ773635 | 302510 | Annual | 15 Apr. 1994, 67·9 km N of Wollogorang on Wollogorang Station Rd to coast, NT, Australia |
| S. leiocladum (Hack.) C E. Hubb | DNA D0155521 | 300170 | Perennial | 16 Dec. 1997, 2–3 km W from Drake on roadside on range in State Forest, NSW, Australia |
| S. macrospermum Garber | DNA C867 | 302367 | Annual | 4 Apr. 1995, 7·9 km N Katherine River bridge on Stuart Hwy, NT, Australia |
| S. matarankense Garber & Snyder | DNA D129480 | 302637 | Annual | 22 Apr. 1996, 13·8 km W Carpenteria Hwy T/O on Stuart Hwy, NT, Australia |
| S. nitidum (Vahl.) Pers. | CANB 479893 | 302539 | Perennial | 21 Apr. 1994, Paddock T330 CSIRO Lansdown Res. Stn on Flinders Hwy, QLD, Australia |
| JC 2218 | 302540 | Perennial | 21 Apr. 1994, 22·7 km SE of Woodstock on Giru Woodstock Rd, QLD, Australia | |
| BRI AQ740677 | 302542 | Perennial | 21 Apr. 1994, 10·5 km E of Ayr on Alva Beach Rd, QLD, Australia | |
| CANB 479881 | 302543 | Perennial | 22 Apr. 1994, 0·5 km S of Mt Stuart lookout on Mt Stuart Rd, Townsville, QLD, Australia | |
| ATCGRC 00076 | 302558 | Perennial | 18 May 1994, 6·9 km N of Byfield on Byfield Rd, QLD, Australia | |
| BRI AQ773677 | 302559 | Perennial | 23 May 1994, 1·6 km N of Bakers Rd, 14 km N of Yeppoon T/O on Bruce Hwy, QLD, Australia | |
| BRI AQ496360 | 316930 | Perennial | 6 Jun. 2000, 450 m down road from summit of Mt Stuart on both sides of road, QLD, Australia | |
| S. plumosum (R. Br.) P. Beauv. | BRI AQ773634 | 302489 | Perennial | 11 Apr. 1994, Einslie River, 26·4 km W of Georgetown on Gulf Development Rd, QLD, Australia |
| DNA D129468 | 302635 | Perennial | 21·5 km N 3-Ways T/O on Stuart Hwy, NT, Australia | |
| S. propinquum (Kunth) Hitch. | Perennial | Africa, seeds from W. Rooney, Texas A&M University | ||
| S. purpureosericeum (A. Rich). Aschers & Schweinf | IS 189457 | 318068 | Annual | Sudan, NE tropical Africa |
| S. stipoideum (Ewart & Jean White) C. Gardner and C. E. Hubb | DNA D129465 | 302614 | Annual | 2 May 1996 102 km N of Barnett River Roadhouse on Gibb River Rd, NT, Australia |
| S. timorense (Kunth) Buse | DNA D129474 | 302660 | Annual | 1 May 1996, 5·7 km NW of Windjana T/O on Gibb River Rd, NT, Australia |
| S. versicolor (2x) Anderss. | Annual | East Africa, seeds obtained from G. Liang, Kansas State University | ||
| S. versicolor (4x) Anderss. | Annual | Colchicine-induced autotetraploid by G. Liang, Kansas State University |
AusTRC number, Australian Tropical Crops and Forages Collection, Queensland Department of Primary Industries
CANB, Australian National Herbarium, Canberra, ACT Australia
BRI, Queensland Herbarium, Mt Coot-tha, QLD, Australia
Northern Territory Herbarium, Darwin, NT, Australia
JC, Jeff Corfield Collection, Townsville, QLD, Australia
ATCGRC, Australian Tropical Crops Genetic Resource Centre Collection
IS, ICRISAT.
Chromosomes
Chromosome counts were made with slight modification by the protocol of Jewell and Islam-Faridi (1994). Root-tips (approx. 4 mm long) were removed from plants and treated with an aqueous 0·4 % 8-hydroxyquinoline solution for 5 h at room temperature, fixed in 95 % ethanol–glacial acetic acid (4 : 1 v/v), rinsed several times with distilled water, hydrolysed for 5 min in 0·1 n HCl, rinsed 5 min with distilled water, and washed in citrate buffer (pH 4·5) for 5 min. To digest the cell wall, root-tips were treated for 15–50 min at 37 °C with pH 4·5 aqueous 5 % cellulase (Onozuka R-10; Yakult Honsha Co. Ltd, Tokyo) and 1·0 % pectolyase Y-23 (Seishin Corporation, Tokyo), and rinsed three times with distilled water. Rinsed meristems were placed on a clean glass slide with a drop of ethanol–acetic acid (3 : 1), teased apart with a fine-tipped pair of tweezers, and allowed to air dry at room temperature for 2 d. The chromosomes were stained with Azure Blue. Chromosomes from two or more plants of each accession were counted.
Determination of DNA content
At least three plants for each species were analysed to obtain the mean DNA content. Newly expanded leaves of the target species and of a standard species were manually diced together in buffer (Galbraith et al., 1983), pH 7·2, to release nuclei as described by Johnston et al. (1999). The diced leaves were filtered through a 53-µm nylon mesh, and propidium iodide was added to a final concentration of 50 p.p.m. The mean fluorescence of nuclei was quantified using a Coulter Epics Elite flow cytometer (Coulter Electronics, Hialeah, FL) equipped with a water-cooled laser tuned at 514 nm and 500 mW. Fluorescence at >615 nm was detected with a photomultiplier screened by a long pass filter. Mean 2C DNA content of each target species was calculated by comparing its mean nuclear fluorescence with the mean fluorescence of the nuclei of an internal standard. Due to the range and distribution of Sorghum DNA contents, one of three different internal standards was used to avoid overlap of the standard and target species. One standard, Arabidopsis thaliana ecotype Columbia has a genome size of 157 Mb or 1C = 0·16 pg (Bennett et al., 2003). The DNA content of the other standards, S. bicolor Tx623 (2C DNA content = 1·67 pg) and Lupinus texensis (2C DNA content = 2·44 pg), was determined from 15 replicates of diced mixtures of leaves from S. bicolor, L. texensis and A. thaliana Columbia, where A. thaliana (2C = 0·32 pg, 1C = 157 Mbp; Bennett et al., 2003) was the calibration standard.
Sequence phylogeny
A phylogenetic tree based on combined ITS/ndhF DNA sequences was constructed to evaluate the evolution of chromosome number and DNA content. The DNA sequences used were from Dillon et al. (2001) and S. L. Dillon (pers. com.) with all sequences available from Genbank. Genbank accession numbers for ITS1 are: AF302909–AF302913; AF302915–AF302918; AF302920–AF302921; AF302924–AF302927; AY048867; AY048871; AY282488; AY282490; UO4793; UO4795; U46612. Genbank accession numbers for ndhF are: AF117423–AF117424; AF117426; AF117430–AF117432; AY048873–AY048874; AY282470–AY282475; AY282477–AY282481; AY282484; U21981; U21985.
Forward and reverse sequences were assembled and edited using Sequencher 3·0 (Gene Codes Corp.). The lengths of the aligned ndhF and ITS1 sequences were 2014 and 252 nucleotides, respectively. Sequences were aligned utilizing CLUSTAL X (improved version of CLUSTAL V; Higgins et al., 1992) using a gap opening of 10, a gap extension of 0·5 and a transition weight of 0·5. Zea mays sequences were included as an outgroup species. Phylogenetic analyses were carried out on the ndhF/ITS1 dataset using PAUP* 4·0b2 (Swofford, 1999). Prior to combining the ITS1 and ndhF data sets, a congruence test (partition-homogeneity test in PAUP) was used to determine if there was significant conflict between the data sets. This test compared the sum of lengths of the most parsimonious trees to the distribution of the sum of lengths of the most parsimonious trees using random partition of the characters, 100 reps, and tree bisection–reconnection. Since there were no significant amounts of conflict (P < 0·01) between the ITS1 and ndhF data sets, they were combined for analysis. A maximum parsimony branch and bound search was performed with all characters having equal weight and gaps treated as missing. Branches with minimum length of zero were collapsed, and duplicate trees were eliminated from the set of most parsimonious trees. There were 66 phylogenetically informative characters. Bootstrap data were generated using the fast stepwise addition for 10 000 replicates with TBR branch swapping and multitrees option in effect.
RESULTS
Chromosomes
Chromosome numbers of the 21 sorghum species studied are listed in Table 2. Figure 1 shows karyotypes of Sorghum species varying in chromosome number and size. Chromosome numbers, with few exceptions, confirmed published counts (summarized in Lazarides et al., 1991). A new chromosome number (2n = 30) was obtained for S. amplum (taxonomic identity confirmed by M. Lazarides) which was previously reported to be 2n = 10. Sorghum leiocladum was reported to have 2n = 20 chromosomes but a new number of 2n = 10 was counted. The identity of the authors' accession of S. leiocladum was verified by senior taxonomist Ian Cowie at the Darwin Herbarium. Seven accessions of S. nitidum were counted, and all had 2n = 20 chromosomes. Both 2n = 10 and 2n = 20 types of S. nitidum have been reported, but Garber (1950) questioned the reliability of the 2n = 10 count. Multiple ploidy levels have been reported for S. plumosum (2n = 10, 20, 30) and S. timorense (2n = 10, 20). The authors counted 2n = 30 and 40 (new count) for S. plumosum and 2n = 10 for S. timorense.
Table 2.
DNA content and chromosome number of 21 Sorghum species
| 2C DNA content |
||||||||||
|---|---|---|---|---|---|---|---|---|---|---|
| Species |
pg |
SE |
Mbp/1C1 |
Duncan grouping2 |
x = 5 genomesize (pg)3 |
Reportedchromosome no. 4 (2n) |
Counted chromosome no. (2n) |
Section |
||
| Sorghum amplum5 | 7·69 | 0·032 | 3768 | C | 1·28 | 10 | 30 | Stiposorghum | ||
| S. angustum5 | 3·70 | 0·042 | 1813 | H | 1·85 | 10 | 10 | Stiposorghum | ||
| S. bicolor5 (Tx623) | 1·67 | 0·007 | 818 | M | 0·42 | 20 | 20 | Eusorghum | ||
| S. bicolor5 (Pioneer 8695) | 1·67 | 0·012 | 818 | M | 0·42 | 20 | 20 | Eusorghum | ||
| S. brachypodum5 | 3·36 | 0·129 | 1646 | I | 1·68 | 10 | 10 | Stiposorghum | ||
| S. bulbosum6 | 2·30 | 0·009 | 1127 | K L | 1·15 | 10 | 10 | Stiposorghum | ||
| S. ecarinatum6 | 2·10 | 0·002 | 1029 | L | 1·05 | 10 | 10 | Stiposorghum | ||
| S. exstans5 | 2·75 | 0·006 | 1348 | J | 1·38 | 10 | 10 | Stiposorghum | ||
| S. halepense5 | 3·28 | 0·009 | 1607 | I | 0·41 | 40 | 40 | Eusorghum | ||
| S. halepense7 | 3·27 | 0·020 | 1602 | I | 0·41 | 40 | 40 | Eusorghum | ||
| S. interjectum7 | 7·29 | 0·048 | 3572 | D | 1·22 | 30 | 30 | Stiposorghum | ||
| S. intrans6 | 2·28 | 0·023 | 1117 | K L | 1·14 | 10 | 10 | Stiposorghum | ||
| S. laxiflorum6 | 2·49 | 0·038 | 1220 | K J | 0·31 | 40 | 40 | Heterosorghum | ||
| S. leiocladum5 | 4·60 | 0·052 | 2254 | F | 2·30 | 20 | 10 | Parasorghum | ||
| S. macrospermum6 | 2·07 | 0·017 | 1014 | L | 0·26 | 40 | 40 | Chaetosorghum | ||
| S. matarankense6 | 2·51 | 0·029 | 1245 | K J | 1·26 | 10 | 10 | Parasorghum | ||
| S. nitidum5 | 8·79 | 0·060 | 4307 | B | 2·20 | 10, 20 | 20 | Parasorghum | ||
| S. plumosum5 (302489) | 7·65 | 0·090 | 3748 | C | 1·28 | 10, 20, 30 | 30 | Stiposorghum | ||
| S. plumosum7 (302635) | 10·30 | 0·249 | 5047 | A | 1·29 | 10, 20, 30 | 40 | Stiposorghum | ||
| S. propinquum5 | 1·52 | 0·012 | 745 | MN | 0·38 | 20 | 20 | Eusorghum | ||
| S. purpureosericeum | 4·18 | 0·022 | 2048 | G | 2·09 | 10 | 10 | Parasorghum | ||
| S. stipoideum6 | 2·19 | 0·061 | 1073 | L | 1·10 | 10 | 10 | Stiposorghum | ||
| S. timorense7 | 1·27 | 0·008 | 622 | N | 0·64 | 10, 20 | 10 | Stiposorghum | ||
| S. versicolor (2x)7 | 3·25 | 0·023 | 1592 | I | 1·62 | 108 | 10 | Parasorghum | ||
| S. versicolor (4x)5,9 | 6·67 | 0·086 | 3268 | E | 1·67 | 20 | 20 | Parasorghum | ||
1 pg = 980 mega base pairs (Mbp) (Cavalier-Smith, 1985).
Duncan grouping for 2C DNA content (pg). Means followed by the same letter are not significantly different (alpha = 0·05).
The genome size based on x = 5 was obtained using the following formula: genome size = [2C DNA content (pg)]/(2n chromosome no./5).
Reported chromosome numbers are from Lazarides et al. (1991) and Doggett (1988) unless referenced otherwise.
Calibration standard was Lupinus texensis; 2C DNA content is 2·44 pg.
Calibration standard was Arabidopsis thaliana ecotype Columbia; 2C DNA content = 314 Mbp or 0·32 pg (Bennett et al., 2002).
Calibration standard was Sorghum bicolor TX623; 2C DNA content = 1·67 pg.
Chromosome number reported by Yu and Liang (1992).
Colchicine-induced autotetraploid (Sun et al., 1994).
Fig. 1.
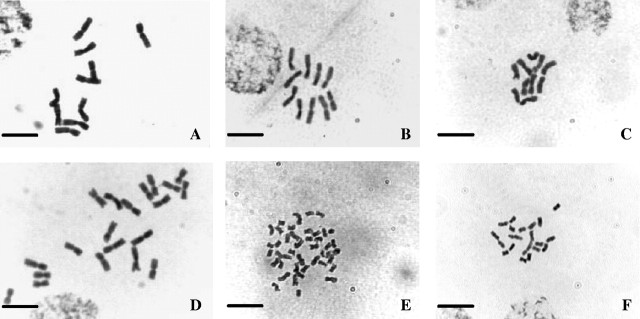
Chromosomes of Sorghum species representing differences in number and size: (A) S. leiocladum (2n = 10); (B) S. brachypodum (2n = 10); (C) S. timorense (2n = 10); (D) S. nitidum (2n = 20); (E) S. laxiflorum (2n = 40); (F) S. bicolor (2n = 20). Scale bars = 10 μm.
DNA content
The DNA contents of the 21 Sorghum species are presented as picograms and as megabase pairs (Table 2). The 2C DNA content varies 8·1-fold among Sorghum species from 1·27 to 10·30 pg (Table 2). Among the 2n = 10 species, the 2C DNA content range is 3·6-fold (1·27–4·60 pg). The 2C DNA content among the 2n = 20 species varies over a 5·8-fold range (1·52–8·79 pg). If the 2n = 20, 30 and 40 species are polyploids, based on genomes of five chromosomes, then the DNA content may be analysed in terms of DNA content per x = 5 genome (Table 2). When this is done, DNA content per x = 5 genome encompasses an 8·8-fold range (0·26–2·30 pg).
Mean DNA content of annuals and perennials was compared by a t-test. For all Sorghum species, the mean DNA content of perennials (2C = 6·20 pg) is significantly greater (alpha = 0·01) than the mean of the annuals (2C = 2·92 pg). However, when the same analysis was performed using adjusted x = 5 genome size, there was no significant difference in the means of the annuals (1·15 pg) and perennials (1·29 pg).
Mean DNA contents of native Australian species were compared by a t-test. For Australian species, the mean DNA content of perennials (2C = 7·73 pg) is significantly greater (alpha = 0·01) than the mean of the annuals (2C = 2·89 pg). The same analysis performed on the adjusted x = 5 genome size indicated a significant difference in the means of the annuals (1·09 pg) and perennials (1·66 pg) at alpha = 0·05.
Figure 2 is a plot of 2C DNA content and the maximum southern latitude inhabited by each Australian species. Although there is a significant difference in mean maximum southern latitude (t-test; alpha = 0·01) of the annual (−17·6 degrees) and perennial (−25·4 degrees) species, there is no significant correlation overall between maximum southern latitude and 2C DNA amount (r = 0·307; P = 0·023) or between maximum southern latitude and x = 5 DNA amount (r = 0·407; P = 0·1015).
Fig. 2.
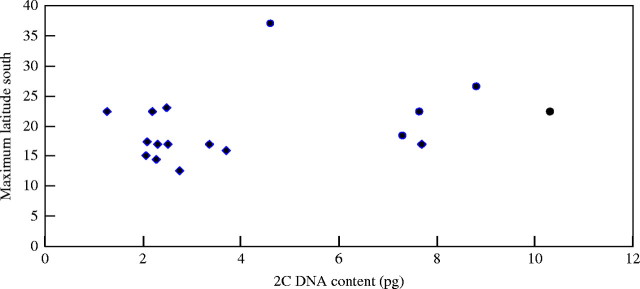
2C DNA content and the maximum southern latitude inhabited by native Australian Sorghum species. Diamonds represent annual and circles perennial species. The y-axis is the maximum latitude south of native Australian species.
Phylogenetic analysis
Figure 3 shows a strict consensus tree of six equally parsimonious solutions of 202 steps (CI = 0·792) for the 21 Sorghum species studied, based upon combined ITS/ndhF sequences. The 2C DNA content, 2n chromosome number and x = 5 genome size are indicated next to each species. The tree was rooted using Zea mays. There are two lineages for Sorghum (Fig. 3), one consisting of 2n = 10 species and their polyploid relatives with large chromosomes (Fig. 1) and another containing 2n = 20 and 2n = 40 species with relatively small chromosomes (Fig. 1).
Fig. 3.
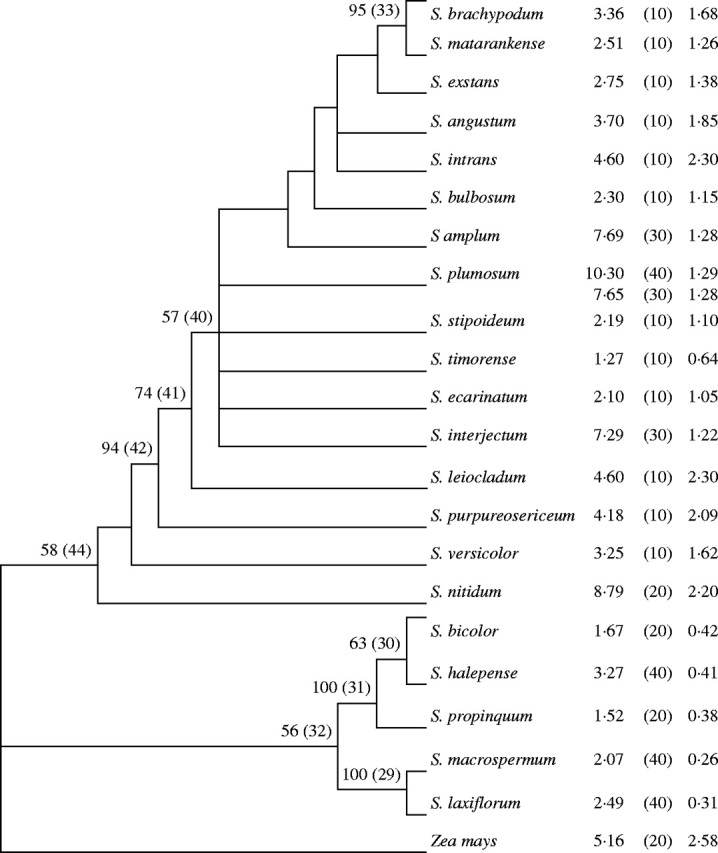
The strict consensus tree of six equally parsimonious solutions of 202 steps (CI = 0·792). Bootstrap support (%) for various nodes from 10 000 replications is indicated above the corresponding node. Only bootstrap values of ≥50 are shown. Numbers in parentheses above each node represent unambiguous nucleotide substitutions. The tree shows bootstrap support, 56 % and 58 % respectively, for lineages consisting of (a) S. bicolor through S. laxiflorum and (b) S. brachypodum through S. nitidum. The tree was rooted using Zea mays. The 2C DNA content, 2n chromosome number (in parenthesis), and x = 5 genome size are denoted next to each species. The DNA content for corn (4C = 10·31 pg) is for inbred line Va35 (Laurie and Bennett, 1985).
DISCUSSION
Chromosome number
The base chromosome number for the Andropogoneae has been considered to be either five or ten (Garber, 1950; Celarier, 1956). Garber (1950) stated that the base chromosome number could be n = 10 based upon the predominance of genera with a chromosome number of n = 10. Garber (1950) also noted that the presence of genera with n = 5 suggests that five may be basic for the tribe, and questioned whether five represents the end point of a descending series in base chromosome numbers or the starting point of a polyploid series. Spangler et al. (1999) tried to resolve the base chromosome number for the Andropogoneae by superimposing chromosome numbers onto their phylogenetic tree based upon ndhF sequence analysis. The wide variety of taxa near the base of the tree with n = 10 led them to suggest that ten, not five, is the base number of the tribe.
The occurrence of both of n = 5 and n = 10 species of Sorghum raises questions regarding the base number of this genus. For example, there is genetic and molecular evidence that Sorghum bicolor (n = 10), although generally considered to be a diploid, may actually be a tetraploid. Brown (1943), Kidd (1952) and Endrizzi and Morgan (1955) reported bivalents in meiosis from haploid S. bicolor, indicating homology among chromosomes. Endrizzi and Morgan (1955) also observed translocations among progeny of haploids and proposed that these originated from recombination between homologous duplicated regions (resulting from polyploidy) in the haploid genome.
Several RFLP maps have been constructed for sorghum (Whitkus et al., 1992; Berhan et al., 1993; Chittenden et al., 1994; Pereira et al., 1994; Xu et al., 1994; Dufour et al., 1996; Peng et al., 1999), and these have provided the basis for comparing the sorghum genetic map with that of other grass species. Comparison of the RFLP maps of sorghum and maize using maize-derived probes showed that many linkage groups are conserved between these two genomes (Whitkus et al., 1992). Thirty-eight per cent of a common set of 89 RFLP probes for maize and sorghum were duplicated in sorghum and 72 % were duplicated in maize. Whitkus et al. (1992) suggested that the primary processes involved in the divergence of maize and sorghum genomes were duplications (polyploidy or segmental), inversions, and intrachromosomal translocations. It was further suggested that, if maize and sorghum are both ancient polyploids, the larger proportion of duplicated loci in maize compared with sorghum might be due to a more rapid loss of duplicated segments in the evolution of sorghum (Whitkus et al., 1992; Pereira et al., 1994). Xu et al. (1994), Chittenden et al. (1994) and Peng et al. (1999) reported that between 8·2 % and 18·6 % of sorghum clones hybridized to duplicated loci. Peng et al. (1999) concluded that the distribution of duplicated loci in sorghum does not support the hypothesis that S. bicolor is of tetraploid origin.
Molecular cytogenetic evidence strongly supports a polyploid origin of sorghum. Gomez et al. (1998) and Zwick et al. (2000) detected by fluorescent in situ hybridization (FISH) a <280-bp tandemly repeated DNA sequence, CEN38, that differentially resided around the centromere of ten of the 20 chromosomes of S. bicolor. Gomez et al. (1998) proposed that the ten chromosomes displaying strong FISH signals composed one subgenome of a tetraploid, whereas the other ten chromosomes with little or no FISH signal represented another subgenome.
The sequence-based phylogenetic trees of Spangler et al. (1999) and that are presented in Fig. 3 leave unresolved the base chromosome number of the genus Sorghum. Spangler et al. (1999) showed chromosome numbers in an ndhF tree of 35 Andropogoneae species that included 12 species of Sorghum. There were two inaccuracies regarding chromosome numbers of Sorghum species in their report. First, they used a chromosome number of n = 10 for S. leiocladum. Here a chromosome number of n = 5 is reported for this species. Secondly, they included an unidentified species, Sorghum sp., in their analysis and assumed without documentation that its chromosome number was n = 10. When this species is removed and a correct chromosome number for S. leiocladum is used, the Spangler et al. (1999) tree has Sorghum split into two branches diverging from a node with equivocal chromosome numbers. One branch contains Sorghum with chromosome numbers of 2n = 20, 40. The other branch contains the 2n = 10 chromosome species.
The sequence phylogeny presented here, based upon combined ITS/ndhF sequences (Fig. 3), also has Sorghum split into two lineages, one with 2n = 10 species with relatively large chromosomes and their related polyploids (2n = 20, 30 and 40) and a second containing 2n = 20 and 2n = 40 species with smaller chromosomes. The ancestral chromosome number of the genus Sorghum (x = 5 vs. x = 10) remains unresolved.
Nuclear DNA content
Nuclear DNA content is apparently important to the evolution and adaptation of plant species (Price, 1976, 1988; Bennett, 1973). DNA content affects cellular properties including nuclear volume, cell volume, the duration of mitosis and meiosis and minimum generation time (for reviews, see Price, 1976, 1988; Bennett, 1998), and may influence ecological adaptation and distribution (Bennett, 1987; Bennett et al., 2000). Geographic and ecological parameters including latitude, moisture availability and temperature, and growth form have been correlated with nuclear DNA content (Stebbins, 1966; Price, 1988; Bennett et al., 2000). Genome size variation is common among congeneric species (Price, 1976), as is exemplified by the 3·6- and 5·8-fold range in 2C DNA content observed among the respective 2n = 10 and 2n = 20 Sorghum species reported herein.
Annual and perennial species of a genus often differ in DNA content (Price, 1976). For herbaceous angiosperms, the mean DNA content of perennials is greater than that of annuals (Bennett, 1972). For Australian native Sorghum species, the perennials have a significantly higher mean DNA content than annuals when comparing DNA content per 2C nucleus and for x = 5 genome size. Although there is geographical overlap in their distributions, the annual Sorghum species in Australia tend to occupy the lower (more tropical) latitudes with the higher subtropical to temperate latitudes (further south) inhabited by the perennials. A statistical analysis of DNA content and the maximum southern latitude at which the species naturally grow quantified this relationship. There is a significant difference (alpha = 0·01) between the mean maximum latitude inhabited by the annual (−17·6 degrees) and perennial (−25·4 degrees) species (Fig. 2).
A current unresolved question concerns the relative frequency of increases and decreases in DNA content in angiosperm phylogeny (Bennetzen and Kellogg, 1997, Leitch et al., 1998; Wendel et al., 2002). Bennetzen and Kellogg (1997) analysed DNA content from a phylogenetic perspective in grasses and proposed that the evolution of DNA content in plants is primarily from low to high due to the combined effects of retroelement accumulation and polyploidy. They proposed that plants may have a ‘one-way ticket to genomic obesity’. In contrast to an ‘increase only’ hypothesis for genome size evolution, it has been proposed that reduction in DNA content in plants has commonly occurred (Price, 1976, 1988; see also Bennetzen et al., 2005). However, until recently this theory was lacking support based on well-founded phylogenetic relationships.
Wendel et al. (2002) analysed genome size evolution among species of the cotton tribe Gossypieae using a phylogenetic approach. They superimposed genome sizes on a well-supported sequence phylogeny and statistically inferred ancestral DNA contents. From this analysis it was concluded that both increases and decreases in DNA content have occurred repeatedly during evolution of the Gossypieae and DNA decreases actually exceeded increases. This supported the theory of a bi-directional dynamic nature of plant genome size evolution. Soltis et al. (2003) interpreted DNA content evolution in angiosperm phylogeny to be generally from low to high, but stated that genome size is dynamic with both increases and decreases occurring.
Superimposing genome sizes onto the combined ITS/ndhF sequence phylogeny (Fig. 3) provides a limited interpretation of the direction(s) of evolution of genome size in Sorghum. The lineage in Fig. 3 containing S. brachypodum through S. nitidum is rooted with large x = 5 genome sizes, i.e. 2·20 pg (S. nitidum), 1·62 pg (S. versicolor), 2·09 pg (S. purpureosericeum) and 2·30 pg (S. leiocladum). This branch splitting S. leiocladum and the remaining species has moderate bootstrap support (74 %). The x = 5 genome sizes, with the exception of S. brachypodum (1·68 pg), S. intrans (2·3 pg) and S. angustum (1·85 pg), are all relatively low (0·63–1·38 pg). These species with smaller genomes probably represent evolutionary reductions in genome size, the extreme reduction having occurred in S. timorense (0·63 pg). Therefore, genome size evolution in the genus Sorghum apparently did not involve a ‘one way ticket to genomic obesity’ as was proposed for the grasses by Bennetzen and Kellogg (1997).
Acknowledgments
This research was supported, in part, by the Texas Agricultural Experiment Station, Texas A&M Office of University Research, the USDA Sorghum Germplasm Evaluation Committee, and the Australian Tropical Crops and Forages Genetic Resource Centre.
LITERATURE CITED
- Bennett MD. 1972. Nuclear DNA content and minimum generation time in herbaceous angiosperms. Proceedings of the Royal Society of London, Series B 181: 109–135. [DOI] [PubMed] [Google Scholar]
- Bennett MD. 1973. Nuclear characters in plants. Brookhaven Symposium in Biology 25: 344–366. [Google Scholar]
- Bennett MD. 1987. Variation in genomic form in plants and its ecological implications. New Phytologist 106 (Suppl.): 177–200. [Google Scholar]
- Bennett MD. 1998. Plant genome values: how much do we know? Proceedings of the National Academy of Sciences of the USA 95: 2011–2016. [DOI] [PMC free article] [PubMed] [Google Scholar]
- Bennett MD, Bhandol P, Leitch I.J. 2000. Nuclear DNA amounts in angiosperms and their modern uses—807 new estimates. Annals of Botany 86: 859–909. [Google Scholar]
- Bennett MD, Leitch IJ, Price HJ, Johnston JS. 2003. Comparisons with Caenorhabditis (∼100 Mb) and Drosophila (∼175 Mb) using flow cytometry show genome size in arabidopsis to be ∼157 Mb and thus ∼25 % larger than the Arabidopsis Genome Initiative of ∼125 Mb. Annals of Botany 91: 547–557. [DOI] [PMC free article] [PubMed] [Google Scholar]
- Bennetzen J L, Kellogg EA. 1997. Do plants have a one-way ticket to genomic obesity? Plant Cell 9: 1509–1514. [DOI] [PMC free article] [PubMed] [Google Scholar]
- Bennetzen J, Ma J, Devos KM. 2005. Mechanisms of recent genome size variation in flowering plants. Annals of Botany 95: 127–132. [DOI] [PMC free article] [PubMed] [Google Scholar]
- Berhan AM, Hulbert L, Butler G, Bennetzen JL. 1993. Structure and evolution of the genomes of Sorghum bicolor and Zea mays Theoretical and Applied Genetics 86: 598–604. [DOI] [PubMed] [Google Scholar]
- Brown, MS. 1943. Haploid plants in sorghum. Journal of Heredity 34: 163–166. [Google Scholar]
- Cavalier-Smith T. 1985.The evolution of genome size. John Wiley & Sons, London. [Google Scholar]
- Celarier RP. 1956. Additional evidence for five as the basic chromosome number of the Andropogoneae. Rhodara 58: 135–143. [Google Scholar]
- Chittenden LM, Schertz KF, Lin Y-R, Wing RA, Paterson AH. 1994. A detailed RFLP map of Sorghum bicolor × S. propinquum suitable for high-density mapping suggests ancestral duplication of sorghum chromosomes of chromosome segments. Theoretical and Applied Genetics 87: 925–933. [DOI] [PubMed] [Google Scholar]
- deWet JMJ. 1978. Systematics and evolution of Sorghum Sect. Sorghum (Gramineae). American Journal of Botany 65: 477–484. [Google Scholar]
- Dillon SL, Lawrence PK, Henry RJ. 2001. The use of ribosomal ITS to determine phylogenetic relationships within Sorghum Plant Systematics and Evolution 230: 97–110. [Google Scholar]
- Doggett H. 1988.Sorghum, 2nd edn. John Wiley & Sons, New York. [Google Scholar]
- Duara BN, Stebbins GL. 1952. A polyhaploid obtained from a hybrid derivative of Sorghum halepense × S. vulgare var. Sudanense. Genetics 37: 369–374. [DOI] [PMC free article] [PubMed] [Google Scholar]
- Dufour P, Grivet L, D'Hont A, Deu M, Trouche G, Glaszmann JC, Hamon P. 1996. Comparative genetic mapping between duplicated segments on maize chromosomes 3 and 8 and homeoelogous regions in sorghum and sugarcane. Theoretical and Applied Genetics 92: 1024–1030. [DOI] [PubMed] [Google Scholar]
- Duvall MR, Doebley JF. 1990. Restriction-site variation in the chloroplast genome of Sorghum (Poaceae). Systematic Botany 15: 472–480. [Google Scholar]
- Endrizzi JE. 1957. Cytological studies of some species and hybrids in the Eu-sorghums. Botanical Gazette 119: 1–10. [Google Scholar]
- Endrizzi JE, Morgan DT. 1955. Chromosomal interchanges and evidence for duplication. Journal of Heredity 46: 201–208. [Google Scholar]
- Galbraith DW, Harkins KR, Maddox JM, Ayres NM, Sharma DP, Firoozabady E. 1983. Rapid flow cytometric analysis of the cell cycle in intact plant tissues. Science 220: 1049–1051. [DOI] [PubMed] [Google Scholar]
- Garber ED. 1950. Cytotaxonomic studies in the genus Sorghum University of California Publications in Botany 23: 283–361. [Google Scholar]
- Gomez MI, Islam-Faridi MN, Zwick MS, Czeschin DG Jr, Hart GE. Wing RA, Stelly DM, Price HJ. 1998. Tetraploid nature of Sorghum bicolor (L.) Moench. Journal of Heredity 89: 188–190. [Google Scholar]
- Higgins DG, Bleasby AJ, Fuchs, R. 1992. CLUSTAL V: improved software for multiple sequence alignment. Computer Applications in the Biosciences 8: 189–191. [DOI] [PubMed] [Google Scholar]
- Jewell DC, Islam-Faridi MN. 1994. Details of a technique for somatic chromosome preparation and C-banding of maize. In: Freeling M, Walbot V, eds. The maize handbook. Springer-Verlag, 484–493. [Google Scholar]
- Johnston JS, Bennett MD, Rayburn AL, Galbraith DW, Price HJ. 1999. Reference standards for determination of DNA content of plant nuclei. American Journal of Botany 86: 609–613. [PubMed] [Google Scholar]
- Kidd HJ. 1952. Haploid and triploid sorghum. Journal of Heredity 43: 204–225. [Google Scholar]
- Laurie DA, Bennett MD. 1985. Nuclear DNA content in the genera Zea and Sorghum: intergeneric, interspecific and intraspecific variation. Heredity 55: 307–313. [Google Scholar]
- Lazarides M, Hacker JB, Andrew MH. 1991. Taxonomy, cytology and ecology of indigenous Australian sorghums (Sorghum Moench: Andropogoneae: Poaceae). Australian Systematic Botany 4: 591–635. [Google Scholar]
- Leitch IJ, Chase MW, Bennett MD. 1998. Phylogenetic analysis of DNA C-values provides evidence for a small ancestral genome size in flowering plants. Annals of Botany 82 (Suppl. A): 85–94. [Google Scholar]
- Peng Y, Schertz KF, Cartinhour S, Hart GE. 1999. Comparative genome mapping of Sorghum bicolor (L.) Moench using an RFLP map constructed in a population of recombinant inbred lines. Plant Breeding 118: 225–235. [Google Scholar]
- Pereira MG, Lee M, Bramel-Cox P, Woodman W, Doebley J, Whitkus R. 1994. Construction of an RFLP map of sorghum and comparative mapping in maize. Genome 37: 236–243. [DOI] [PubMed] [Google Scholar]
- Price HJ. 1976. Evolution of DNA content in higher plants. Botanical Review 42: 27–52. [Google Scholar]
- Price HJ. 1988. DNA content variation among higher plants. Annals of the Missouri Botanical Gardens 75: 1249–1257. [Google Scholar]
- Soltis DE, Soltis PS, Bennett MD, Leitch IJ. 2003. Evolution of genome size in the angiosperms. American Journal of Botany 90: 1596–1603. [DOI] [PubMed] [Google Scholar]
- Spangler RE. 2003. Taxonomy of Sarga, Sorghum and Vacoparis (Poaceae: Andropogoneae). Australian Systematic Botany 16: 279–299. [Google Scholar]
- Spangler RE, Zaitchik B, Russo E, Kellogg E. 1999. Andropogoneae evolution and generic limits in Sorghum (Poaceae) using ndhF sequences. Systematic Botany 24: 267–281. [Google Scholar]
- Sun Y, Chen SQ, Liang GH. 1994. Induction of autopolyploid plants of Sorghum versicolor Cytologia 59: 109–114. [Google Scholar]
- Stebbins GL 1966. Chromosomal variation and evolution. Science 152: 1463–1469. [DOI] [PubMed] [Google Scholar]
- Swofford DL 1999.Phylogenetic analysis using parsimony (and other methods) PAUP* 4.0 (test version). Sunderland, MA: Sinauer. [Google Scholar]
- Tang H, Liang GH. 1988. The genomic relationship between cultivated sorghum (Sorghum bicolor (L.) Moench) and Johnsongrass (S. halepense (L.) Pers.): a re-evaluation. Theoretical and Applied Genetics 76: 277–284. [DOI] [PubMed] [Google Scholar]
- Wendel JF, Cronn RC, Johnston JS, Price HJ. 2002. Feast and famine in plant genomes. Genetica 115: 37–47. [DOI] [PubMed] [Google Scholar]
- Whitkus R, Doebley J, Lee M. 1992. Comparative genome mapping of sorghum and maize. Genetics 132: 1119–1130. [DOI] [PMC free article] [PubMed] [Google Scholar]
- Xu G-W, Magill CW, Schertz KF, Hart GE. 1994. A RFLP linkage map of Sorghum bicolor (L.) Moench. Theoretical and Applied Genetics 89: 139–145. [DOI] [PubMed] [Google Scholar]
- Yu H, Liang GH. 1992. N- and C-band karyotypes of two Parasorghum species, Sorghum purpureo-sericeum and S. versicolor Crop Science 32: 649–653. [Google Scholar]
- Zwick MS, Islam-Faridi MN, Zhang HB, Hodnett GL, Gomez MI, Kim JS, Price HJ, Stelly DM. 2000. Distribution and sequence analysis of the centromere-associated repetitive element CEN38 of Sorghum bicolor (Poaceae). American Journal of Botany 87: 1757–1765. [PubMed] [Google Scholar]