Abstract
• Background and Aims The amount of iron (Fe) and copper (Cu) that is loaded into grains of wheat (Triticum aestivum) depends on both the amount of nutrient taken up by the plant post-anthesis and the amount that is remobilized from vegetative organs as they senesce. Previous reports have shown that these two micronutrients behave quite differently in wheat in that Cu is readily remobilized to the grain whilst Fe shows poor remobilization. The object was to quantify the distribution of Fe and Cu in wheat and to show how this distribution changes from anthesis to grain maturity.
• Methods The uptake and distribution of both Fe and Cu were investigated in wheat grown at two levels, adequate and low, of both micronutrients. Plants were grown in sand culture and the main culms were harvested at anthesis, 18 days post-anthesis and at maturity. Plants were separated into various organs and analysed for Fe and Cu using ICP-OES.
• Key Results There was good remobilization of Fe from the rest of the shoot to the grain with 77 % of the total shoot Fe in the grain at maturity. In the adequate-Cu treatment there was 62 % of the total plant Cu in the grain at maturity, whereas in the low-Cu treatment this was only 40 %. There was no net Fe taken up into the above-ground plant parts post-anthesis whilst for Cu there was. The remobilization evident for Fe and Cu was greater than that found for zinc and much greater than evident for manganese in the same material.
• Conclusions The results reported here represent good evidence for the high reproductive mobility of both Fe and Cu in wheat.
Keywords: Iron, copper, wheat, distribution, remobilization, Triticum aestivum, zinc, manganese, grain
INTRODUCTION
Deficiencies of essential micronutrients such as iron (Fe) and zinc (Zn) are widespread in humans. In many regions of the world, a large proportion of dietary intake of these nutrients is derived from grains. As grain levels of these micronutrients are generally low, increasing the micronutrient content of grains has been identified as a way of addressing human micronutrient deficiencies (Graham and Welch, 1996).
The amount of micronutrients [e.g. Fe, Zn, manganese (Mn) and copper (Cu)] in the grain will depend on the amount taken up by the roots during grain development and the amount redistributed to the grain from vegetative tissue via the phloem. The amount remobilized via the phloem is greatly dependent on the phloem mobility of each element. Pearson and Rengel (1994) investigated Zn and Mn transport into wheat grains and found that Zn showed good remobilization from leaves whilst Mn remobilization was poor. The poor remobilization of Mn was thought to be due to the poor phloem mobility of Mn. It should be noted that all nutrient transport into the grain must at some stage pass through the phloem due to xylem discontinuity in the grain stalk (O'Brien et al., 1985).
Iron has been described as having intermediate phloem mobility (Kochian, 1991). Averaged over all growth stages Fe generally has higher phloem mobility than Cu. However, in field-grown wheat crops it has previously been shown that there is very limited Fe remobilization to the grain. Only 5 % of the shoot Fe in irrigated wheat at maturity was found in the grain compared with 32 % for Cu (Hocking, 1994). Miller et al. (1994) found that 20 % of the shoot Fe was in the grain at maturity in hard red spring wheat, whilst this figure was 60 % for Cu. Rice also appears to be very inefficient at transporting Fe to grain as only 4 % (cf. Cu 45 %) of total shoot Fe was found in the grain (Marr et al., 1995). Whereas wheat and rice appear to have poor Fe remobilization, other crops have good Fe remobilization. Zhang et al. (1995) found good remobilization of Fe out of mature leaves of bean. In peas as much as 75 % of the total shoot Fe was found in the seeds (Grusak, 1995).
Copper has been described as variably mobile in the phloem (Loneragan, 1981). It has earned this description because it can show all the symptoms of being phloem immobile (no remobilization from old to young tissue under deficiency) or phloem mobile (upon senescence of old leaves). The distribution and remobilization of Cu in wheat has been thoroughly investigated by Hill and co-workers (Hill et al., 1978, 1979a–c). In this series of papers it was found that Cu was remobilized from senescing leaves in conjunction with nitrogen. In this way the majority of total plant Cu at maturity was found in the grain.
This study is an investigation into the distribution of Fe throughout wheat plants, how this distribution changed during grain filling, and how varying the availability of Fe influenced these processes. At the same time Cu was studied as a comparison.
MATERIALS AND METHODS
Wheat (Triticum aestivum ‘Warigal’) seeds were surface sterilized by soaking in 70 % ethanol for 1 min followed by 5 min in NaClO (1 % Cl). Seeds were then rinsed thoroughly and germinated in aerated Millipore H2O for 48 h. Five seeds were planted into individual pots (27 × 9 × 9 cm) containing 3·2 kg of siliceous sand (Laffer sand) collected from undisturbed scrub soil near Tintinara, South Australia (Thongbai et al., 1993). The sand was sieved (2 mm stainless-steel mesh) to remove organic matter, washed six times in reverse-osmosis H2O, and then air-dried. After this treatment the typical micronutrient concentrations of the soil were (DTPA-extractable, mg kg−1): Fe, <1; Cu, 0·02; Zn, 0·06; Mn, 0·20. Nutrients were supplied as solutions at watering. Macronutrients were supplied to the sand as two additions, one initial and one at 6 weeks, totalling (in mg pot−1): NH4NO3 (750), K2SO4 (260), MgSO4.7H2O (150), CaSO4 (91) and KH2PO4 (231). Micronutrients were added to pots in one initial addition amounting to: (in mg pot−1) MnSO4 (17·5), H2MoO4.H2O (1·40), H3BO3 (7), CoSO4.6H2O (1·32), NaCl (20·3) and ZnSO4 (26·43). Cu and Fe treatments were applied as either (in mg pot−1): control (added Fe and Cu) – CuSO4.5H2O (15·72) and FeSO4.7H2O (21); no added Cu – FeSO4.7H2O (21); and no added Fe – CuSO4.5H2O (15·72). The no-added-Cu plants were growing so poorly at 5 weeks that some Cu (CuSO4.5H2O, 1·57 mg pot−1) was added with the second addition of macronutrients to avoid the possibility of no grain yield (Graham and Pearce, 1979). The no-added-Cu treatment was thus referred to as the low-Cu treatment. The sand in pots was maintained at close to 12 % water content (w/w) with Millipore H2O. Plants were grown in a temperature-controlled growth room with a 21/15 °C, 14/10 h day/night cycle with light supplied at 600 µmol m−2 s−1 PAR by high pressure sodium lamps (Philips SON-T Agro 400W, Philips, Osnabrück, Germany). Five days after planting the plants were thinned down to two plants per pot.
The main culms of the plants were harvested at anthesis, 18 days post-anthesis and at maturity. Main culms were separated into different plant parts and dried at 80 °C for 48 h. Dried plant material was weighed and digested using a nitric acid/perchloric acid method (Zarcinas et al., 1987). Iron and Cu concentrations were analysed using an inductively coupled plasma optical emission spectrometer (ICP-OES: ARL 3580 B, ARL, Lausanne, Switzerland).
RESULTS
Growth
There was no difference in the growth characteristics (grain yield, total biomass, days to anthesis) between the control and no-added-Fe plants (Table 1). Low-Cu plants had lower total plant matter and lower grain yields than the control and no-added-Fe plants. The grain weight at maturity of the low-Cu plants was one-third less than the control or no-added-Fe plants. The low-Cu plants also took longer to reach anthesis than the control and no-added-Fe plants. Senescence associated with maturation was delayed in low-Cu plants. In these plants there were no dead leaves at anthesis, whilst in the control and adequate-Cu plants at anthesis only the flag leaves showed no sign of senescence.
Table 1.
Growth characteristics of plants with different iron and copper treatments
| Harvest |
Non-grain weight (g) |
Grain weight (g) |
Grain number |
Individual grain weight (mg) |
Days to anthesis |
|
|---|---|---|---|---|---|---|
| Control | Anthesis | 4·16 (0·14) | 58·8 (0·6) | |||
| Anthesis + 18 d | 4·11 (0·12) | 2·30 (0·19) | 115·3 (1·7) | 20 | ||
| Maturity | 3·51 (0·04) | 3·36 (0·03) | 115·5 (3·1) | 29 | ||
| No added Fe | Anthesis | 3·87 (0·10) | 57·7 (0·6) | |||
| Anthesis + 18 d | 3·86 (0·12) | 2·13 (0·10) | 113·3 (2·1) | 19 | ||
| Maturity | 3·55 (0·11) | 3·34 (0·10) | 114·3 (1·9) | 29 | ||
| Low Cu | Anthesis | 2·03 (0·08) | 62 (0·7) | |||
| Anthesis + 18 d | 1·78 (0·16) | 0·96 (0·16) | 75·3 (8·3) | 13 | ||
| Maturity | 2·00 (0·15) | 1·66 (0·21) | 81 (6·6) | 20 |
Numbers in parentheses are s.e.m. (n = 4).
Fe and Cu Concentration
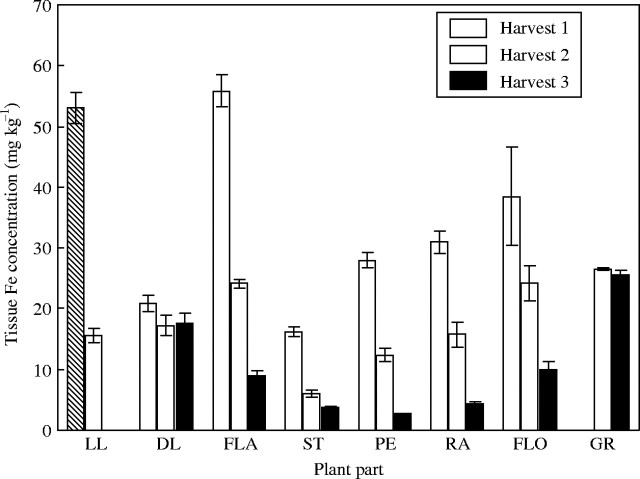
As with the growth characteristics, at no stage was there any difference in tissue Fe concentration between the two Fe treatments, control and no Fe added. Only the Fe added results are shown (Fig. 1). The highest Fe concentrations were in the lower leaves and flag leaves at anthesis. All plant parts, apart from the grain, showed large decreases in concentration between harvest 1 and harvest 3. This was most evident in the peduncle, flag leaf and rachis where there was up to a ten times reduction in the Fe concentration. The tissue with the lowest concentration was the stem but even this concentration was greatly reduced between harvests 1 and 3.
Fig. 1.
Iron concentration in tissues of control plants when harvested at anthesis (harvest 1), 18 days post-anthesis (harvest 2) and maturity (harvest 3). Values are the means of four replicates (±s.e.m.). Plant parts are: LL, lower leaves, DL, dead lower leaves; FLA, flag leaves; ST, stems; PE, peduncle; RA, rachis; FLO, florets; GR, grain.
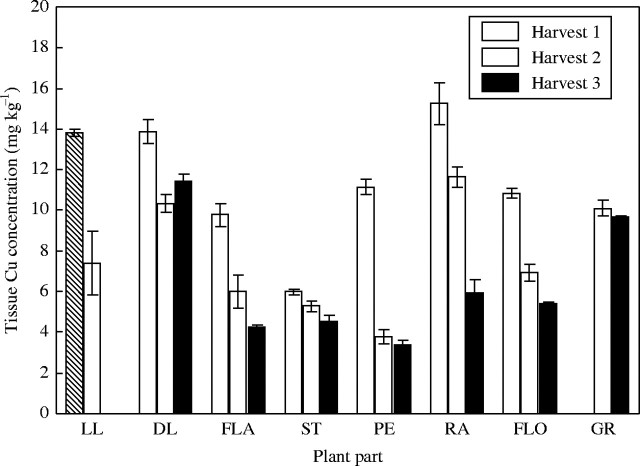
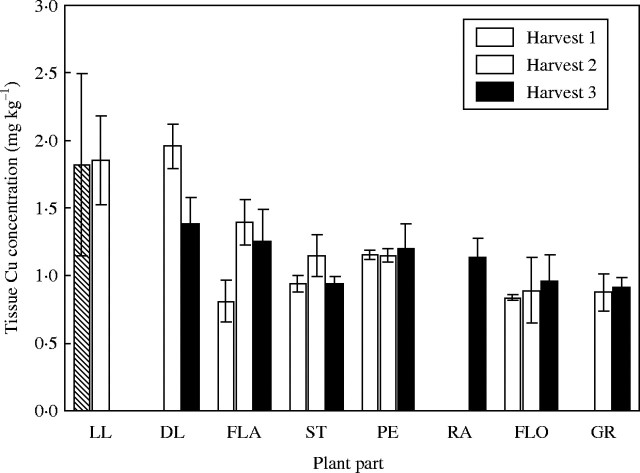
Unlike the Fe treatments, there were large differences in tissue Cu concentrations between the high and low-Cu treatments (Figs 2 and 3). The difference in tissue concentration was generally a factor of 10, reflecting the differences in Cu supply between the high and low treatments (15·72 cf. 1·57 mg pot−1). In the low-Cu plants, there was almost no difference in tissue Cu concentration between harvests, whilst in the high-concentration plants there was a reduction between harvests. The greatest decrease in Cu concentration was seen in the peduncle. The Cu levels in the rachis of the low-Cu treatment were so low as to be below the detection limit of the ICP-OES. It would appear that the peduncle of the control plants showed the earliest remobilization of Cu as the peduncle concentration was at harvest 3 levels by harvest 2. The Cu concentration in the grain of the low-Cu treatment was the lowest of any tissue, as compared with the control treatment where the grain Cu concentration was almost as high as any other plant tissue.
Fig. 2.
Copper concentration in tissues of control plants when harvested at anthesis (harvest 1), 18 days post-anthesis (harvest 2) and maturity (harvest 3). Values are the means of four replicates (±s.e.m.). Plant parts are as in Fig. 1.
Fig. 3.
Copper concentration in tissues of low copper plants when harvested at anthesis (harvest 1), 18 days post-anthesis (harvest 2) and maturity (harvest 3). Values are the means of four replicates (±s.e.m.). Plant parts are as in Fig. 1.
Tissue Fe concentrations in the control treatment were generally two to five times higher than tissue Cu concentrations (Figs 1 and 2). The variation in Fe concentrations between plant parts that was evident, say between the flag leaf and the stem, was much greater than the variation in Cu concentrations. The reduction in concentration between harvest 1 and harvest 3 was also less for Cu in the control plants than for Fe in the same plants. The comparison between Fe and Cu concentration of the dead and live leaf tissue is made difficult because there is a gradient between when a leaf is either live or dead (i.e. a leaf which is half necrotic). Hence, the best indicator of leaf tissue content/concentration is perhaps the flag leaf, which generally showed no sign of necrosis at harvest 2.
Fe and Cu Content
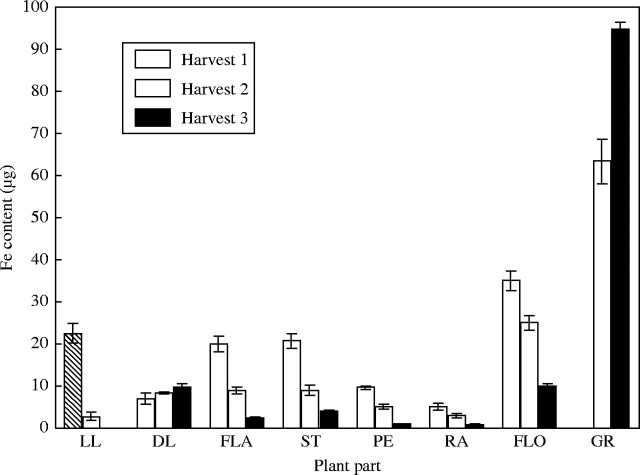
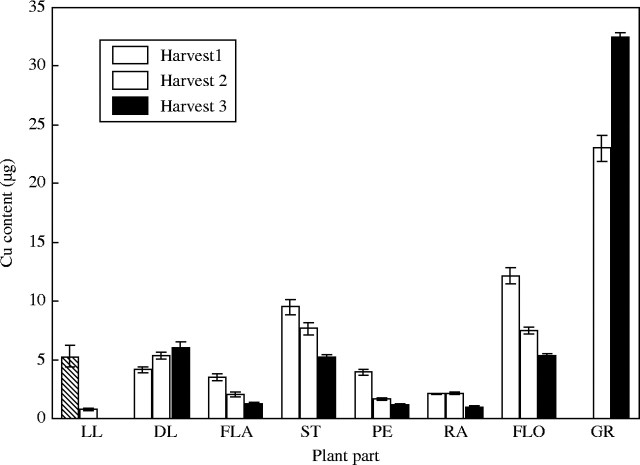
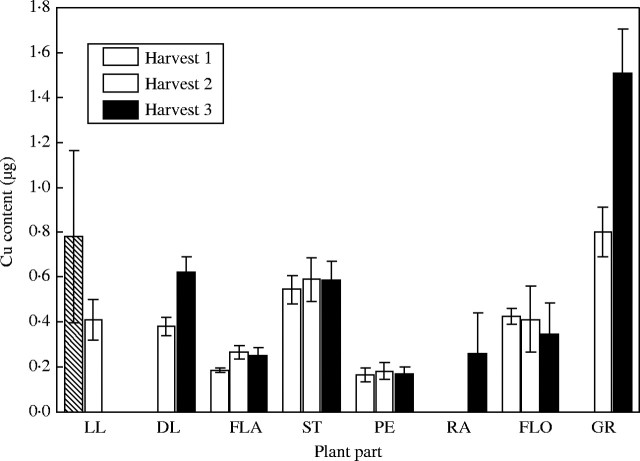
Calculation of Fe and Cu content of whole organs allows the assessment of the extent of remobilization to and from organs. In terms of content, the grain contains by far the most Fe and Cu in the mature plant (Figs 4 and 5). Although the grain concentration did not change between harvests the grain content did (Figs 4–6). Between harvests 2 and 3, in the control treatment the Fe and Cu content of the grain increased by 30 %, whilst in the low-Cu treatment the increase was almost 50 %. As the concentration of Fe and Cu did not change in this time (Figs 1–3), this implies that the Fe and Cu were loaded into the grain at the same rate as the development of the grain.
Fig. 4.
Iron content of tissues of control plants when harvested at anthesis (harvest 1), 18 days post-anthesis (harvest 2) and maturity (harvest 3). Values are the means of four replicates (±s.e.m.). Plant parts are as in Fig. 1.
Fig. 5.
Copper content of tissues of control plants when harvested at anthesis (harvest 1), 18 days post-anthesis (harvest 2) and maturity (harvest 3). Values are the means of four replicates (±s.e.m.). Plant parts are as in Fig. 1.
Fig. 6.
Copper content of tissues of low copper plants when harvested at anthesis (harvest 1), 18 days post-anthesis (harvest 2) and maturity (harvest 3). Values are the means of four replicates (±s.e.m.). Plant parts are as in Fig. 1.
Timing of uptake of Fe and Cu differed markedly (Table 2). In the control treatment, the total amount of Fe in the tissue did not differ between harvests 1 and 3. The amount of Fe remobilized from the maternal tissue is enough to account for the Fe content of the grain, and the plant took up no new Fe. The Cu in the aerial parts of plants kept increasing post-anthesis. In the control treatment the total Cu increased between harvests 1 and 2 but not after that. In the low-Cu treatment the amount of Cu increased steadily between anthesis and maturity. This Cu was either being remobilized from the roots or taken up from the soil by the roots and new to the plant. The majority of the grain Fe was remobilized from the non-ear parts of the plant. Only 20 % of the grain content came from within the head itself. There was no net remobilization of Cu from vegetative parts of the shoot to the grain at all in the low-Cu treatment.
Table 2.
Nutrient content of wheat shoots at three harvests expressed as: total content; content at each harvest as a percentage of total content at maturity; and content in plant parts as a percentage of the total at each harvest
| Treatment Harvest | Control Fe |
Control Cu |
Low Cu |
|||||||||||||||
|---|---|---|---|---|---|---|---|---|---|---|---|---|---|---|---|---|---|---|
| 1 |
2 |
3 |
1 |
2 |
3 |
1 |
2 |
3 |
||||||||||
| Total content (µg) | 120 | 125 | 123 | 41 | 50 | 52 | 2·5 | 3·0 | 3·7 | |||||||||
| % maturity | 98 | 102 | 100 | 77 | 95 | 100 | 66 | 81 | 100 | |||||||||
| % plant part | ||||||||||||||||||
| LL | 19 | 2 | 0 | 13 | 2 | 0 | 32 | 13 | 0 | |||||||||
| DLL | 6 | 7 | 8 | 10 | 11 | 12 | 14 | 13 | 17 | |||||||||
| (TLL) | (25) | (9) | (8) | (23) | (12) | (12) | (46) | (26) | (17) | |||||||||
| FLA | 17 | 7 | 2 | 9 | 4 | 2 | 8 | 9 | 7 | |||||||||
| ST | 17 | 7 | 3 | 23 | 15 | 10 | 22 | 19 | 16 | |||||||||
| PE | 8 | 4 | 1 | 10 | 3 | 2 | 7 | 6 | 5 | |||||||||
| RA | 4 | 2 | 1 | 5 | 4 | 2 | 0 | 0 | 7 | |||||||||
| FLO | 29 | 20 | 8 | 30 | 15 | 10 | 17 | 14 | 9 | |||||||||
| GR | 0 | 50 | 77 | 0 | 46 | 62 | 0 | 26 | 40 | |||||||||
Plant parts: LL, lower leaf; DLL, dead lower leaf; TLL, combined live and dead lower leaves; FLA, flag leaf; ST, stems; PE, peduncle; RA, rachis; FLO, florets; GR, grain.
As a proportion of total metal in the plant within the grain, Fe was highest with 77 % of the plant Fe located within the grain 77 % (Table 2). For Cu this amount was less, with the high Cu plants having 62 % of the plant Cu in the grain. The low-Cu treatment had only 40 % of the total plant Cu located in the grain, and this came essentially from below ground during grain fill. For the control treatment, a considerable part of the plant content of both Fe (29 %) and Cu (30 %) at anthesis (harvest 1) was in the floret. By maturity (harvest 3), this amount in the floret dropped to 8 % for Fe and 10 % for Cu.
Zn and Mn
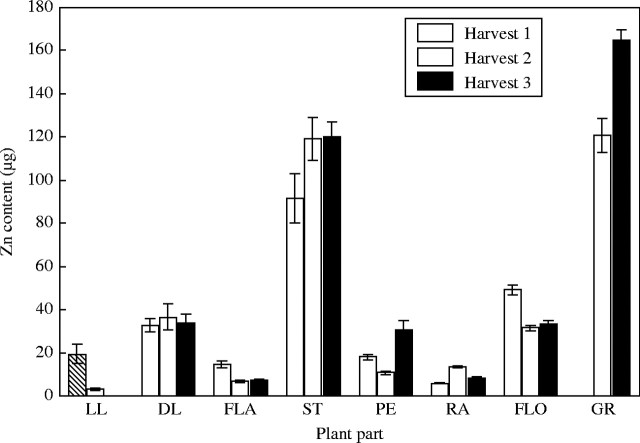
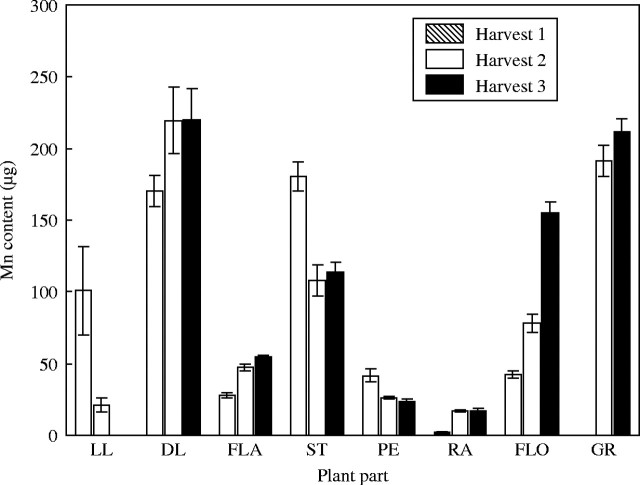
Zinc and manganese content of the tissue was measured as part of the tissue analysis and provide useful comparisons with Fe and Cu. Both Mn and Zn had a lower proportion of the total plant content in the grain (27 % and 42 %, respectively; cf. Fe, 77 %; Cu, 62 %) (Table 3). For Zn this is mainly due to the high levels of Zn in the stems (Fig. 7). The amount of Zn in the grain was five to ten times greater than most plant parts but the stem levels were of almost the same magnitude as the grain. For Mn (Fig. 8) the grain content was similar to the dead leaves, stems and florets. Compared with Fe and Cu, both Mn and Zn showed minimal remobilization. The Mn in the florets kept increasing throughout grain filling. There appeared to be some Zn remobilization from the lower leaves and the florets following the first harvest but this amount was small compared with the total amount in the plant. For Mn there was a drop in the stem content after the first harvest, but the general trend was for no remobilization and increasing content. This trend is most evident in the florets where the content at maturity was three times the level at anthesis. There was as much Mn in the dead leaves at maturity as there was in the grain.
Table 3.
Mn and Zn content of wheat shoots at three harvests expressed as: total content; content at each harvest as a percentage of total content at maturity; and content in plant parts as a percentage of the total at each harvest
| Treatment Harvest | Control Mn |
Control Zn |
||||||||||
|---|---|---|---|---|---|---|---|---|---|---|---|---|
| 1 |
2 |
3 |
1 |
2 |
3 |
|||||||
| Total content (µg) | 565 | 708 | 796 | 232 | 342 | 397 | ||||||
| % maturity | 71 | 89 | 100 | 77 | 95 | 100 | ||||||
| % plant part | ||||||||||||
| LL | 18 | 3 | 0 | 8 | 1 | 0 | ||||||
| DLL | 30 | 31 | 28 | 14 | 11 | 8 | ||||||
| (TLL) | (48) | (34) | (28) | (22) | (12) | (8) | ||||||
| FLA | 5 | 7 | 7 | 6 | 2 | 2 | ||||||
| ST | 32 | 15 | 14 | 40 | 35 | 30 | ||||||
| PE | 7 | 4 | 3 | 8 | 3 | 8 | ||||||
| RA | 0 | 2 | 2 | 3 | 4 | 2 | ||||||
| FLO | 7 | 11 | 20 | 21 | 9 | 8 | ||||||
| GR | 0 | 27 | 27 | 0 | 35 | 42 | ||||||
Plant parts: LL, lower leaf; DLL, dead lower leaf; TLL, combined live and dead lower leaves; FLA, flag leaf; ST, stems; PE, peduncle; RA, rachis; FLO, florets; GR, grain.
Fig. 7.
Zinc content of tissues of low copper plants when harvested at anthesis (harvest 1), 18 days post-anthesis (harvest 2) and maturity (harvest 3). Values are the means of four replicates (±s.e.m.). Plant parts are as in Fig. 1.
Fig. 8.
Manganese content of tissues of low copper plants when harvested at anthesis (harvest 1), 18 days post-anthesis (harvest 2) and maturity (harvest 3). Values are the means of four replicates (±s.e.m.). Plant parts are as in Fig. 1.
DISCUSSION
Growth
The reduction in growth of the low-Cu plants is indicative of the very low Cu levels in the Laffer soil used. Based on the reduced yield it is postulated that the low-Cu plants were just above that level where Cu deficiency-induced sterility occurs (Graham and Pearce, 1979). That the low-Cu treatment was Cu deficient means that caution must be applied when comparing Fe levels in this treatment with the control treatment.
Tissue concentrations
The tissue Cu concentrations in the control treatment were comparable to those found in other pot-grown (Hill et al., 1978; Loneragan, 1981), as well as field-grown, wheat (Hocking, 1994). Copper concentrations in these plants were well above the critical levels suggested in the literature (Reuter and Robinson, 1997). In the low-Cu treatment the Cu concentrations were around the critical level given for youngest expanded blades (Graham and Pearce, 1979; Reuter and Robinson, 1997), although all leaves in this study were physiologically considerably older. Between the control and low-Cu treatments the seed concentrations showed a similar pattern to that found by Loneragan (1981) where seed content in adequate-Cu plants was 10-fold higher than in deficient plants.
That neither the tissue Fe concentrations nor plant growth differed between the control and no-added-Fe treatment highlights both the inefficiency of fertilizing with FeSO4 and the Fe efficiency of wheat. It is assumed that all the Fe2+ added would have been oxidized to Fe3+ and precipitated within a few days leaving both Fe treatments basically the same in terms of Fe availability. The FeSO4 was used to avoid chelates such as EDTA, which have been shown to enter plants (Vassil et al., 1998) and thus could affect Fe distribution and mobilization. However, adding FeSO4 only showed that there was indeed no advantage to adding FeSO4. The Fe content of the soil was low but high enough to allow non-Fe-limited growth. Iron concentrations in plant tissue fell within the adequate range (Reuter and Robinson, 1997) but were between five and ten times lower than field-grown wheat (Hocking, 1994; Miller et al., 1994), and possible reasons for this difference are discussed below.
Remobilization
Apart from the grain, the concentration of Fe in all plant organs dropped over time during grain filling, as expected, due to reproductive remobilization. This was evident in all tissues, but particularly in the peduncle, flag and rachis where there was up to a 10-fold reduction in the Fe concentration. This pattern was also evident with Cu in the control treatment but not to the same extent. Based on these results, both Fe and Cu would be described as phloem mobile. Both Fe and Cu have been described as intermediately mobile (Kochian, 1991; Marschner, 1995). Copper is generally considered phloem immobile unless it is linked to senescence whereupon it becomes mobile (Loneragan, 1981). Iron is thought to be more mobile than Cu and can be redistributed to seeds (Grusak, 1994), although, like Cu, Fe retranslocation can be assisted by senescence (Zhang et al., 1995).
The Fe distribution and remobilization patterns found were very different from those found with field-grown wheat. In two field studies, Fe appeared to be phloem immobile and there was no apparent reproductive mobilization with Fe concentrations being highest in dead tissue (Hocking, 1994; Miller et al., 1994). This pattern of little reproductive mobilization was also evident in field-grown rice (Marr et al., 1995). In the present results the tissue concentration, in the flag leaves for example, showed a drop in concentration of approx. 5-fold between anthesis and maturity. Iron concentration was reduced by a factor of approx. 2·5 between dead and live leaves. In the field-grown plants of Hocking (1994), the Fe concentration in the dead leaf tissue at anthesis was 2·3 times higher than live leaf tissue and only 5 % of the total Fe in the above-ground tissue was found in the grain. It is important to note that, although the non-grain tissues in the study of Hocking (1994) were much higher than in the present study (dead leaves 948 mg kg−1 vs. 20 mg kg−1), the grain concentrations were the same (26 mg kg−1). The differences between field-grown wheat and those in the present experiments appear similar to the comparison between wild-type peas and a hyper-accumulating mutant pea (Grusak, 1994). In the hyper-accumulating mutant, leaf levels were raised 35-fold with no increase in seed content.
There are a number of plausible reasons to explain the low Fe mobilization to the grain in the field-grown plants with high Fe levels. Firstly, the Fe levels may have been high enough to be toxic. The Fe levels in the leaves in the present study ranged from 55 µg g−1 d. wt in live leaves to 20 µg g−1 d. wt in dead leaves. In dead leaf blades in the study of Hocking (1994) the Fe concentration was as high as 948 µg g−1 d. wt. The dead leaves in the study of Miller et al. (1994) also had high (415 µg g−1 d. wt) Fe levels. These levels in wheat tissue have been classed as high (Reuter and Robinson, 1997) and 500 µg g−1 d. wt has lead to toxicity symptoms in rice (Yamauchi, 1989). Plants can buffer internal Fe using mechanisms such as ferritin (Briat and Lobreaux, 1997). However, the amount of Fe buffering capacity must be limited and, at high concentrations, Fe could be detoxified by precipitation in the apoplasm (Becker et al., 1995). It seems unlikely that internally precipitated Fe could be remobilized and this may lead to the apparent non-remobilization in the field-grown crops. The amount of Fe that is remobilized would be the Fe stored in normal physiological forms (active Fe), whilst that not remobilized would represent the precipitated Fe (inactive). Although this is feasible, is seems more likely to occur in flooded rice where Fe availability is higher than in wheat.
It could also be that the apparent lack of mobilization was related to saturation of either the grain loading or phloem loading process. Due to xylem discontinuity in the grain stalk (O'Brien et al., 1985) Fe transported into the wheat grain must do so via a phloem step. However, if it were the grain loading process that was saturating then it would be expected that there would still be a drop in concentration of the leaves and increases in Fe content of the non-grain floral structures which was not evident. Remobilization of Fe from the leaves is dependent upon it being loaded into the phloem. Phloem loading in the non-grain tissue may have been restricted by availability of endogenous chelates (Grusak, 1994).
Another reason for the distribution patterns of Fe in the field studies could be that soil was contaminating the plant tissue. It has long been known that contamination can lead to erroneously high Fe in leaf tissue analysis and that rinsing in detergent can reduce this contamination (Nicholas et al., 1957). Soil dust is high in Fe and only small amounts would lead to erroneously high Fe levels. It appears reasonable to assume that, especially nearing maturity, the field-grown plants under drying conditions at the beginning of summer would have been exposed to high amounts of dust. Both Hocking (1994) and Miller et al. (1994) washed leaves briefly in deionized water. It is unclear as to how much contaminant this process would have removed. If surface contaminant were left on the tissue then this would explain the high levels of Fe.
An observation that supports the contamination theory is the post-anthesis uptake of Fe by the aerial parts. In field-grown wheat the percentage of total plant Fe accumulated by anthesis was only 60 % (Hocking, 1994), whilst in the present study no further Fe was accumulated post-anthesis. With the continued uptake of Fe post-anthesis in the field-grown wheat there would be no need for remobilization from other tissue. However, once again it is possible that the continued increase in tissue Fe may be caused by dust contamination. Drying conditions at the end of the season would increase the likelihood of tissue Fe levels being increased by contamination.
The remobilization of Cu was minimal in the low-Cu treatment. The levels of Cu in the tissue were at or below the critical level for wheat (Robson et al., 1984). Their value of 1·3 µg g−1 is for the youngest expanded blades, which should be similar to the flag leaf at anthesis in the present study. It seems likely that the concentration in the tissue was so low that the Cu could not be remobilized at senescence. Loneragan (1981) suggested that perhaps this Cu is bound in a structural form that cannot be remobilized. As the Cu levels were low in all the tissues, including the grain, it would seem that the tissue had the minimum amount of Cu that was physiologically possible.
Compared with Zn and Mn
The behaviour or Fe and Cu in this case was different to that of Zn and Mn. The behaviour of Zn was closer to Fe and Cu in that it did show some remobilization but certainly not of the same magnitude of Fe and Cu. For both Zn and Mn most of the grain content at maturity can be accounted for by Mn and Zn entering the shoots after anthesis, whether this be from uptake new to the plant or remobilization from the roots. The high Mn levels in the leaves and florets and the floret Mn increasing throughout the harvests are symptomatic of transport of Mn to the endpoints of the xylem stream with no concurrent retranslocation in the phloem. The amount of shoot Mn and Zn contained in the grain at maturity (nutrient harvest index) was similar to that found in field-grown wheat by Zubaidi et al. (1999).
It is useful to compare the results for Mn and Zn with those found by Pearson and Rengel (1994). Their study was different from the present study in two major ways in that, firstly, the levels of Mn and Zn were lower and, secondly, in their study the roots were removed from soil at anthesis and transferred to solution culture containing no Mn and Zn. Pearson and Rengel found that zinc was remobilized from vegetative parts. They also found the stems contained considerable Zn at anthesis and this Zn was readily remobilized to the grain. This result, together with the present results, suggests that the stem is a store of Zn that can be utilized when Zn uptake from the roots is low and also that the stem is the main location of Zn loading into the phloem. The results for Mn are directly comparable and highlight the phloem immobility of Mn.
Conclusions
These results show that, in wheat plants, there can be good reproductive remobilization of Fe and Cu to the grain. When comparing the present results with field studies it appears that increased Fe availability in the soil does not increase its content in the grain. This implies that simply increasing Fe levels by increased root uptake capacity or foliar fertilization would not be an effective way of increasing grain levels of Fe. As the phloem transport pathway works then it is clear that breeding for better expression of the phloem pathway would be the best approach to improve the nutritional value of wheat grains and, by implication, other cereal grains. The characterization of the phloem transport pathways Fe in and Cu in wheat is the subject of further work.
Supplementary Material
Acknowledgments
We thank Waite Analytical Services (Teresa Fowles, Lyndon Palmer, Carolyn Smith and Irene Floyd) for their excellent elemental analysis of the plant material.
LITERATURE CITED
- Becker R, Fritz E, Manteuffel R. 1995. Subcellular localization and characterization of excessive iron in the nicotianamine-less tomato mutant Chloronerva. Plant Physiology 108: 269–275. [DOI] [PMC free article] [PubMed] [Google Scholar]
- Briat JF, Lobreaux S. 1997. Iron transport and storage in plants. Trends in Plant Science 2: 187–193. [Google Scholar]
- Graham RD, Pearce DT. 1979. The sensitivity of hexaploid and octoploid triticales and their parent species to copper deficiency. Australian Journal of Agricultural Research 30: 791–800. [Google Scholar]
- Graham RD, Welch RM. 1996. Breeding for staple food crops with high micronutrient density. In: Bouis HE, ed. Working papers on agricultural strategies for micronutrients. Washington: International Food Policy Research Institute, 1–72. [Google Scholar]
- Grusak MA. 1994. Iron transport to developing ovules of Pisum sativum 1. Seed import characteristics and phloem iron-loading capacity of source regions. Plant Physiology 104: 649–655. [DOI] [PMC free article] [PubMed] [Google Scholar]
- Grusak MA. 1995. Whole-root iron(III)-reductase activity throughout the life cycle of iron-grown Pisum sativum L (Fabaceae)—relevance to the iron nutrition of developing seeds. Planta 197: 111–117. [Google Scholar]
- Hill J, Robson AD, Loneragan JF. 1978. The effect of copper and nitrogen supply on the retranslocation of copper in four cultivars of wheat. Australian Journal of Agricultural Research 29: 925–939. [Google Scholar]
- Hill J, Robson AD, Loneragan JF. 1979. The effect of copper and nitrogen supply on the distribution of copper in dissected wheat grain. Australian Journal of Agricultural Research 30: 233–237. [Google Scholar]
- Hill J, Robson AD, Loneragan JF. 1979. The effect of copper supply on the senescence and the retranslocation of nutrients from the oldest leaf of wheat. Annals of Botany 44: 279–287. [Google Scholar]
- Hill J, Robson AD, Loneragan JF. 1979. The effects of Cu supply and shading on retranslocation from old wheat leaves. Annals of Botany 43: 449–457. [Google Scholar]
- Hocking PJ. 1994. Dry-matter production, mineral nutrient concentrations, and nutrient distribution and redistribution in irrigated spring wheat. Journal of Plant Nutrition 17: 1289–1308. [Google Scholar]
- Kochian LV. 1991. Mechanisms of micronutrient uptake and translocation in plants. In: Mortvedt JJ, Cox FR, Shuman LM, Welch RM, eds. Micronutrients in agriculture. Madison: Soil Science Society of America, 229–296. [Google Scholar]
- Loneragan JF. 1981. Distribution and movement of copper in plants. In: Loneragan JF, Robson AD, Graham RD, eds. Copper in soils and plants. Sydney: Academic Press, 165–188. [Google Scholar]
- Marr KM, Batten GD, Blakeney AB. 1995. Relationships between minerals in Australian brown rice. Journal of the Science of Food and Agriculture 68: 285–291. [Google Scholar]
- Marschner H. 1995.Mineral nutrition of higher plants, 2nd edn. London: Academic Press. [Google Scholar]
- Miller RO, Jacobsen JS, Skogley EO. 1994. Aerial accumulation and partitioning of nutrients by hard red spring wheat. Communications in Soil Science and Plant Analysis 25: 1891–1911. [Google Scholar]
- Nicholas DJD, Lloyd-Jones CP, Fisher DJ. 1957. Some problems associated with determining iron in plants. Plant and Soil 8: 367–377. [Google Scholar]
- O'Brien TP, Sammut ME, Lee JW, Smart MG. 1985. The vascular system of the wheat spikelet. Australian Journal of Plant Physiology 12: 487–512. [Google Scholar]
- Pearson JN, Rengel Z. 1994. Distribution and remobilization of Zn and Mn during grain development in wheat. Journal of Experimental Botany 45: 1829–1835. [Google Scholar]
- Reuter DJ, Robinson JB. 1997.Plant analysis: an interpretation manual, 2nd edn. Melbourne: CSIRO Publishing. [Google Scholar]
- Robson AD, Loneragan JF, Gartrell JW, Snowball K. 1984. Diagnosis of copper deficiency in wheat (Triticum aestivum cultivar Gamenya) by plant analysis. Australian Journal of Agricultural Research 35: 347–358. [Google Scholar]
- Thongbai P, Graham RD, Neate MJ, Webb MJ. 1993. Interaction between zinc nutritional status of cereals and Rhizoctonia root rot severity. II. Effect of Zn on disease severity of wheat under controlled conditions. Plant and Soil 153: 215–222. [Google Scholar]
- Vassil AD, Kapulnik Y, Raskin I, Salt DE. 1998. The role of EDTA in lead transport and accumulation by Indian mustard. Plant Physiology 117: 447–453. [DOI] [PMC free article] [PubMed] [Google Scholar]
- Yamauchi M. 1989. Rice bronzing in Nigeria caused by nutrient imbalances and its control by potassium sulfate application. Plant and Soil 117: 275–286. [Google Scholar]
- Zarcinas BA, Cartwright B, Spouncer LR. 1987. Nitric acid digestion and multi-element analysis of plant material by inductively coupled plasma spectrometry. Communications in Soil Science and Plant Analysis 18: 131–146. [Google Scholar]
- Zubaidi A, McDonald GK, Hollamby GJ. 1999. Nutrient uptake and distribution by bread and durum wheat under drought conditions in South Australia. Australian Journal of Experimental Agriculture 39: 721–732. [Google Scholar]
- Zhang CD, Romheld V, Marschner H. 1995. Retranslocation of iron from primary leaves of bean plants grown under iron deficiency. Journal of Plant Physiology 146: 268–272. [Google Scholar]
Associated Data
This section collects any data citations, data availability statements, or supplementary materials included in this article.


