Abstract
• Background and Aims Despite its high capacity to take up nitrate from the soil, winter oilseed rape (Brassica napus) is characterized by a very low N recovery in the reproductive tissues under field conditions. A significant part of the N taken up is lost to the soil in dead leaves during the growth cycle. An accurate description of N dynamics at the whole plant level in each compartment under field conditions should lead to a better understanding of N allocation in B. napus and improvements in the nitrogen harvest index.
• Methods An experiment was conducted in field conditions using sequential weekly 15N labelling to follow N uptake, partitioning and mobilization. Nitrogen labelling (2·5 kg N ha−1; 10 % excess) was analysed weekly (from stem extension to harvest) to distinguish between uptake of new N (labelled) and mobilized N (unlabelled) in the different plant components.
• Key Results and Conclusions N requirements for seed filling were satisfied mainly by N mobilized from vegetative parts (about 73 % of the total N in pods). Determination of the endogenous N flow showed that there was net transfer of N to the pods by leaves (36 %), stem (34 %), inflorescences (22 %) and taproot (8 %). Precise study of N flow from leaves at different nodes revealed the existence of two main groups of leaves in terms of their apparent capacity to mobilize N; 30–60 % and 70–80 % of peak N content occurring during flowering and pod filling, respectively. Moreover, the latter group was found to be the main source of endogenous N from leaves. The mobilization of endogenous N from these leaves was prolonged and concomitant with N accumulation in the pods. A complex pattern of N mobilization from the leaves, to vegetative or reproductive tissues, was revealed. These results will be used to model N partitioning during the growth cycle.
Keywords: Brassica napus, leaf nodes, 15N labelling, dynamics, uptake, partitioning, mobilization
INTRODUCTION
Winter oilseed rape (Brassica napus) is an important agricultural crop cultivated for its oil, which can be used as an edible product or for industrial application. As reported by Diepenbrock (2000), oilseed crops have been of great interest in Europe for economic reasons for several years. Winter oilseed rape can be used as a catch crop to reduce N leaching during the autumn–winter period because of its high capacity to take up nitrate from the soil. Lainé et al. (1993) reported that the peak rate of nitrate uptake is higher in brassicas than in many other catch crop plants (e.g. members of the Poaceae and Legumineae). Other work on oilseed rape grown hydroponically or in field conditions showed that  uptake increased from stem extension to the start of the flowering, whereas little
  uptake was observed during pod filling (Merrien et al., 1988; Jensen et al., 1997; Rossato et al., 2001). Consequently, N supply to the pods was achieved mainly by N mobilization from vegetative parts (stem, leaves, taproot), whatever the soil
  concentration after flowering. However, the relative contributions of N uptake and internal cycling have been measured by 15N labelling only in plants grown in hydroponic conditions and the extent of mobilization to the reproductive tissues still needs to be determined in field-grown plants.
Despite the very high capacity of oilseed rape to take up  , many authors have reported a very low recovery of nitrogen in field-grown crops, calculated as the ratio of plant N content to the nitrogen supplied, which does not exceed 50–60 % whatever the level of N fertilizer applied (Augustinussen, 1987; Smith et al., 1989; Schjoerring et al., 1995; Hocking et al., 1997; Jensen et al., 1997; Leleu et al., 2000; Chamorro et al., 2002). A significant proportion of the N taken up is released to the soil in leaf litter during the growth cycle, particularly during the winter when temperature and light intensity are low (Diepenbrock, 1981; Colnenne et al., 1998; Dejoux, 1999). The total N content of leaves lost before pod filling (2–2·5 % of dry weight; Triboï-Blondel, 1988; Rossato et al., 2001) is high, suggesting that the vegetative parts (leaves, stem, taproot) are not effective in mobilizing N to the pods during the reproductive period. Lack of synchrony between the start of N leaf mobilization, induced by early senescence, and development of the pods may be responsible for the low levels of mobilization and the high levels of N in abscissed leaves (Diepenbrock, 2000; Rossato et al., 2001). Using 15N labelling, Rossato et al. (2001) identified tissues (stem, taproot) where transient storage of N occurred. They proposed that these buffer organs might increase the N sink strength of the whole plant during floral transition and store the N released by leaves. A study of N flows at different nodes demonstrated that leaves emerging during autumn and winter had a shorter life duration than those emerging during spring (Triboï-Blondel, 1988). This indicated a variation in the pattern of leaf abscission during the growth cycle, and the early senescence of ‘autumn and winter’ leaves, even though the leaf N content remained nearly constant at 2 %. Triboï-Blondel (1988) recorded different patterns of leaf life span but, apart from a self-shading effect, no mechanism has been proposed at either the plant or organ level.
Appropriate N fertilization, combined with genetic improvement of the N harvest index, are the most readily available tools to improve the yield of this crop, while minimizing N loss to the environment. However, a better understanding of N uptake, N partitioning and the contribution of these key physiological processes to biomass and yield formation is a prerequisite for genetic improvement. N uptake by oilseed rape has been modelled satisfactorily using field data and a kinetic description, under controlled conditions, of nitrate transporter activity, controlled by local nitrate availability to the roots, temperature, light availability within the canopy and plant ontogeny (Malagoli et al., 2004). By contrast, data on the allocation pattern of N taken up within the plant remain relatively scarce, and the complexity of these processes results from the fact that many tissues are involved, with different allocation priorities or mobilization capacities. For example, it is not known (a) how leaves at a given insertion behave in terms of dependence on newly absorbed N and its subsequent allocation or on N remobilized from other tissues and (b) how these processes are affected by the position of the leaf within the canopy (insertion in the source/sink network) as well as the resulting environment (light and temperature).
Therefore, the aim of this study was to investigate the dynamics of N uptake and N partitioning in a winter oilseed rape crop from stem extension to harvest by applying 15N sequentially, at weekly intervals, under field conditions, and following the translocation of N derived from root uptake or mobilization from vegetative parts to various organs. The present paper investigates N flows between tissues in order to describe sink/source transitions and the main characteristics of the leaves at different nodes (range of N content, extent and duration of mobilization, life span). A model of N flows, providing the parameters subsequently used to test different approaches to increasing the N harvest index, is described in a companion paper. The ultimate objective of this work is to obtain sufficient knowledge to determine the relative importance of environmental and genetic factors determining these processes, thereby providing the necessary background for genetic improvement of oilseed rape varieties.
MATERIALS AND METHODS
Crop culture
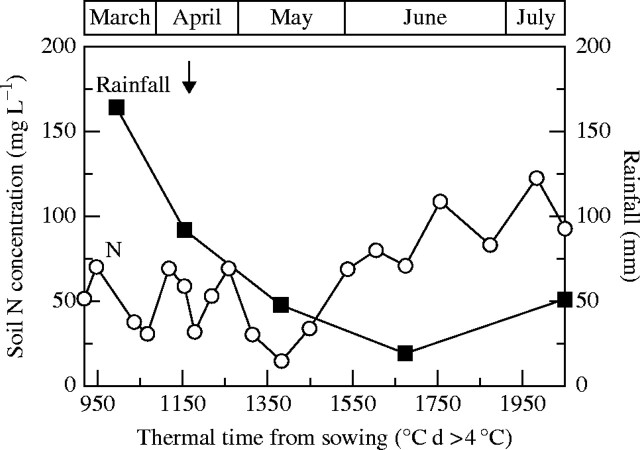
A winter oilseed rape crop (Brassica napus L. ‘Capitol’) was sown on a clay loam soil on 10 September 2000 at Hérouvillette, 10 km north of Caen (49°10′N, 00°27′W), France. Nitrogen fertilizer was applied as NH4NO3 at the start of stem extension [growth stage (GS) 2·5; 75 kg N ha−1] and at the bud visible stage (GS 3·3; 150 kg N ha−1). Monthly rainfall, soil N content and date of N fertilizer application are shown in Fig. 1. Soil N was in excess and water stress was not observed during the experimental period due to regular rainfall during spring. Plant density was 37–40 plants m−2 during the experiment (from stem extension to harvest).
Fig. 1.
Monthly rainfall (squares), soil  concentrations (circles) and date of N fertilization (vertical arrow; 150 kg N ha−1) of Brassica napus plots at Hérouvillette (2000) from stem extension to harvest plotted against thermal time (°C d >4 °C) from sowing.
Experimental treatment, labelling and harvest
The 15N labelling experiment was performed from stem extension (at the beginning of March) to seed maturity (at the beginning of July). Seven days before each weekly harvest date, 12 plants at the same developmental stage were randomly selected within the canopy. The petiole of each senescing leaf was attached to the stem by a nylon thread to facilitate collection of the abscissed leaves. Then, 750 mL of labelled nitrogen (1 mm K15NO3, 15N excess = 10 %) was applied to the soil surface (about 400 cm2) around each plant. Seven days after 15N labelling, the plants were harvested and the root system in the top 30-cm layer of the soil was recovered carefully. The 12 plants were pooled in three sets of four plants. At each harvest, the plants were separated into lateral roots, taproot, green and dead leaves, stem, flowers and pods. However, because of the difficulty in recovering lateral roots quantitatively under field conditions, this component was omitted from further analysis. The green leaves were numbered then sampled individually as a function of their insertion along the stem, measured by counting leaf scars.
Chemical analysis and calculation of N flows
The plant fractions at each harvest were weighed, lyophilized, weighed again for dry matter determination and then ground to a fine powder for isotopic analysis. The total N and 15N in the plant samples were determined with a continuous flow isotope mass spectrometer (Twenty-twenty, PDZ Europa Scientific Ltd, Crewe, UK) linked to a C/N analyser (Roboprep C/N, PDZ Europa Scientific Ltd).
Dry weights and N contents of each tissue were subjected to polynomial regression (r2 ≥ 0·90) to minimize variation between each harvest date, and N uptake was estimated from the difference in plant N content between two harvest times. The partitioning of absorbed N was calculated from the excess 15N in each tissue combined with the previously calculated total plant N uptake. Based on the assumption that unlabelled N from the soil was taken up and allocated in different plant tissues in a similar way to labelled N, then the real N uptake by each tissue could be calculated as:
 |
where Nd is the total nitrogen content of the plant (mg per plant) at day d when 15N fertilizer was applied, and Nd+7 is the total nitrogen content in the plant (mg per plant) at time d + 7 days after 15N fertilizer was applied.
After calculating the N in each organ derived from uptake, the pattern of net translocation of endogenous unlabelled N (N absorbed before the beginning of labelling) among plant parts could be used to estimate N mobilization within the plant. At each harvest, the amount of N mobilized from or to each tissue (Nmob) was calculated by subtracting the total amount of N (Nd+7) from (a) the N derived from uptake (N uptake) and (b) the previous amount of N in this tissue 7 d before (Nd):
 |
Thus positive values of Nmob represent nitrogen that was mobilized to the tissue, whereas negative values correspond to a net mobilization of N from the tissue. For each leaf insertion, the following values were calculated: (a) the cumulative amounts both of N derived from N taken up, and endogenous N mobilized from source tissues; (b) percentage of mobilization of N = (Nmax − Nmin) × 100/Nmax, where Nmax and Nmin correspond to the highest and lowest values of total nitrogen (mg per plant), respectively; (c) dates of appearance, loss or abscission and start of mobilization of endogenous N (calculated when N mobilization reached negative values) expressed in thermal time (°C d >4 °C).
Statistical analysis
All experiments were performed with three sets of four plants. The resulting variation in the measurements was expressed as the mean ± s.d. for n = 3.
RESULTS
Dry matter production
The experiment conducted under field conditions showed that plant growth was positive and continuous throughout the growth cycle (Fig. 2A). From stem extension (GS 2·5) to visible bud stage (GS 3·3), green leaves and stem constituted the greatest proportion (about 80 %) of the plant dry matter. This was followed by a rapid increase in stem biomass (from 5 to 29 g d. wt per plant) from the appearance of buds (GS 3·6) to the start of pod filling (GS 6·1). This increase can be explained by the growth of branches on the principal stem during flowering. Despite an increase in the dry weight of dead leaves, photosynthetic leaf biomass varied little during this period (GS 3·6 to GS 6·1) because leaf drop was compensated for by the appearance of new photosynthetic leaves. At mid-flowering, the dry matter of flowers reached a maximum value of 3·4 g d. wt per plant then decreased as the pods formed. Taproot and pod dry weights increased until harvest, whereas stem and photosynthetic leaf dry weights reached a maximum at the start of pod filling (GS 6·1; 29 and 8 g per plant, respectively). All the leaves abscissed before the end of seed maturity. At harvest, pods represented the major part of the dry matter (60 %).
Fig. 2.
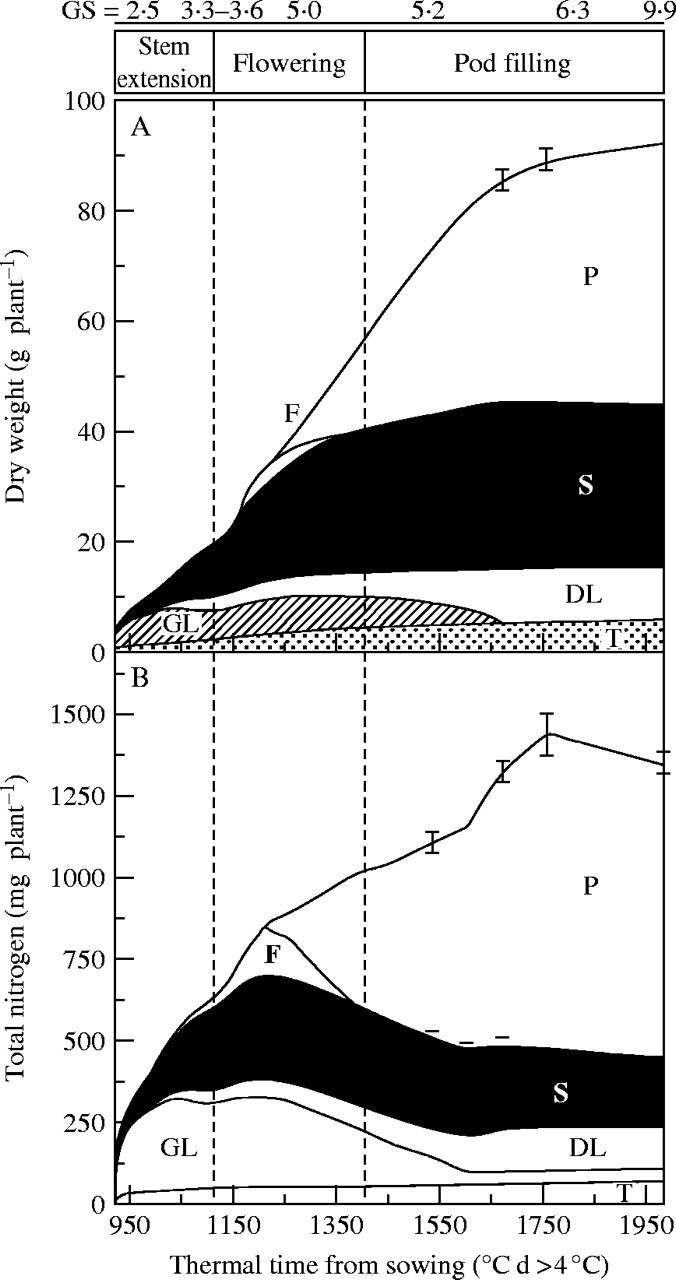
Thermal time courses of biomass (A) and total nitrogen (B) in Brassica napus ‘Capitol’ plants, and their components: taproot (T), green leaves (GL), dead leaves (DL), stem (S), flowers (F) and pods (P). Vertical bars indicate ± s.d. for n = 3 when larger than the symbol.
Total N accumulation/mobilization
At the start of stem extension (GS 2·5), leaves represented the major sink for N (Fig. 2B) (from 922 to 1067 °C d). Total nitrogen in leaves reached a plateau at 329 mg N, whereas N allocated to stem increased dramatically until mid-flowering, attaining a peak value of 310 mg per plant. Before the start of pod filling, N was mainly shared between leaves, stem and flowers, which constituted 35, 35 and 15 % of total N in the plant, respectively. N mobilization from N sources (leaves, stem, and flowers) occurred at the same time as the development and filling of pods. On average, 66 % of leaf N was mobilized, whereas only up to 30 % of stem N was mobilized. Finally, total N uptake reached a plateau late, in this field experiment, at 1673 °C d (Fig. 2B), reflecting a high level of N availability in the soil, without any water deficiency (Fig. 1).
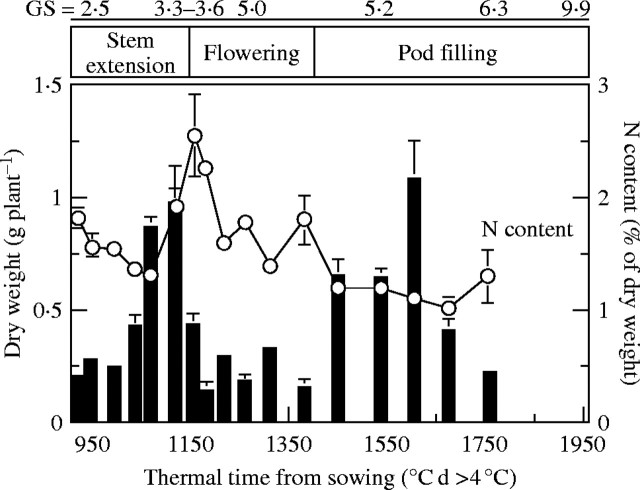
Dry matter and total N content of dead leaves
The sampling procedure used at each harvest enabled the dry matter and N content patterns in abscissed leaves to be monitored accurately under field conditions. The dry matter pattern was marked by two peaks of leaf abscission (Fig. 3). The first occurred at the end of stem extension (GS 3·3–3·6) and was characterized by high values of total N content (mean 2–2·5 %). As the total N content of abscissed leaves decreased during flowering and pod filling, the second peak, during pod filling, was characterized by ‘low’ N content (reaching 1 % at GS 6·3). N loss by leaf loss throughout the experiment (from stem extension to harvest) amounted to 45 kg N ha−1, representing 11·60 % of the total N content taken up by the plant from stem extension to harvest.
Fig. 3.
Biomass (filled columns) and total N content (circles) pattern of abscissed leaves from stem extension to harvest in Brassica napus ‘Capitol’. Vertical bars indicate ± s.d. for n = 3 when larger than the symbol.
Partitioning of N taken up
By labelling with 15N each week, it was possible to quantify cumulative N uptake by, and allocation to, each plant part (Fig. 4). The amount of 15N increased in green leaves, stem, taproots and flowers up to the end of flowering (GS 5·0). Whereas N uptake and further allocation (Fig. 4) to taproot and flowers reflect growth, relative mass and N content as indicated in Fig. 2, the green leaf compartment showed a continued increase in N allocation up to the end of flowering, whereas its biomass remained at an almost steady state from 949 to 1382 °C d (Fig. 2B) probably reflecting a high N turnover in green leaves and a high re-export of N. This was also true for the stem after flowering, with a continuous increase in allocation of N derived from uptake (Fig. 4), while the biomass remained constant (Fig. 2B). From GS 6·1 onwards, the pods became the main organs to which 15N taken up was allocated while no significant increase was observed in green leaves, although 15N continued to accumulate in stem and taproot until 1673 °C d.
Fig. 4.
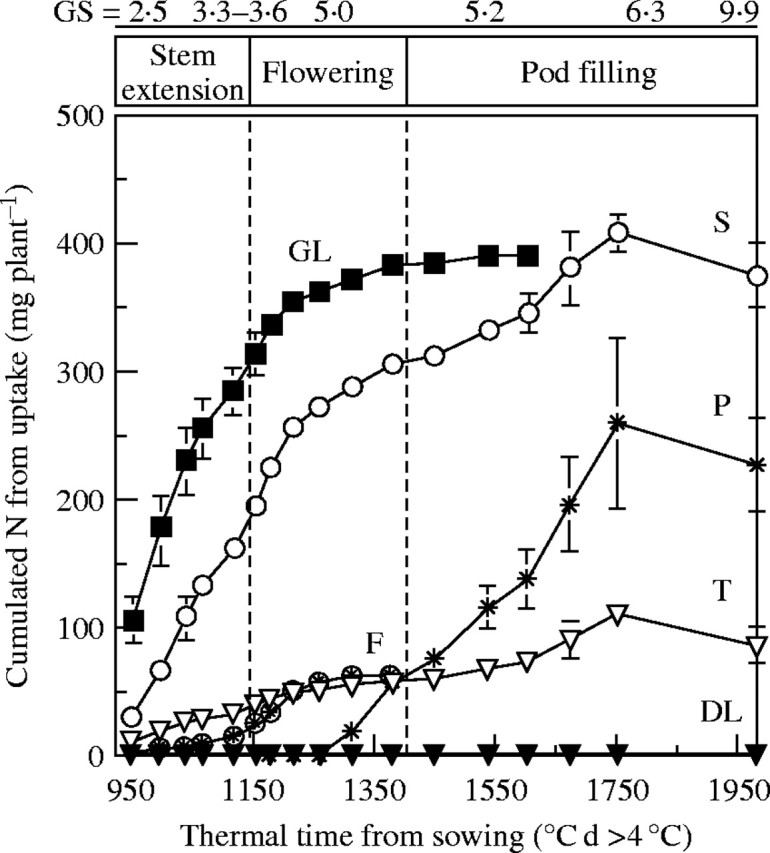
Cumulative N uptake, estimated by 15N labelling, into Brassica napus ‘Capitol’ plants, and their components: taproot (T), green leaves (GL), dead leaves (DL), stem (S), flowers (F) and pods (P). Vertical bars indicate ± s.d. for n = 3 when larger than the symbol.
The flow of labelled N into each organ (expressed in µg N (°C d)−1 plant−1), i.e. the slopes of the straight lines joining successive points on the cumulative N uptake curves for each organ, was calculated to determine the rate of 15N allocation associated with each compartment. The organs could be classed, from the start of stem extension (GS 2·5) to the start of pod filling (GS 6·1), as a function of their decreasing sink strength, i.e. leaves, stem, taproot and flowers. The 15N amount allocated to the stem was relatively constant (879 ± 22 µg N (°C d)−1 plant−1). In contrast, the sink strength of leaves and flowers varied during stem extension and flowering. From GS 3·3–3·6 to GS 6·1, the amount of 15N allocated to green leaves decreased (from 2000 ± 225 during GS 2·5–3·3 to 688 ± 115 μgN (°C d)−1 plant−1 during GS 3·3 to GS 6·1) and increased in flowers (from 68 ± 7·2 during GS 2·5–3·3 to 282 ± 16·6 μgN (°C d)−1 plant−1 during GS 3·3–6·1), reflecting a change in 15N allocation, to the benefit of the new growing sinks. During pod filling (from GS 6·1 to GS 9·9), N uptake was maintained at a significant level (30 % of the total N taken up by the crop). Consequently, pods became the main sink for 15N (Fig. 4).
Partitioning of mobilized N
All the previous data taken together were used to determine net internal N transfers before and during pod filling (Fig. 5). An overview of source–sink relationships for N was obtained by summing the endogenous N influx (positive values of N mobilized) and efflux (negative value of N mobilized) for each tissue, so that a sink organ for N had an increasing cumulative N flow, whereas a source organ had a decreasing cumulative endogenous N flow. Figure 5 illustrates the transition from sink to source behaviour of a tissue when the highest cumulative flow from mobilization was reached and fell thereafter. This demonstrates that the leaves and, to a lesser extent, the taproot, were permanent sources of endogenous N during the studied period. From the start of stem extension (GS 2·5) to the visible buds stage (GS 3·3), endogenous N coming from leaves and taproot was mainly allocated to the stem (86 %) and later to the inflorescences (14 %), although a portion remained in dead leaves. The status of stem changed from sink to source during floral transition at 1067 °C d. During the flowering period (from GS 3·6 to GS 5·0), flowers became the sole sink for endogenous N, supplied by the leaves (57 %), the stem (38 %) and the taproot (5 %), before converting to a source at 1218 °C d. During pod filling, all vegetative tissues behaved as sources for endogenous N. Indeed, of 690 mg of endogenous N mobilized to the pods, 36, 34, 22 and 8 % were mobilized from leaves, stems, inflorescences and taproot, respectively.
Fig. 5.
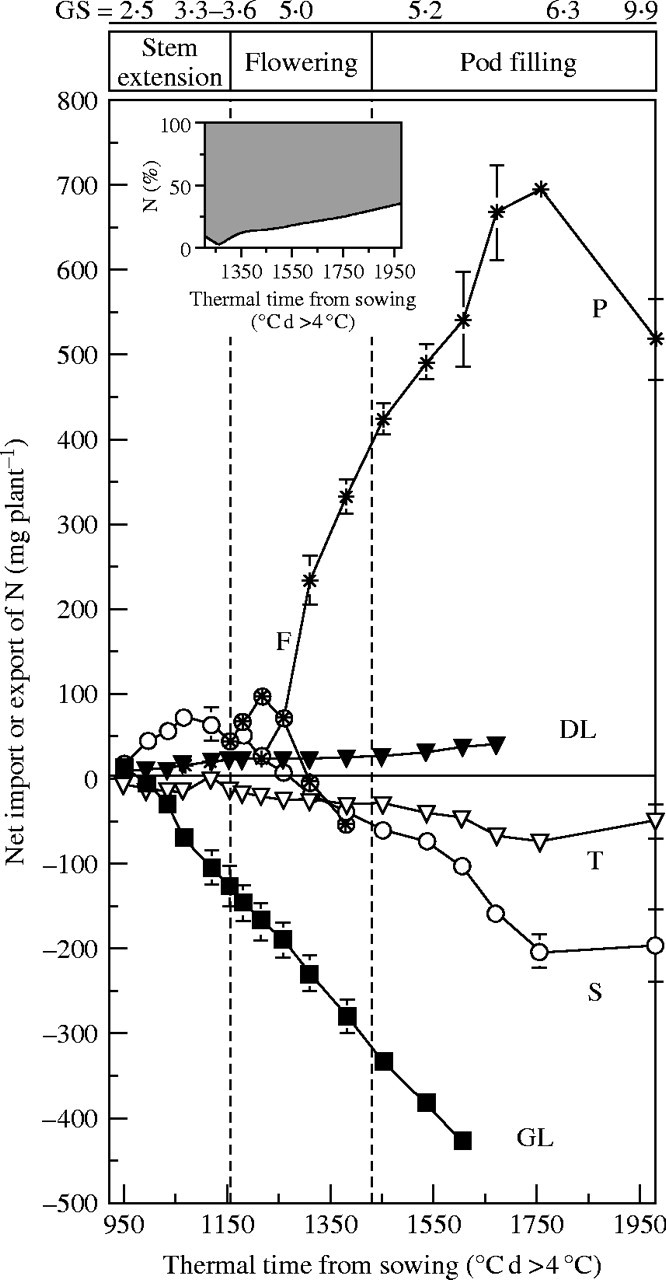
Net import or export of N in different Brassica napus ‘Capitol’ plant components: taproot (T), green leaves (GL), dead leaves (DL), stem (S), flowers (F) and pods (P). Vertical bars indicate ± s.d. for n = 3 when larger than the symbol. Inset represents the proportion of N in pods derived from current uptake (open area) and from mobilization (shaded area) participating in N pod filling.
The contributions of labelled and unlabelled N flows to each tissue were determined. Exogenous N derived from concurrent uptake was the only source of N for a source tissue, whereas a sink organ could gain N from concurrent uptake as well as from mobilization of N from source tissues. Endogenous N represented 35, 64 and 73 % of the total N allocated to the stem, flowers and pods (inset in Fig. 5), respectively. Leaves were the most important source organs for endogenous N mobilization throughout the experiment, although contributions from stem and taproot increased between GS 6·2 and GS 6·3.
Mobilization of endogenous N occurred mainly during pod filling. Overall, only 18, 34 and 35 % of mobilization of endogenous N from stem, taproot and leaves, respectively, occurred before pod filling. During pod filling, the rate of mobilization of endogenous N from the stem (2·7-fold) and taproot (2·5-fold) increased strongly, and from the leaves to a lesser extent (1·4-fold). Comparison of data for pods in Figs 4 and 5 shows that 73 % of N in these reproductive tissues was derived from internal recycling (inset in Fig. 5), even though it would have been predicted that the favourable soil nitrogen relations should have reduced the need for internal recycling.
Variations in N dynamics with leaf insertion within the canopy
Because of the large number of main stem nodes (26), only data relevant to N content will be described. Data on N content, dates of appearance, abscission and start of endogenous N mobilization and N flows, presented in Figs 6–8, provide an overview of the behaviour of leaves at each node. Leaves already in place at the beginning of the experiment (nodes 11–21) were characterized by high values of N content (lowest values for nodes 11–21 varying from 2·5 and 3·5 %; Fig. 6A) and a wide range of N mobilization ranging from 30 to 60 % (except for node 11; Fig. 6B). The start of N mobilization from the younger leaves (nodes 22–36) was synchronous with flowering and the subsequent development of strong sinks for N such as flowers and pods (Fig. 7). The total N content patterns of leaves at these nodes were marked by a constant residual N content of around 2 % (Fig. 6A). However, for nodes 22–27, this resulted from high values of total N mobilization (70 %; Fig. 6B) with a high peak N content (above 7 % of d. wt; Fig. 6A), whereas, for nodes 33–36, for example, it was the result of a lower peak N content (about 6 % of d. wt; Fig. 6A), combined with a lower mobilization (lower than 60 %; Fig. 6B).
Fig. 6.
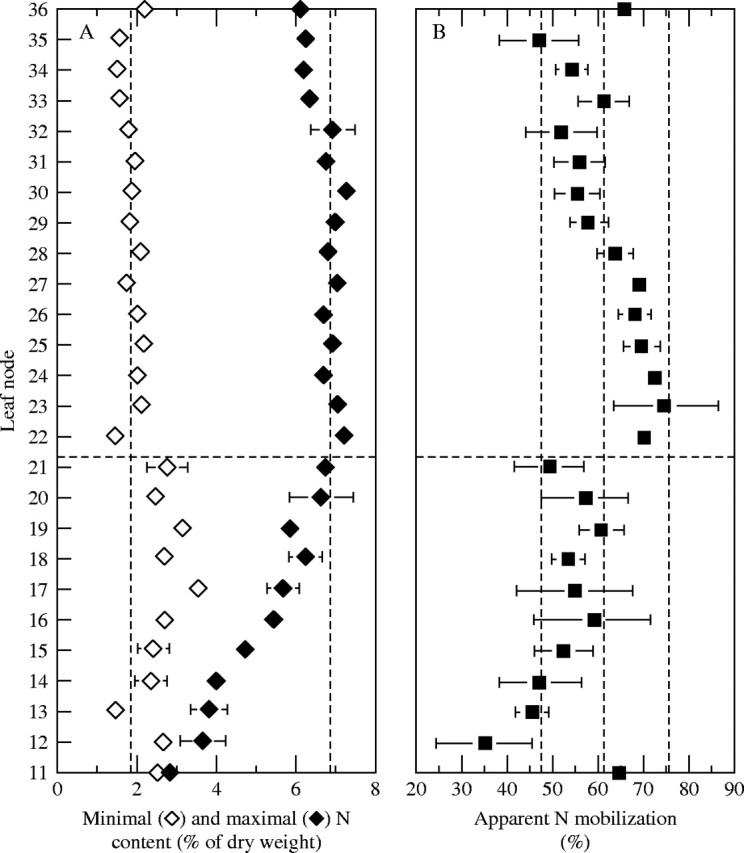
Changes in the distribution of lowest and highest N contents (A) and of the extent of N mobilization (B) in the different leaves from the bottom (node 11) to the top (node 36) of the canopy in Brassica napus ‘Capitol’. Vertical bars indicate ± s.d. for n = 3 when larger than the symbol.
Fig. 7.
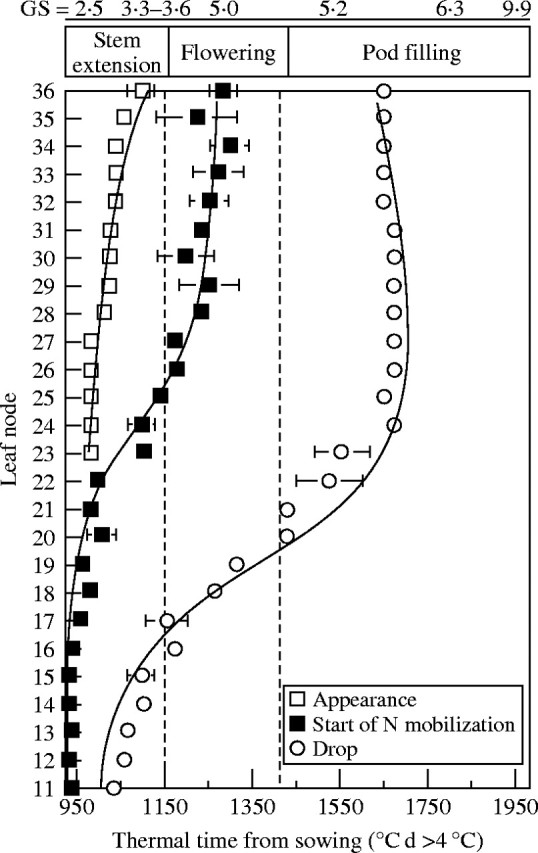
Dates of appearance (open squares), loss (open circles) and start of endogenous N mobilization (filled squares) of the leaves at different nodes in Brassica napus ‘Capitol’, calculated from the start of 14N efflux.
Fig. 8.
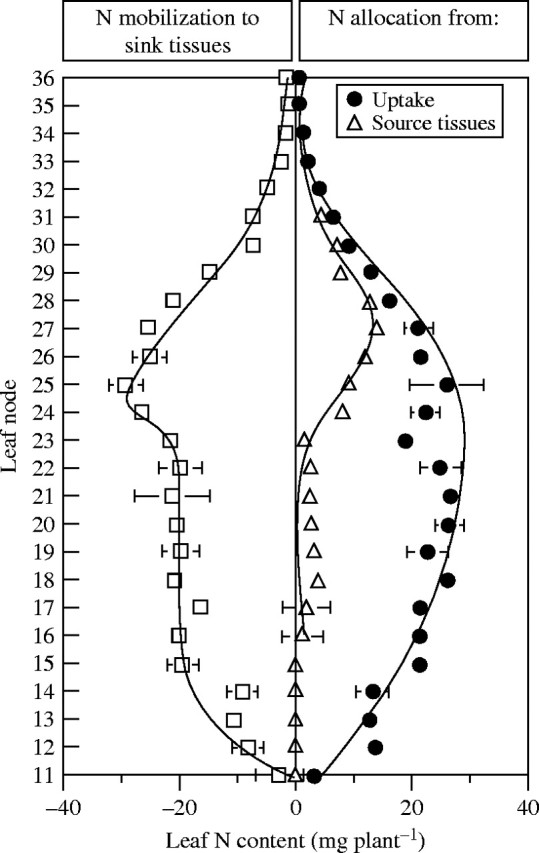
Partitioning of leaf N content (mg plant−1) at each leaf insertion (nodes 11–36) into that derived from uptake of exogenous N (filled circles), and mobilized N from source tissues (open triangles), contributing to the N accumulation and flows of N mobilized through internal N cycling during N mobilization (open squares; negative values) to sink tissues. Vertical bars indicate ± s.d. for n = 3 when larger than the symbol.
The duration of mobilization of endogenous N (Fig. 7; °C d between the start of N mobilization and leaf loss) increased from node 16 (about 230 °C d) to node 22 (about 530 °C d) and this may be related to the onset of flowering and the start of pod filling (Fig. 7). Thereafter, the duration of mobilization decreased progressively from node 26 (495 °C d) to node 36 (370 °C d). Leaf life spans (°C d between leaf appearance and loss; Fig. 7) for nodes 23–36 were relatively constant: 638 ± 10·1 °C d.
Before the appearance of flowers and pods, endogenous N mobilized from the leaves at the bottom of the canopy was mainly allocated to the stem and to the growing upper leaves (Fig. 7; i.e. mobilization from and to vegetative tissue). Indeed, endogenous N coming from these vegetative parts made a significant contribution (from 10 to 50 %) to the supply of N to leaves at nodes 24 to 36 (Fig. 8). It is interesting to note that N allocation to leaves at nodes 11–22 was strictly (nodes 11–15) or mainly (nodes 16–22) derived from N coming from uptake (Fig. 8). The duration of N mobilization from leaves at nodes 23–28 was 1·5–3-fold higher than in lower leaves (nodes 11–22). The contribution of younger leaves (nodes 30–36) remained low, mainly due to their low biomass and, therefore, their low N content (Fig. 8). It follows that when N was taken up early in the growing cycle, it was probably re-used several times by different leaves before being finally remobilized, at least in part, to the reproductive tissues.
DISCUSSION
This 15N labelling experiment, undertaken in field conditions, was designed to follow the seasonal course of current N uptake by, and N allocation to, different plant components focusing on leaf insertion within the canopy. Under the experimental conditions (sowing date 10 September), leaves at 36 leaf nodes were recorded. Nanda et al. (1995) and Tittonel et al. (1988) found 26 and 37 leaf nodes for a later (19 October) or equivalent sowing date (5 September). As the number of leaf nodes in this experiment was within this range, it can be considered that the numbering technique and chosen sampling procedure were appropriate.
Nitrogen uptake remained high after the start of pod filling (GS 6·1), in contrast to previous reports (Gabrielle et al., 1998; Rossato et al., 2001; Malagoli et al., 2004). Despite a drastic reduction in N uptake at the GS 6·3 stage, 30 % of total N was taken up during pod filling (Fig. 2). Hocking et al. (1997) found that 33 and 11 % of N was accumulated in canola (Brassica napus) during and after flowering, respectively. Schjoerring et al. (1995) reported that shoot N content can increase after flowering, particularly with sub-optimal N supplies if N availability during vegetative growth has been limited by water deficiency. Soil N was plentiful during this experiment and it is assumed that water supply was not limiting (Fig. 1); these factors may explain the maintenance of N uptake after flowering (Fig. 2B).
Allocation of the N taken up paralleled the appearance and growth of the shoot components during the study. N taken up was preferentially partitioned to leaves and stem during stem extension and flowering (Fig. 4). Lower leaves senescenced before the onset of flowering and pod formation (Fig. 7), and the N mobilized from these leaves was allocated mainly to the stem and leaves at the top of the canopy (nodes 24–36; Fig. 8). These results are similar to those found in pigeonpea (Cajanus cajan) by Sanetra et al. (1998), who suggested that the decrease in total N content in leaves at the bottom of the canopy before the beginning of seed development, together with the lower N concentration of abscissed leaves, indicated the redistribution of N to sink organs other than the seed, i.e. the top leaf layers. It can thus be suggested that the absence of a strong N sink tissue during stem extension may explain this preferential allocation pattern. Moreover, it is well established that N distribution parallels the attenuation of light within the canopy during the vegetative period, i.e. N is partitioned from shaded to non-shaded leaves to optimize photosynthesis (lucerne: Lemaire et al., 1991; maize: Lemaire and Gastal, 1997). The progressive mobilization of N from the bottom leaves and stem to middle and top leaves, ranging from 9 to 50 % (Fig. 8), corroborated results obtained by Schjoerring et al. (1995) in Brassica napus. They observed a decreasing contribution of labelled 15N (fertilizer-derived N) to the total N content when the leaves were located at the top of the canopy. It can be also proposed that these upper leaves, as well as the stem, can act as buffer organs.
The present study showed that lower leaves (nodes 11–21, Fig. 6A) had high N contents (2·5–3·5 %) when they abscissed during stem extension, indicating that a significant proportion of leaf N was not mobilized before abscission, as shown by Schjoerring et al. (1995), Hocking et al. (1997) and Dreccer et al. (2000) in Brassica napus. Indeed, leaves at the lower nodes were characterized by lower values of total N mobilization ranging from 30 to 60 % compared with a mean of 70 % for leaves at nodes 22–27 (Fig. 6B). The more complete mobilization in the latter leaves may be linked to development of the reproductive organs, providing strong sinks for N. However, many factors such as the leaf duration, the canopy structure or the N uptake could also affect the extent of mobilization.
Leaf duration
The duration, over which N mobilization occurred (Fig. 7), suggests that the N mobilization from leaves is source- rather than sink-limited, as already suggested by Schjoerring et al. (1995) and Dreccer et al. (2000). This short duration of mobilization in early leaves could be the result of an environmental factor such as the extinction of light penetration within the canopy. Leaf abscission occurred when the leaf area index (LAI) reached about 4 (data not shown) during stem extension. Habekotté (1997) showed by simulation that a crop with an LAI of about 3 could increase yield by limiting the self-shading of leaves and therefore improve the penetration and interception of light. Otherwise, this LAI value is commonly accepted to correspond to the optimal LAI able to capture 90 % of incoming PAR (Lawlor, 2002). Thus, self-shading by middle and top leaf insertions may have induced the observed early leaf senescence and the rapid abscission of lower leaves before their N content reached a minimal value.
From flowering to harvest, although N uptake rate was maintained at a positive level (Fig. 2B) and 30 % of the N taken up was allocated to pods, it represented only 27 % of the final pod N content. Nitrogen taken up was also partitioned to the stem and, to a lesser extent, to the taproot. This sink strength for N taken up may be partially explained by the biomass increase of the taproot and stem (Fig. 2A), resulting from a late development of branches along the stem. Leleu et al. (2000) showed that early leaf fall deprived the plant of many nitrate reducing sites, and that, as a consequence, the stem and pods were able to increase the nitrate reductase activity and limit the harmful effect of leaf fall, providing that N uptake was sufficient to sustain nitrate reductase activity. Given that reduced N is necessary to support pod growth, it is suggested that the N taken up is preferentially partitioned towards the stem to maintain amino acid production when early leaf loss occurs.
Nitrogen supply to flowers and pods was mainly from endogenous N, representing 64 and 73 % of the total N content in these tissues, respectively. Endogenous N was essentially mobilized from the leaves (36 %) and stem (34 %). These data obtained with plants grown in field conditions agree with those of Rossato et al. (2001) for plants grown in hydroponic culture. They also show that two peaks of loss of leaves, with different residual N contents, occurred either before or after flowering (Fig. 3). The middle and top nodes were principally involved in N pod filling because this was synchronous with N mobilization from these nodes (i.e. from 24 to 36). As a consequence, all of the upper leaves had relatively low N contents (approx. 2 %) at the time of abscission, compared with leaves lost during stem extension (2·5–3·5 %), suggesting a more complete mobilization of N to the pods. Middle and top leaves were characterized by a high capacity to mobilize N (55–70 %; Fig. 4B).
Canopy structure
Given that Dreccer et al. (2000) found that leaf shading was responsible for a drastic reduction of LAI by the end of flowering (especially for high N fertilization levels), it can be suggested that the loss of leaves during flowering and pod filling was induced by the level of irradiance within the canopy, due to shading, initially from the reflection of light by the flowers and later by the pods (Backx et al., 1984; Chapman et al., 1984; Gabrielle et al., 1998). Although Sanetra et al. (1998) concluded that upper leaves in the canopy have a longer life span than leaves at low positions due to shading, they observed an opposite pattern of total N content in leaf insertions before abscission. Indeed, the leaves at the bottom of the canopy were more efficiently depleted in N (abscissed with 3 % on average) than the upper leaves (4 %).
Nitrogen uptake
Seed N filling in pigeonpea is mainly from exogenous N, i.e. N uptake and N2 fixation (Sanetra et al., 1998). Consequently the prolonged photosynthetic capacity of the upper leaves, combined with functional nodules, would improve N acquisition during pod filling. Given that oilseed rape is not a legume and N uptake is usually lower after the flowering stage, N supply from vegetative tissues is the main N source to match N requirement during pod filling. However, even the younger leaves, in which N mobilization was highest, still returned a larger proportion of N compared with other cultivated crops such as wheat or maize, for which residual N in the leaf is usually less than 1 % of dry weight. The stem can also be considered as a buffer organ in which endogenous N mobilized from sink organs (lower leaves, taproot) is stored during the vegetative period and then used for pod filling.
In conclusion, this study has revealed very complex N dynamics within the plant. The N taken up and initially allocated to winter leaves and stem appeared to be re-cycled to younger spring leaves and stem, before again being re-cycled for incorporation into pods. This conclusion is in good agreement with the work of Rossato et al. (2001), which demonstrated the occurrence of vegetative storage proteins in taproot and leaves. As oilseed rape has a low N harvest index (0·67 in this experiment) compared with wheat, for instance (0·76; Dreccer et al., 2000), genetic improvement related to morphology could increase the size of this endogenous N pool and/or optimize transfer of N to the pods. An ideal genotype would exhibit early flowering in order to synchronize N mobilization with the N demand of pods. It was also apparent that N mobilization toward the middle and top nodes was limited by early leaf abscission. Consequently, increasing leaf area duration of the lower nodes could increase the size of this pool of N for recycling. Given the fact that leaves at the middle and top nodes are able to mobilize N effectively for pod N filling, the amount of endogenous N allocated, firstly, to leaves at these nodes and, secondly, to the pods might be increased by optimizing the LAI of these nodes. All these hypotheses can be tested by modelling the previously reported data and this is described in a companion paper (P. Malagoli et al. unpubl.), where parameters defining the N dynamics in the different plant compartments are used to test possible scenarios to optimize pod N filling. In the long term, various genotypes will be tested with this model to facilitate selection of the most appropriate proposed improvements to increase N use efficiency in winter oilseed rape.
Acknowledgments
We thank Marie-Paule Henry for her excellent technical assistance with mass spectrometry and her involvement during never-ending harvests and Dr Anthony Gordon (IGER Aberystwyth) for helpful and constructive comments on this manuscript.
LITERATURE CITED
- Augustinussen E. 1987. The influence of nitrogen fertilization on growth and development of winter oilseed rape. Danish Journal of Plant Science 91: 301–311. [Google Scholar]
- Backx M, van Duivenvoorden J, Goudriaan J. 1984. Simulation of the production pattern of rape-seed on the basis of a field experiment. Netherland Journal of Agricultural Science 32: 247–250. [Google Scholar]
- Chamorro AM, Tamagno LN, Bezus R, Sarandon SJ. 2002. Nitrogen accumulation, partition, and nitrogen-use efficiency in canola under different nitrogen availabilities. Communications in Soil Science and Plant Analysis 33: 493–504. [Google Scholar]
- Chapman JF, Daniels RW, Scaisbrick DH. 1984. Field studies on 14C assimilate fixation and movement in oil-seed rape (B. napus). Journal of Agricultural Science 102: 23–31. [Google Scholar]
- Colnenne C, Meynard JM, Reau R, Justes E, Merrien A. 1998. Determination of a critical dilution curve for winter oilseed rape. Annals of Botany 81: 311–317. [Google Scholar]
- Dejoux JF. 1999.Evaluation d'itinéraires techniques du colza d'hiver en semis très précoces. Analyse agronomique, conséquences environnementales et économiques. PhD Thesis, INA P-G, Paris, France. [Google Scholar]
- Diepenbrock W. 1981. Effect of light, temperature and nitrogen treatments upon the fatty acid composition of young and older leaves from winter rape plants. Physiologia Plantarum 52: 1–6. [Google Scholar]
- Diepenbrock W. 2000. Yield analysis of winter oilseed rape (Brassica napus L.): a review. Field Crops Research 67: 35–49. [Google Scholar]
- Dreccer MF, Schapendonk AHM, Slafer GA, Rabbinge R. 2000. Comparative response of wheat and oilseed rape to nitrogen supply: absorption and utilisation efficiency of radiation and nitrogen during the reproductive stage determining yield. Plant and Soil 220: 189–205. [Google Scholar]
- Gabrielle B, Denoroy P, Gosse G, Justes E, Anderson MN. 1998. A model of leaf area development and senescence of winter oilseed rape. Field Crops Research 57: 209–222. [Google Scholar]
- Habekotté B. 1997. Identification of strong and weak yield determining components of winter oilseed rape compared with winter wheat. European Journal of Agronomy 7: 315–321. [Google Scholar]
- Hocking PJ, Randall PJ, DeMarco D. 1997. The response of dryland canola to nitrogen fertilizer: partitioning and mobilization of dry matter and nitrogen, and nitrogen effects on yield components. Field Crops Research 54: 201–220. [Google Scholar]
- Jensen LS, Christensen L, Mueller T, Nielsen NE. 1997. Turnover of residual N-15-labelled fertilizer N in soil following harvest of oilseed rape (Brassica napus L.). Plant and Soil 190: 193–202. [Google Scholar]
- Lainé P, Ourry A, Macduff JH, Boucaud J, Salette J. 1993. Kinetic parameters of nitrate uptake by different catch crop species: effects of low temperatures or previous nitrate starvation. Physiologia Plantarum 88: 85–92. [Google Scholar]
- Lawlor DW. 2002. Carbon and nitrogen assimilation in relation to yield: mechanisms are the key to understanding production systems. Journal of Experimental Botany 53: 773–787. [PubMed] [Google Scholar]
- Leleu O, Vuylstecker C, Têtu JF, Degrande D, Champolivier L, Rambour S. 2000. Effect of two contrasted N fertilisations on rapeseed growth and nitrate metabolism. Plant Physiology and Biochemistry 38: 639–645. [Google Scholar]
- Lemaire G, Gastal F. 1997. N uptake and distribution in plant canopy. In: Lemaire G, ed. Diagnosis of the nitrogen status in crops. Heidelberg: Springer Verlag, 3–43. [Google Scholar]
- Lemaire G, Onillon B, Gosse G, Chartier M, Allirand JM. 1991. Nitrogen distribution within lucerne canopy during regrowth: relation with light distribution. Annals of Botany 68: 483–488. [Google Scholar]
- Malagoli P, Lainé P, Le Deunff E, Rossato L, Ney B, Ourry A. 2004. Modeling N uptake in Brassica napus L. cv Capitol during a growth cycle using influx kinetics of root nitrate transport systems and field experimental data. Plant Physiology 134: 388–400. [DOI] [PMC free article] [PubMed] [Google Scholar]
- Merrien A, Palleau JP, Maisonneuve C. 1988. Besoins en éléments minéraux du colza cultivé en France. In: Physiologie et élaboration du rendement du Colza. Paris: Cetiom Editions, 34–46. [Google Scholar]
- Nanda R, Barghava SC, Rawson HM. 1995. Effect of sowing date on rates of leaf appearance, final leaf numbers and areas in Brassica campestris, B. juncea, B. napus and B. carinata Field Crops Research 42: 125–134. [Google Scholar]
- Rossato L, Lainé P, Ourry A. 2001. Nitrogen storage and remobilisation in Brassica napus L. during the growth cycle: nitrogen fluxes within the plant and changes in soluble protein patterns. Journal of Experimental Botany 52: 1655–1663. [PubMed] [Google Scholar]
- Sanetra CM, Ito O, Virmani SM, Vlek PLG. 1998. Remobilisation of nitrogen from senescing leaves of pigeonpea (Cajanus cajan (L.) Milsp.): genotypic differences across maturity groups? Journal of Experimental Botany 49: 853–862. [Google Scholar]
- Schjoerring JK, Bock JGH, Gammelvind L, Jensen CR, Mogensen VO. 1995. Nitrogen incorporation and remobilisation in different shoot components of field-grown winter oilseed rape (Brassica napus L.) as affected by rate of nitrogen application and irrigation. Plant and Soil 177: 255–264. [Google Scholar]
- Smith CJ, Whitfield DM, Gyles OA, Wright GC. 1989. Nitrogen fertilizer balance of irrigated wheat grown on red-brown earth in southeastern Australia. Field Crops Research 21: 265–275. [Google Scholar]
- Tittonel ED, Chaput JP, Letoublon F, Bonnot O. 1988. Besoins en éléments minéraux du colza cultivé en France. In: Physiologie et élaboration du rendement du Colza. Paris: Cetiom Editions, 68–72. [Google Scholar]
- Triboï-Blondel AM. 1988. Mise en place et fonctionnement des feuilles de colza d'hiver : relations azote-carbone et sénescence. In: Physiologie et élaboration du rendement du Colza. Paris: Cetiom Editions, 111–120. [Google Scholar]


