

Abstract
• Background and Aims Plant growth involves pressure-driven cell enlargement generally accompanied by deposition of new cell wall. New polysaccharides are secreted by the plasma membrane but their subsequent entry into the wall is obscure. Therefore, polysaccharides and gold colloids of various sizes were presented to the inner wall face as though they were secreted by the plasma membrane.
• Methods Primary cell walls were isolated from growing internodes of Chara corallina and one end was attached to a glass capillary. Solutions of dextran or suspensions of gold colloids were pushed into the lumen by oil in the capillary. The oil did not enter the wall, and the solution or suspension was pressed against the inner wall face, pressurized at various ‘artificial’ P (turgor pressure), and polymer or colloid movement through the wall was monitored.
• Key Results Interstices in the wall matrix had a diameter of about 4·6 nm measured at high P with gold colloids. Small solute (0·8 nm) readily moved through these interstices unaffected by P. Dextrans of 3·5 nm diameter moved faster at higher P while dextran of 9 nm scarcely entered unless high P was present. Dextran of 11 nm did not enter unless P was above a threshold, and dextran of 27 nm did not enter at P as high as 0·5 MPa. The walls filtered the dextrans, which became concentrated against the inner wall face, and most polymer movement occurred after P stabilized and bulk flow ended.
• Conclusions P created a steep gradient in concentration and mechanical force at the inner wall face that moved large polymers into small wall openings apparently by starting a polymer end or deforming the polymer mechanically at the inner wall face. This movement occurred at P generally accepted to extend the walls for growth.
Keywords: Dextran, FITC–dextran, fluorescein isothiocyanate, gold colloids, turgor pressure, wall matrix
INTRODUCTION
The following work was undertaken to investigate whether turgor pressure (P) affects the deposition of polysaccharides in plant cell walls. Young plant cells capable of growing must build more wall as they grow. Hemicellulose, pectins and small amounts of structural protein form the wall matrix in which cellulose microfibrils are usually embedded to create a reinforced gel structure (e.g. Morrison et al., 1993). The wall grows in part by being stretched by P because interpolymeric bonds in the matrix naturally break and re-form, and when under tension from P the polymers tend to slip past each other irreversibly, enlarging the wall (Cleland, 1971; Taiz, 1984). Typically, the stretching enlarges the cell 10- to 100-fold (Roberts, 1994) but under normal conditions the walls do not become proportionately thinner (Bonner, 1934; Loescher and Nevins, 1973; Bret-Harte et al., 1991). The wall increases in mass and volume while continuing to support the protoplast and resist the strain produced by P. As much as 90–99 % of the wall is new by the time the cell matures (Roberts, 1994).
Initially, the new wall materials accumulate at the inner wall face after being secreted through the plasma membrane by exocytosis (matrix component of wall) (Northcote and Pickett-Heaps, 1966; Ray, 1967; Moore et al., 1991; Perrin et al., 2001) or by plasma membrane complexes (cellulose microfibril component of wall) (Giddings et al., 1980; Kimura et al., 1999). Once released, the new matrix polymers find their way into the growing wall and around the new cellulose microfibrils (Northcote and Pickett-Heaps, 1966; Ray, 1967; Preston, 1974; Carpita and Gibeaut, 1993; McCann and Roberts, 1994). Within the matrix structure, a considerable fraction of the volume is water-filled and forms a porous network for molecule movement (Thompson and Preston, 1968; Carpita and Gibeaut, 1993; McCann et al., 1995; Kohorn, 2000). The network allows molecules as large as 3·5–8·6 nm to enter at atmospheric P (references in Read and Bacic, 1996; Titel et al., 1997).
In some respects, the matrix might act as a gel filtration system similar to cross-linked dextran such as Sephadex that separates polymers by molecular size (Laurent and Killander, 1964). Tepfer and Taylor (1981) found this type of behaviour with cell wall particles placed in a column through which a polymer solution flowed. However, living cells develop P on one side of the wall. A tension is created that causes the coiling, intercalating network of matrix molecules to partially uncoil and straighten, restricting polymer motion and causing a more uniform conformation than in the unstrained matrix. In primary walls capable of growth, this conformational change is seen as an elastic enlargement of the matrix followed by irreversible deformation as P becomes higher (Taiz et al., 1981; Proseus et al., 1999). The P also creates an abrupt P step-down at the inner wall face that forms a steep gradient dP/dx extending into the matrix only a short, sub-polymer distance x. The P step-down represents energy that could affect nearby molecules.
The effect of gel filtration, wall strain and steep P gradients could be important for new wall formation in growing plant cells. In the present work, this possibility was investigated in walls isolated from large algal cells. P was produced with a method adapted from the mercury injection procedures of Kamiya et al. (1962, 1963) and Metraux et al. (1980) but using mineral oil injected into the lumen created by removing the protoplast. Various polymers or colloids were pushed ahead of the oil to the inner face of the wall as though they were recently secreted by the plasma membrane. Their movement through the wall was then monitored at various P.
MATERIALS AND METHODS
Plant material
Cultures of Chara corallina (Klien ex. Willd., em. R.D.W.) were maintained as previously described (Zhu and Boyer, 1992). Briefly, C. corallina was grown in a liquid medium with a sand and pond mud substrate. The medium was maintained at 23 °C and in continuous light (PAR of 10 μm m−2 s−1 at the medium surface). Macronutrients (1 mm chloride salts of Na, K, Ca and Mg) were provided with periodic medium changes. The pH naturally settled at about 8 in the medium. These conditions were maintained during all cell manipulations unless otherwise noted.
Isolating cell walls
For each experiment the ultimate or penultimate internode cell was excised by hand from the distal portion of the thallus by cutting below the cell's basal node and trimming away any nodal branch cells. These internode cells had been growing actively, ensuring that only primary cell walls were present. After excision, a stream of warm air (cell at 30 °C) was used to reduce the turgor, and the basal wall end was cut off leaving a cell about 15 mm long. After transferring to a shallow dish of water, the intact end of the cell was held stationary under the water with wax-coated forceps, and the remainder of the cell was gently scraped with a blunt plastic blade until no green colour remained. Under an electron microscope, the chloroplasts could be seen closely associated with the plasma membrane in a thick, parietal layer of cytoplasm. Removing the green colour removed this layer with the chloroplasts and plasma membrane.
Preparing and pre-loading microcapillaries
A borosilicate capillary (1 mm OD) was hand-drawn in a flame to produce a tapered hollow microcapillary tip that was trimmed to approx. 200 μm diameter and fire-polished to remove sharp edges. The capillary was filled with mineral oil (paraffin oil) and fitted into a large cell pressure probe (Steudle and Zimmermann, 1974) also filled with mineral oil. The probe used by Proseus et al. (2000) was modified to include a precision motor (Oriel Co., Stratford, CT, USA) to drive the steel plunger into the probe barrel using a programmable electronic feedback system (model DP25-E-AR, Omega Engineering, Stamford, CT, USA). The system allowed the control of P to within 0·001 MPa measured with a Kulite pressure transducer (Model CQ-140-200-D, Kulite Semiconductor Products, Inc., Ridgefield, NJ, USA). After pre-loading with oil and mounting on the pressure probe, 3 μL of one of several test solutions (see Injecting polymers below) could be loaded into the microcapillary by immersing the tip in a droplet of the solution, and pulling the droplet into the tip. Because of the large diameter of the microcapillary tip, the droplet entered easily without surface tension effects. Care was taken to avoid air bubbles in the tip or pressure probe.
Sealing isolated cell walls to microcapillaries
The micromanipulator holding the pressure probe was adjusted to immerse the distal 5 mm of the microcapillary tip into a shallow dish of water. The open end of the isolated cell wall was threaded over the tip until the wall and glass formed a tight junction at least 2 mm long around the entire circumference of the tip. The probe was repositioned to bring the glass/wall junction just above the water surface while leaving the free end of the wall lumen (approx. 10 mm) submerged. The glass/wall junction was allowed to air-dry for a few minutes, then acetone was applied and allowed to dry again. The junction was sealed with cyanoacrylate glue (‘Quick Tite’, Loctite, Rockyhill, CT, USA) by applying a drop of glue and blotting the excess, thereby allowing the glue to penetrate on all sides, creating a clear, colourless junction. The glue was applied three times, curing 15 min after the first and second times and 1 h after the third. Water in the junction was indicated by a dull white appearance and destroyed the sealing abilities of the glue, a condition that could not be reversed by applying more glue. When the cure was complete, the probe was raised to lift the entire cell wall above the water level. The cell wall was dipped in clean water to remove glue residue and lowered into a collecting vessel whose size and contents varied depending on the particular experiment.
Injecting polymers
Molecules released by the plasma membrane (PM, Fig. 1A) are in the periplasmic space (yellow circles, Fig. 1A). In an isolated wall mounted on the microcapillary tip, the pre-loaded test solution could be pushed into the same ‘periplasmic space’ by the mineral oil in the pressure probe (yellow circles, Fig. 1B). The nonpolar mineral oil was unable to pass through the cell wall because surface tension at the oil/water interface prevented the oil from entering the aqueous phase of the wall matrix (Fig. 1B). The same force controls the position of the plasma membrane in the living cell (Fig. 1A). The inability of the oil to pass through the wall caused pressure to build in the injected oil and created an ‘artificial’ P (Fig. 1B). The injection rate was controlled to keep the P from rising too abruptly (usually requiring 2–5 min) after which P was adjusted to a final value between 0·05 and 0·5 MPa, and the programmable control system was set to maintain P constant. By this method, the test solution could be subjected to P identical to that in the living cell.
Fig. 1.
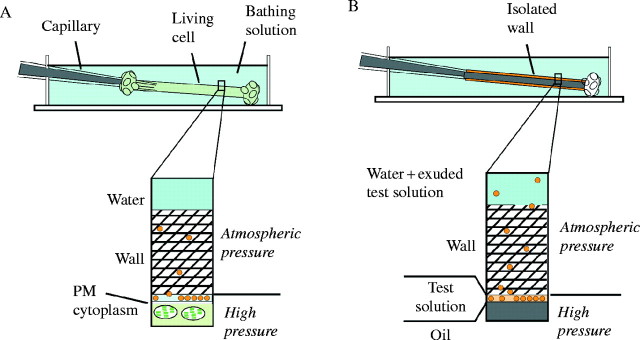
Measuring and altering P inside (A) a living Chara corallina internode cell or (B) an isolated wall when a test solution of polymers is present at the inner wall face. Molecules recently released from the plasma membrane (A) or molecules from the test solution (B) are shown (yellow). The matrix of the wall is the cross-hatched region and contains embedded cellulose microfibrils that are not shown. The pressure probe capillary in (A) removes or returns cell solution to the cell interior allowing control of P. The pressure probe capillary in (B) removes or returns mineral oil to the wall lumen allowing control of artificial P. The oil/water meniscus in (B) is at the same position as the plasma membrane (PM) in (A). Wall interstices remain filled with water and at atmospheric pressure.
Aqueous test solutions were prepared containing unconjugated fluorescein isothiocyanate (FITC) (0·1 mg mL−1), or one of four preparations of conjugated FITC–dextran (α-1,6-glucan with occasional α-1,3- and α-1,4-links, polymer about 5 % α-1,3-branched, 6·0 mg mL−1) having an average molecular weight of 4·4 kDa, 38 kDa, 70 kDa or 580 kDa (lot numbers FD-4 (35H1368), FD-40 (78H0457) and FD-70 (128H9801), FD-500 (74H5012), respectively, from Sigma, St Louis, MO, USA). Test solution stocks were stored at 4 °C and discarded after 7 d.
Measuring polymer movement into and through cell walls
For most trials, measurements began when all of the 3 μL of test solution was inside the lumen previously occupied by the protoplast, and a stable target P had been reached (time = 0). After stirring the external water bathing the wall, an aliquot was periodically removed and its fluorescence intensity measured in a Shimadzu RF-1501 spectrofluorophotometer (Shimadzu, Kyoto, Japan) with excitation at 484 nm and emission at 515 nm. Trials were allowed to continue until the intensity of the external water stopped increasing, indicating no more test solute was passing through the wall. Data were expressed as percentage recovery of the solution supplied to the lumen, based on the fluorescence intensity of a like quantity of test solution but measured separately. The measurements indicated there was a 3·8 % loss of test solution during tip loading. The baselines for 100 % recovery were adjusted in each experiment to account for this loading loss. Controls were injected with 3 μL of water instead of test solution. The experiment room was kept dark except during brief periods when sample aliquots were being taken or glue was being applied. Three replicate trials with each test solution were performed at each of up to four target P.
In another set of experiments, the location of FITC or FITC–dextran in the lumen, wall matrix or external water was determined by injecting FITC or 38-kDa FITC–dextran in the usual way and developing a typical P of 0·5 MPa. After P developed for 1·5 min, the fluorescence in the external water was measured to indicate the amount that had exuded through the wall. The wall was then cut into several fragments with a razor blade, and test solution (and mineral oil) within the cell lumen was flushed into the external water during the cutting. The external water was thoroughly stirred with a pipette for 15 s and the additional fluorescent intensity was measured. This sample indicated the amount of test solution originally exuded through the wall plus that collected from the lumen. Then, the wall fragments in the water containing the exuded + lumen contents were immediately placed into a Ten Broeck tissue grinder and ground for several minutes until no visible fragments remained. This extract was centrifuged for 10 min at 700 g, and the additional fluorescence was measured in the external water to indicate the amount in the wall matrix. The sum of fluorescence in the external water (i.e. exuded + lumen + wall matrix) was compared with that originally injected into the cell lumen. Care was taken to keep the samples in darkness as much as possible prior to fluorescence measurements. Early tests showed that mineral oil escaping into the bathing water during cutting did not disturb the fluorescence measurements.
Microscopy
Observations, using a Zeiss LSM510 laser scanning confocal microscope (Carl Zeiss, Thornwood, NY, USA), were made of cell walls with artificial P using FITC-based test solutions in unstirred, single-chambered walled coverglasses (Nalge Nunc, Naperville, IL, USA). The isolated walls were stained with 0·1 % aqueous Congo Red solution (Sigma Chemical Co., St Louis, MO, USA) for 30 min prior to mounting on the microcapillary of the pressure probe. Dual channel time-series images of the injection, pressurization, and movement of fluorescent FITC, 38-kDa FITC–dextran and 580-kDa FITC–dextran were made with excitation at 488 nm and emission at 505–530 nm controlled with a bandpass filter. Wall-bound Congo Red was simultaneously imaged with excitation at 543 nm and emission at 560 nm with a longpass filter. In the final images, FITC signal was false-coloured yellow.
Supplying gold colloids
In another group of experiments, 4 μL of aqueous suspensions of colloidal gold with nominal diameters of 5 nm, 10 nm or 20 nm (ICN, Aurora, OH, USA) were injected into the cell lumen. The procedures were the same as with FITC–dextran solutions except the external water was replaced with microscope objective immersion oil. Walls were blotted with absorbent paper before being lowered into the oil. Pressurizing the wall lumen forced the aqueous test suspension through the wall and formed droplets on the wall exterior or the chamber bottom. The droplets were collected with a Drummond microdispenser, transferred to water in a disposable cuvette, and stirred. Light transmission was measured at 514 nm (5-nm colloid) or 524 nm (10- and 20-nm colloids) with a Hewlett-Packard 8452A UV/VIS spectrophotometer. This method allowed for only one reading per wall, so trials were repeated and the duration at the target P was varied to establish a time course. Standard curves established for each stock suspension showed that light transmittance at the characteristic wavelength was inversely proportional to the concentration of gold colloid. Colloid diameters were verified by transmission electron microscopy (TEM). Formvar-coated 400-mesh grids were floated on a drop of colloidal gold (on Parafilm) for 10 min and then air-dried. The TEM images indicated that the colloidal particles were highly uniform with the nominal diameter of 5-nm particles measuring 4·6 ± 0·1 nm (range) and the 10 nm particles measuring 9·8 ± 0·1 nm (range). All colloidal suspensions were stored at 4 °C at pH 7·5–8·0 as supplied by the manufacturer, and the stock solutions were discarded after 3 weeks. Control walls were treated as above, except 4 μL of water containing no gold colloid was injected.
RESULTS
Injecting test solutions into the lumen
When the pressure probe injected mineral oil into the lumen of the isolated wall, artificial P could be generated and precisely controlled. Placing an aqueous test solution of FITC–dextran in front of the oil allowed the trans-wall movement of the solute to be monitored at various P. In the confocal microscope, the entering FITC–dextran solution was dilute (lumen, Fig. 2A) and became concentrated (brighter fluorescence) as P began to develop (Fig. 2B). When P approached 0·5 MPa, the FITC–dextran was in a very small volume, highly concentrated in the lumen or wall matrix. Only a slight amount of FITC–dextran was visible in the external water next to the wall (Fig. 2C). After a few minutes, FITC–dextran began to be detected outside (Fig. 2D).
Fig. 2.

Sequence of P development when FITC–dextran is supplied to the lumen inside an isolated Chara cell wall. (A) Confocal microscope view of 38-kDa FITC–dextran solution (yellow) being injected by a pressure probe into the lumen of the flaccid wall (pre-stained with Congo Red). Scale bar = 100 μm. (B) Mineral oil (Oil) follows the FITC–dextran. Yellow fluorescence is more intense than in (A) indicating concentration of the injected dextran as oil fills the lumen and P rises. (C) P reaches 0·5 MPa and is held constant. FITC–dextran is pressed against the inner face of the cell wall. (D) After P of 0·5 MPa for 5 min, some FITC–dextran has passed through the cell wall and appears in the unstirred water outside. (E) Quantitative analysis of FITC–dextran (F-d) and water movement (W) as P develops in (A) to (D). Ordinate on left indicates recovery as a percentage of the supplied water or dextran, and on right indicates P applied to F-d solution. Time = 0 (vertical dashed line) when P reaches 0·5 MPa.
This process was quantified by detailed measurements of water movement, fluorescence and P during the pressurization. Water was collected from the external surface of the wall when surrounded by a saturated atmosphere while P was developing. As oil began to fill the isolated wall, P rose but then decreased as oil injection was paused briefly (Fig. 2E, steps in P before 0 min). The water in the test solution flowed out of the lumen and across the wall where it accumulated as droplets on the outside of the cell (Fig. 2E, W before 0 min). Oil had to be repeatedly injected to compensate for this water movement. When the 38-kDa FITC–dextran was measured in the water outside of the cell, little could be detected (Fig. 2E, F-d before 0 min). The FITC–dextran remained mostly in the lumen or wall, confirming that dextran had been concentrated while water was moving out. At high P, nearly all of the water in the dextran solution had moved through the wall (98 % of solution supplied to interior was collected outside as water; Fig. 2E, W at 0 min). Water flow ceased, and bulk flow through the wall ended. Only after bulk flow ended was it possible to bring P to its final level where it was stable (Fig. 2E, stable P after 0 min). At this high P, dextran slowly began to appear externally (Fig. 2E, F-d after 0 min). The fluorescent signal became stronger with time as more FITC–dextran moved through the wall and into the external water.
This movement of FITC–dextran was affected by P. Initially, the FITC–dextran was forced against the inner face of the wall and, after 5 min at P of 0·5 MPa, was visible inside the lumen and outside after having passed through the wall (Fig. 3A). In a separate cell, 25 min at a lower P of 0·05 MPa failed to move the FITC–dextran through the wall (Fig. 3B).
Fig. 3.
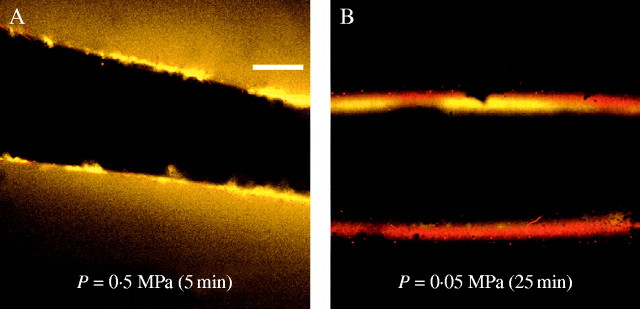
P dependence for FITC–dextran (38-kDa) to move into and through an isolated cell wall from a growing Chara internode cell. (A) Confocal microscopy view of FITC–dextran moving at high P of 0·5 MPa characteristic of living cells. Some of the FITC–dextran (yellow) is concentrated at the wall and some is visible outside in the unstirred bathing water after 5 min. Scale bar = 100 μm. (B) In another wall at low P of 0·05 MPa, no FITC–dextran is visible in the unstirred bathing water after 25 min, and dextran remains concentrated at the wall.
In order to test whether the rate of dextran movement was affected by the size of the molecule, different molecular weights of dextran were injected into isolated walls, and P was kept the same for each experiment. The initial injection of dextran and its subsequent movement through the wall to the external water was observed continuously in the confocal microscope. The appearance of fluorescent signal in the external water at P of 0·5 MPa was more rapid for FITC (Fig. 4A) than for FITC–dextran having a molecular weight of 38 kDa (Fig. 4B). If the FITC–dextran had a molecular weight of 580 kDa, it scarcely moved through the wall (Fig. 4C).
Fig. 4.

Molecular weight dependence for movement of molecules across Chara cell wall. (A) Confocal microscope view of unconjugated FITC after 79 s of artificial P of 0·5 MPa. Scale bar = 100 μm. Changes in FITC signal were measured continuously within 100 μm × 100 μm squares in the image and plotted in the graph below the image. Blue square in image, blue trace in graph shows fluorescence in the lumen; red square in image, red trace in graph shows fluorescence in unstirred exterior water. Rate of FITC movement into lumen reaches a peak at 20 s but reaches a peak in exterior water at 79 s. (B) Same as (A) but with 38-kDa FITC–dextran. After 235 s of observation, 38-kDa FITC–dextran is seen concentrated in or near the wall but is slowly moving from the lumen to the outside through the wall (image). FITC–dextran is still moving slowly at 1100 s (graph). (C) Same as in (A), but for 580-kDa FITC–dextran. Little or no FITC–dextran is detected after 200 s (image) or longer times (graph).
Polysaccharide movement through cell walls
Because both P and molecular size affected polymer movement through the walls, the effects were quantified more fully by monitoring the trans-wall movement over a wide range of P and molecular sizes. When FITC alone was supplied to the lumen, only about 10–40 % of it was detected in the external water after 0·5 min of stable P (Fig. 5A). It then passed slowly to the outside over the next hour. There was no difference in FITC movement at P of 0·05 MPa and 0·5 MPa, and the slightly slower movement at 0·25 MPa was not statistically significant. Between 80 and 90 % of the FITC injected into the cell lumen was detected outside of the wall after 120 min.
Fig. 5.
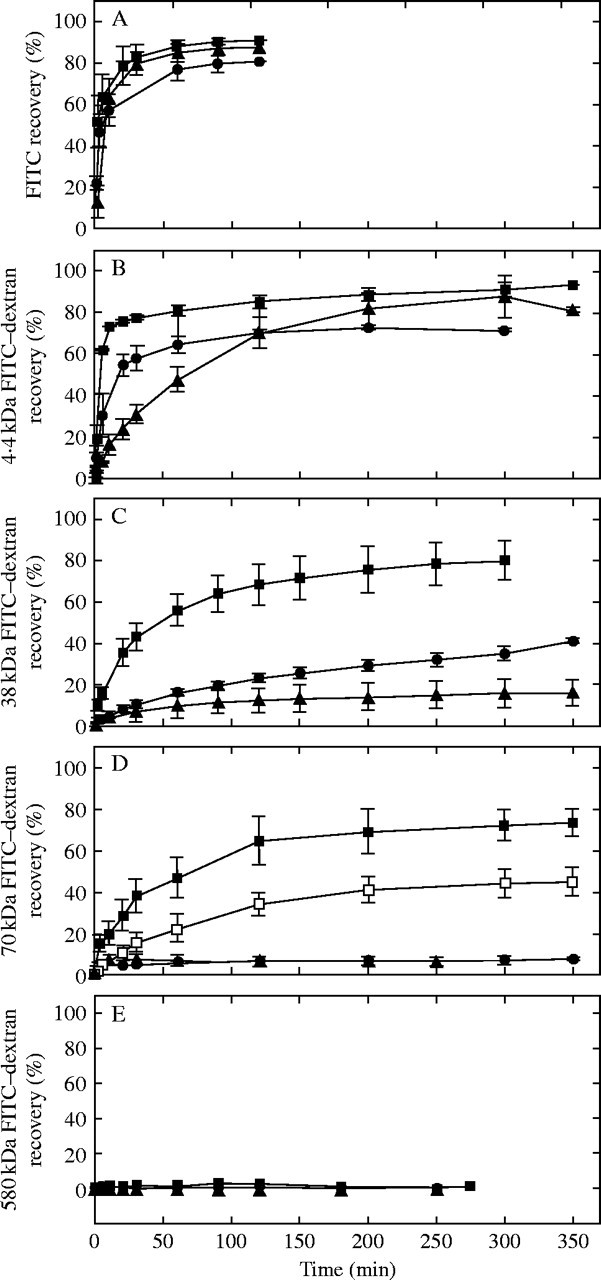
Movement of aqueous FITC or FITC–dextran of various molecular weights through isolated Chara walls at various steady P. (A) Time course of movement of FITC (0·389-kDa) at P of 0·05 MPa (triangles), 0·25 MPa (circles) or 0·5 MPa (squares). (B) Same as (A) but with 4·4-kDa FITC–dextran. (C) Same as (A) but with 38-kDa FITC–dextran. (D) Same as (A) but with 70-kDa FITC–dextran and including a measurement at P of 0·35 MPa (open squares). Measurements at P of 0·05 and 0·25 are often coincident and appear as single points. (E) Same as (A) but with 580-kDa FITC–dextran. Recovery (%) on ordinate is the percentage of the injected test solution that was recovered in the stirred bathing water. Time zero on the abscissa is when stable P was established. Each point is a mean ± 1 s.e. for n = 3 walls.
When FITC was conjugated with 4·4-kDa dextran, it moved more slowly through the wall than the FITC, and only 0–10 % of the dextran was detected outside after 1 min of stable P (Fig. 5B). Subsequently, the dextran moved through the wall until 70–93 % was found outside at 3–5 h. The movement was fastest at 0·5 MPa and slowest at 0·05 MPa.
With 38-kDa FITC–dextran, there was little trans-wall movement near time zero (Fig. 5C) or during the entire experiment at P of 0·05 MPa. At 0·25 MPa, the 38-kDa FITC–dextran crossed the wall slowly. At 0·5 MPa, movement across the wall increased greatly and 80 % was recovered after 300 min.
With 70-kDa FITC–dextran, trans-wall movement was negligible at P of 0·05 MPa and 0·25 MPa (Fig. 5D). At 0·35 MPa, movement occurred slowly and at 0·5 MPa much faster. After 300 min, 74 % of the latter dextran was recovered. The lack of movement at P of 0·05 MPa and 0·25 MPa indicated that a threshold P was necessary before the trans-wall movement began.
With 580-kDa dextran, movement was undetectable at P as high as 0·5 MPa (Fig. 5E) even after 250 min.
Controls in which only water was injected as a test solution produced no fluorescent signal in the external water (not shown).
Dimensions of interstices in cell walls
Because P could move some of the dextrans through the wall, it was of interest to determine the dimensions of the path. The lumen was supplied with gold colloids instead of dextran, and their movement was determined in the same way as with the dextrans, but using a spectrophotometer. Colloids with a diameter of 4·6 nm were able to pass though the walls at P of 0·5 MPa (recovery of 70 % after 45 min), but their movement was signficantly lower at P of 0·25 MPa (recovery of 10 % after 60 min) (Fig. 6A). As one stock vial of nominal 5-nm colloid aged it suddenly became much less able to penetrate the cell walls at any P. Subsequent TEM images showed that the colloid had coalesced into trimeric and tetrameric clusters that were too big to pass through the walls. Colloids with diameters of 20 nm and 9·8 nm scarcely moved and were detected outside the wall at about 10 % recovery after 60 min at P of 0·5 MPa (Fig. 6B and C). Attempts to explore the movement of 2·6-nm Nanogold spheres (Nanoprobes, Inc, Yaphank, NY, USA) were unsuccessful because the particles bound strongly to the wall allowing only a small fraction of them to move through at any P (data not shown).
Fig. 6.
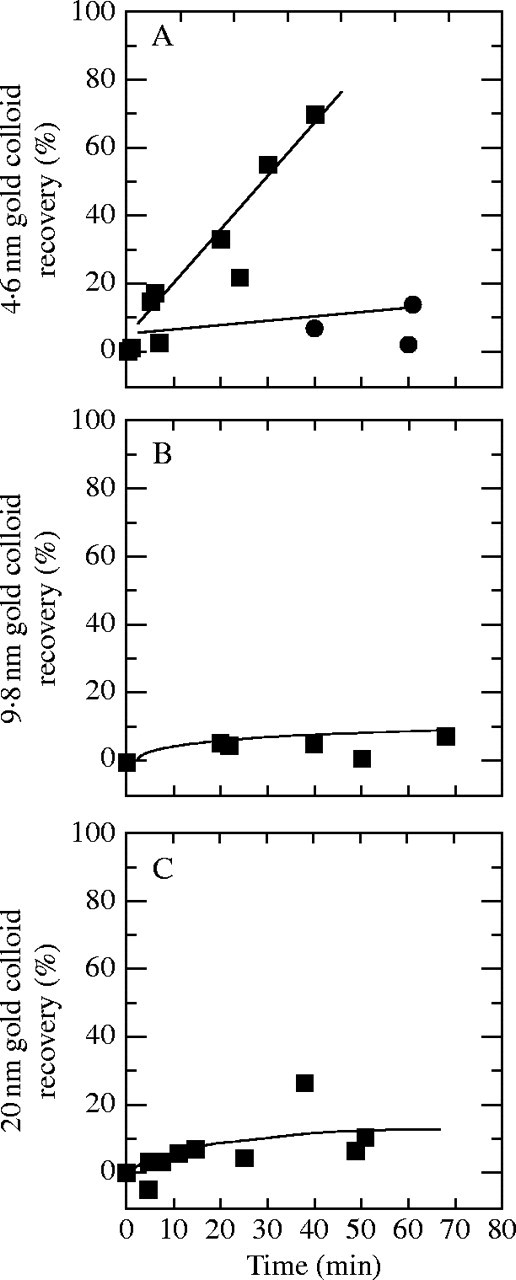
Movement of colloidal gold through isolated walls from growing internode cells of Chara at various steady P. (A) Gold with 4·6 nm diameter and P of 0·5 MPa (squares) or 0·25 MPa (circles). (B) Same as (A) but with gold of 9·8 nm diameter at P of 0·5 MPa. (C) Same as (A) but with gold of 20 nm diameter at P of 0·5 MPa. Recovery shown on ordinate is percentage of total colloid injected. Each point represents a single wall from a separate cell.
The P-responsiveness with gold of 4·6 nm in diameter and some of the dextrans raised the possibility that high P irreversibly enlarged the interstices in the wall matrix. To test this possibility, P was kept at 0·5 MPa for a few minutes and returned to 0·05 MPa while 38-kDa FITC–dextran was moving through the walls. The sudden lowering of P (Fig. 7A, Wall 2) rapidly halted the movement of the FITC–dextran (Fig. 7B, Wall 2), as compared with the typical curve with continuous high P (Fig. 7, Wall 1). Three replicate trials of the experiment in Fig. 7 gave similar results.
Fig. 7.
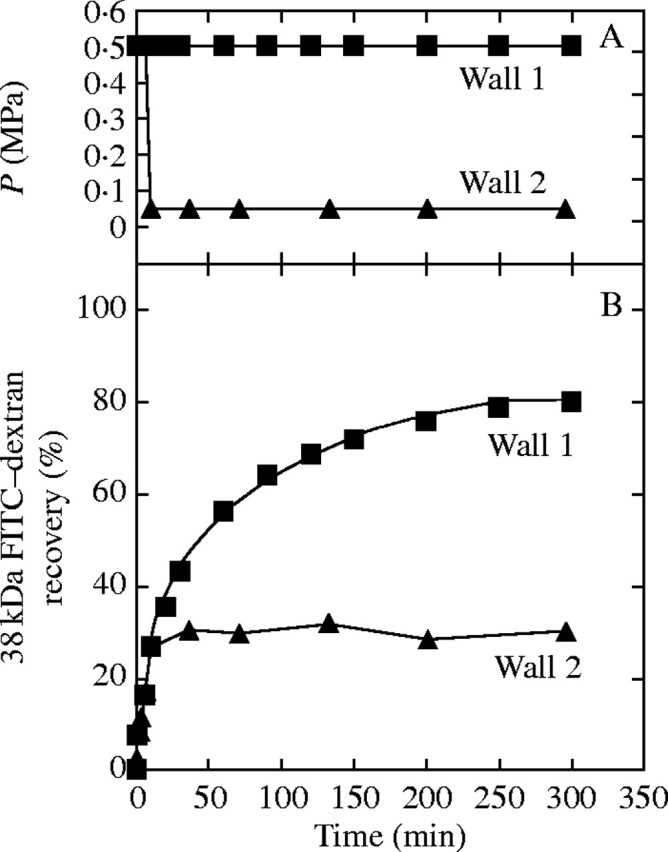
Test of irreversible enlargement of matrix interstices by P. 38-kDa FITC–dextran was supplied to the inner wall surface of Chara cell walls as shown in Fig. 2. (A) Turgor pressure, P. (B) Recovery of dextran in bathing water. In Wall 1, P was stable at 0·5 MPa throughout the trial. In Wall 2, P was held at 0·5 MPa for 10 min, then reduced to 0·05 MPa for the remainder of the trial. Experiment was repeated three times with similar results.
Location of polymers
It was of interest to determine whether the concentrated solution of dextran was inside the lumen or inside the wall matrix when stable P was first achieved. The fluorescence of FITC or FITC-conjugated dextran was measured in (a) a sample of the external bathing water (Fig. 8, Exuded), (b) the solution flushed out of the lumen after excising the end of the wall (Fig. 8, Lumen) and (c) the remaining wall, which was extracted in water (Fig. 8, Wall). With FITC alone, 62 % had exuded into the external bathing water when the test solution had been pressurized at 0·5 MPa for 1·5 min (Fig. 8A). The lumen contained 8 %, and the wall contained 30 % (Fig. 8A). This result indicated that FITC had been rapidly flushed into the wall matrix from which it diffused into the external water.
Fig. 8.
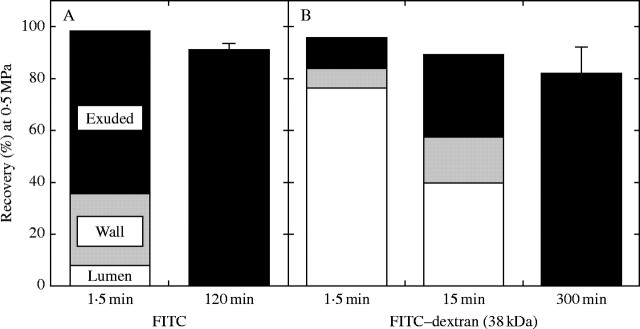
FITC and FITC–dextran compartmentation when P was held at 0·5 MPa for 1·5 min. Isolated cell walls of Chara were injected with (A) unconjugated FITC or (B) 38-kDa FITC–dextran. Fluorescence was measured in the bathing water (Exuded), in solution flushed from the lumen after the end of the cell wall was excised (Lumen) and in an extract of the wall (Wall). In (B), this analysis was also made when P was held at 0·5 MPa for 15 min. Data are from one of three replicate trials that produced similar results. The total from these locations was compared with the total collected in the external water after 120 min (A) or 300 min (B) of movement through the isolated cell wall as in Fig. 5 (means ± s.e. of three replicate trials).
In contrast, large molecules such as 38-kDa FITC–dextran did not enter the wall matrix rapidly, and cutting the wall open recovered nearly 80 % of the dextran after 1·5 min of pressurization (Fig. 8B, Lumen). This indicated that only a minor fraction of the dextran was within the wall matrix at 1·5 min. Even after 15 min at P = 0·5 MPa, 40 % of the dextran was still trapped inside the lumen.
DISCUSSION
Ultrafiltration and P effects on polymer movement
The fate of polymers under pressure could be followed as they encountered the primary wall. The polymers at first were concentrated inside the wall, which acted as an ultrafilter. The concentrating effect was apparent in confocal images that became brighter as P increased. As water was lost from the solution, it shrank to near-molecular dimensions between the oil and the inner wall face. In this location, the P forcing water out was counterbalanced by the osmotic potential of the concentrated polymer attracting water in. The wall acted as a selective membrane for the polymers and assumed a role typically assigned to the plasma membrane. This is analogous to the situation in the living, turgescent cell where P produced by the protoplast concentrates the new soluble polymers at the inner wall face. As P increases, the concentration increases.
After the concentrating phase, the dextran moved into and through the wall at rates determined by polymer size and the magnitude of P. The movement occurred despite the absence of bulk flow through the wall. Without bulk flow, there was no solute drag that would cause the polymer to be flushed through the wall. Instead, it was driven diffusionally by the steep concentration gradient across the inner wall face together with the steep P gradient across the inner wall face.
These results indicate that the plasma membrane in living cells is displaced from the inner wall face by the intervening layer of secreted polymers, and there is no P difference across the plasma membrane itself. The secreted polymers are in a region of uniformly high P, but as they enter the wall matrix they move through the abrupt P step-down at the wall face to the low P in the matrix. In Chara, the P stepped down to atmospheric pressure in the wall (assuming swelling pressures were negligible). In multicellular plants whose cell walls contain water below atmospheric pressure, the P step-down would tend to be larger than in Chara.
Dimensions of matrix interstices
All of the dextrans displayed long residence times in the lumen and matrix. The dextrans contained no charged groups, and those passing through the wall eventually were 80–95 % recovered in the external water indicating that they moved slowly but without actually becoming part of the wall matrix.
The pre-existing matrix contained water-filled interstices having dimensions reported to be controlled mainly by the pectin fraction (Baron-Epel et al., 1988; Meiners et al., 1991; McCann et al., 1992; Fleischer et al., 1999) that microscopy showed to have a regular network of linkages (Casero and Knox, 1995). Consequently, the diffusion path should consist of tortuous interstices with a narrow range of dimensions, at least within comparable wall regions (McCann et al., 1990). As long as P was low in the present work, the wall appeared to act by typical gel filtration (Laurent and Killander, 1964; Tepfer and Taylor, 1981). Small molecules had greater wall access than large molecules. However, when P was increased, this model failed. The rate at which small molecules moved through the matrix was unaffected, but large molecules moved faster than at low P.
There was no evidence of specialized pores in the wall matrix other than plasmodesmata that existed only at the internode ends in contact with the small nodal cells (Meeuse, 1957). The nodal cells remained generally intact but the plasmodesmatal connections appeared inoperative because polymer movement through the ends was negligible compared with that through the side walls. In general, molecular movement through the side walls was uniform.
Gold colloids were more reliable than dextran for measuring the dimensions of the matrix interstices because the solid gold spheres were dimensionally stable and were verified by TEM. For a given value of P, the wall either had openings large enough to admit a given colloid or it did not. The wall admitted colloids of 4·6 nm but only at a high P of 0·5 MPa. At slightly lower P, the gold scarcely entered, suggesting that the concentration of gold colloid was less than at high P or the interstices had become smaller, or both. The highest P used in the experiments (0·5 MPa) was within the range normally causing irreversible cell enlargement in living Chara internodes (Proseus et al., 2000). It seemed possible that the matrix interstices became similarly enlarged at high P but not lower P. However, using dextrans, the rapid polymer movement at high P immediately returned to the low-P rate when P decreased. Had high P irreversibly enlarged the openings in the matrix, the rate would have remained rapid. The rate of gold colloid movement was thus affected either by changes in dimensions that were reversible or by concentrating effects at the inner wall face.
The FITC results argue against reversible changes in dimensions. FITC was small enough (0·8 nm) to be flushed into the matrix while water moved through prior to time 0. As a result, the FITC was outside of the P boundary, and P did not act to concentrate the molecule or deform it. P acted on FITC movement only by straining the matrix. The constancy of FITC diffusion in the matrix at all P indicates that straining the matrix did not enlarge wall interstices enough to affect the diffusion of small molecules. These principles probably govern the movement of all small molecules into and through the wall matrix. The FITC results, together with the gold colloid data, suggest that the molecular exclusion diameter was not much above 4·6 nm.
These dimensions were similar to those reported in C. corallina by Shepherd and Goodwin (1989) who estimated the maximum molecular diameter to penetrate the walls at about 4·8 nm in turgorless cells using a rhodamine-labeled, globular oligopeptide, insulin A. Berestovsky et al. (2001) reported sizes of only 2·1 nm in C. corallina based on P changes caused by PEG (polyethylene glycol) movement across the walls, but these authors did not adequately account for the low reflection coefficient of the walls for PEG. The low reflection coefficient would prevent P from fully accounting for the osmotic effect of the entering PEG, thus leading to an underestimate of molecular exclusion.
Given that diameters in the matrix interstices were approx. 4·6 nm in the Chara walls, FITC with its molecular weight of 389 and diameter of 0·8 nm (Ekani-Nkodo and Fygenson, 2003) moved readily through the wall, while the 4·4-kDa FITC–dextran had a Stokes' diameter of 3·5 nm (Peters, 1986; Read and Bacic, 1996) and began to be hindered. All the other dextrans had Stokes' diameters greater than 4·6 nm and did not enter at low P, i.e. 38-kDa dextran (diameter 9 nm), 70-kDa dextran (11 nm) and 580-kDa dextran (27 nm) were strongly hindered or did not move through the wall detectably. As a consequence, gold colloid at high P and FITC–dextran at low P gave similar dimensions for matrix interstices (Fig. 9A and B).
Fig. 9.
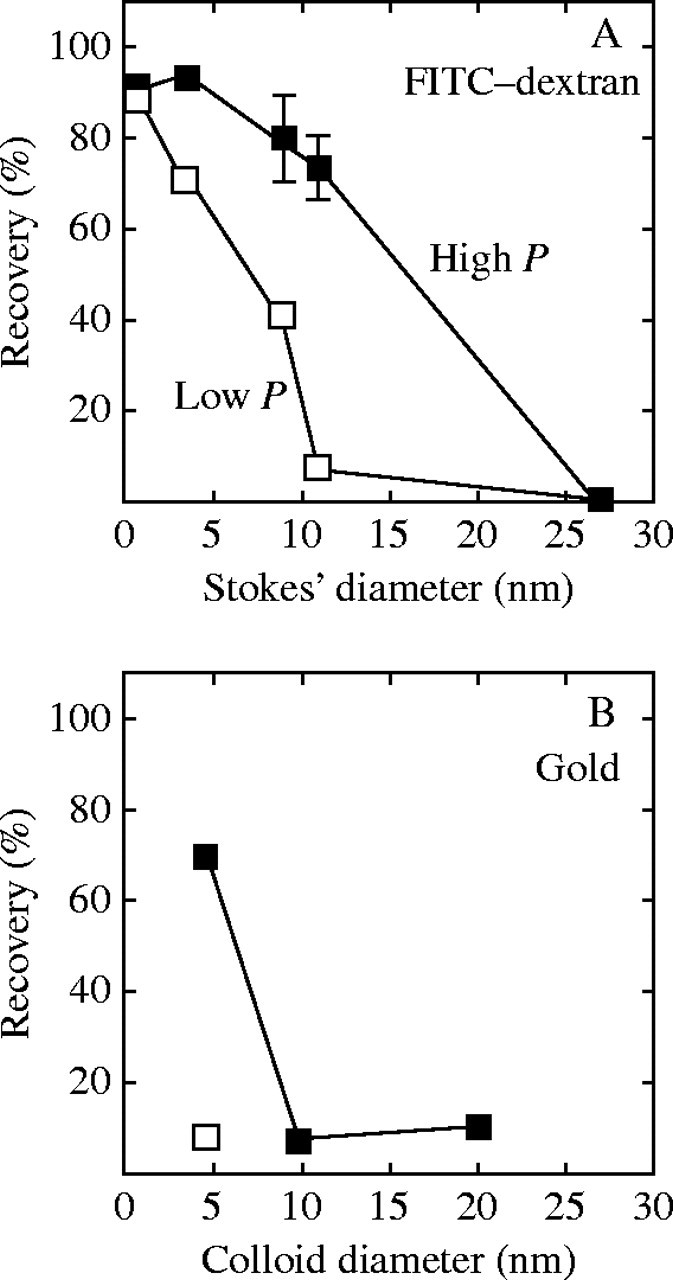
Summary of trans-wall movement of FITC–dextran (A) and gold colloid (B) of various diameters at high and low P. Pwas 0·5 MPa (filled symbols) or 0·05 MPa (open symbols) except in (B) where P was 0·25 MPa (open square). Recovery is percentage of originally injected FITC, FITC–dextran or gold colloid that was found in the external bathing water. Data are derived from the final recoveries shown in Figs 5 and 6. Stokes' diameters of dextrans are from Peters (1986) and Read and Bacic (1996), and for FITC from Ekani-Nkodo and Fygenson (2003).
Movement of large molecules into small openings
At high P, however, 38-kDa and 70-kDa dextran moved through the wall. The larger of these had a Stokes' diameter of 11 nm or about twice the gold-derived diameter of 4·6 nm in the wall interstices (Fig. 9A). It should be noted that gold colloid of 9·8 nm scarcely moved through the wall at any P (Fig. 9B).
How could large dextrans move into a wall that excluded gold of similar dimensions? Part of the mechanism might be explained by the hydrodynamic nature of the Stokes' diameter for dextrans, which are derived from relatively dilute polymer solutions (Williams et al., 1998). Axial asymmetry of dextran in solution appears to be significant (Scott et al., 2000), and a small molecular cross-section might allow entry into the matrix while the larger axial dimension might be excluded (Muthukumar, 2003; Wei and Srivastava, 2003). Laurent and Killander (1964) visualized soluble dextrans as flexible rods thickened by branching of the dextran. With the branching, they determined a typical cross-sectional diameter of 0·7 nm for the rods, which is much smaller than the interstices in the wall matrix in the present work. When P concentrated the smaller dextrans against the inner wall face, the polymer ends would be similarly concentrated, and end-first entry would accelerate. By contrast, gold colloids would not present a molecular cross-section smaller than the colloid diameter and would be excluded regardless of the concentration.
The asymmetry decreases with molecular weight (Scott et al., 2000) probably because molecule ends become increasingly hidden within the polymer volume. For larger dextrans to enter the wall, the whole molecule or molecular segment would need to be deformed. When P concentrated the dextran, the molecules pressing against each other might have created momentary asymmetry that deformed the molecules sufficiently to enter. Also, the large P difference across the inner face of the matrix would press molecules against the face, providing a mechanical force (Muthukumar, 2003) that might deform the whole molecule or segment of molecule sufficiently. In these ways, the entropic barrier to entry would be overcome and would require more energy than starting a polymer end because the entire polymer or polymer segment would need to assume entropically less favourable conformations (Muthukumar, 1999). Because P and its accompanying concentration effects would supply the energy for large-scale deformation, a threshold P would appear above which wall entry could begin.
Once entry began above the threshold, the rest of the molecule could follow from the energy supplied by P and its concentrating effects. Above the threshold, the 70-kDa dextran eventually moved through the wall as rapidly as the 38-kDa dextran. The 70-kDa dextran acted as if, once the initial entropic barrier to entry was overcome, subsequent small-scale molecular unfolding occurred with only a small additional energy, i.e. involving only a few bonds at a time. That this scenario occurred at the inner wall face was shown in Fig. 8B where the major barrier to polymer movement was the initial entry into the wall. The appearance of additional free energy barriers to entry as polymers become larger is predicted by computer simulations that indicate larger segments of the molecule must enter the wall before the entire molecule can successfully deform and escape into the wall (Muthukumar, 2001). The appearance of a molecular weight-dependent P threshold in the present data may be interpreted as experimental confirmation of this prediction.
Other effects on the polymers seem much less likely to account for the accelerated entry caused by P. When high P concentrated the polymer solutions, it could have caused increased viscosity or even transitions to a solid or gel-like state, but these changes would hinder entry, not accelerate it.
After fully entering the matrix, the dextran was totally enclosed by the wall interstices, which were at least 5 μm long (the walls were about 5 μm thick). At this length, the interstices were many times the extended length of the largest dextran used in this work. Because the polymer was subjected only to atmospheric pressure in the matrix, each molecule's net movement would be directed by diffusion by a reptation-type mechanism (Nykypanchuk et al., 2002) resulting from chain flexibility and strong axial asymmetry due to being constrained by the surrounding matrix (Granath, 1958; Munch et al., 1979; Amsden, 2002). During reptation the rate of translocation could be hindered by transient wall/polymer interactions (Davidson and Deen, 1988), which become significant when polymers diffuse through narrow channels that are longer than the extended polymer. Diffusion rates under these conditions have been observed to be dependent on molecular weight (Meller et al., 2001; Loeble et al., 2003; Slonkina and Kolomeisky, 2003).
Therefore, at the P found in living cells, four kinds of molecular movement into the cell walls could be identified. Small molecules such as inorganic salts or inorganic carbon, sugars, or growth regulators are expected to move readily into the wall matrix where they would be unaffected by P (Fig. 10A). Larger molecules were hindered as their Stokes' diameters approached the diameter of wall interstices. P increased the rate of polymer entry (Fig. 10B). Polymers with Stokes' diameters larger than the wall interstices entered by starting a molecular end or fold, then unfolding into the opening aided by concentrating and deforming energy of P (Fig. 10C). Polymers with Stokes' diameters more than twice the diameter of the wall openings seemed to have their ends obscured in the polymer coils and branches, and P had to deform the whole polymer or large parts of the polymer before wall entry began, causing a threshold P-dependence (Fig. 10D). Non-deformable particles such as gold colloids of the same diameter did not enter the wall (Fig. 10E), indicating that large polymer entry was not caused primarily by enlargement of wall interstices but rather by effects of P on the dimensions of the entering polymers themselves.
Fig. 10.
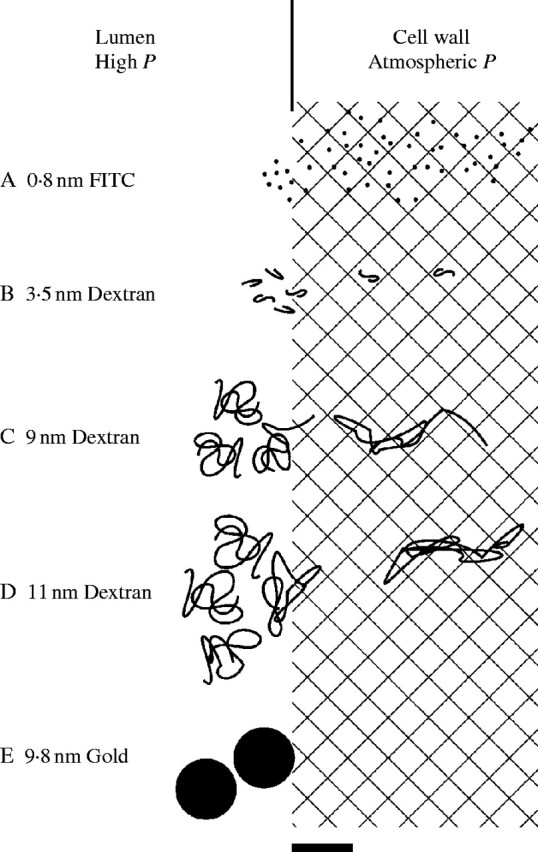
Diagrammatic representation of molecular movement into the primary wall at P of 0·5 MPa found in living Chara cells. (A) Molecules smaller than wall interstices (cross-hatched). (B) Polysaccharides near the dimensions of the interstices. (C) Polysaccharides having diameter as much as twice the dimensions of the interstices, starting an end into the wall aided by P. (D) Polysaccharides having diameter more than twice the dimensions of the interstices and having whole molecule or segment of molecule being deformed by P. (E) Gold colloids at about twice the dimensions of the interstices cannot be deformed and do not enter wall significantly. The molecules, colloids and wall interstices are drawn to scale. Scale bar = 10 nm.
The deformation of the dextrans could not have been an artefact from small molecules contaminating the dextrans (Preston et al., 1987) because unconjugated FITC and 4·4-kDa FITC–dextran moved through the wall relatively easily compared with the larger molecules. If small contaminants had been present in the large FITC–dextrans, movement of the small molecules would have been detected at low P. Further purification or size-fractionation of the dextrans was unnecessary, although polydispersity was probably present involving larger molecular weights than the quoted values. Their presence would not have altered the conclusions.
Wall deposition and cell growth
Figure 11 shows a correspondence between the movement of 70-kDa FITC–dextran and the growth rate of a living cell when P was varied in Chara. While the strict correspondence could be coincidental, it indicates that large polymers would enter the wall more rapidly as P increases the growth rate, potentially contributing to cell wall enlargement. Typically, the degree of polymerization is large for polysaccharides being delivered to the cell wall. In polymers isolated from pea cell walls, Talbot and Ray (1992) measured molecular weights of 30-kDa for xyloglucans and as high as 1000-kDa for pectins, although the latter tended to aggregate after isolation. Because these matrix polysaccharides are vesicle-derived and synthesized in the protoplasm, they appear to be delivered nearly fully formed to the inner face of the cell wall. In multicellular plants, the degree of polymerization could change because of transglycosidase activity in the walls, especially in the xyloglucan portion of the hemicellulosic matrix (Fry et al., 1992; Nishitani and Tominaga, 1992). However, much of this activity depends on enzyme recognition of specific xyloglucan oligosaccharides that are lacking in Chara walls (Popper and Fry, 2003). As a result, it seems likely that the molecular weights of FITC–dextran used in the present study would simulate the size and motion of fully formed native matrix polymers delivered to the wall.
Fig. 11.

P-dependent movement of 70-kDa dextran through an isolated primary cell wall compared with the P-dependent growth of a cell. Dextran recovery is percentage of maximum recovery at 0·5 MPa in Fig. 5D (Recovery, closed symbols). Growth is from a living internode cell of C. corallina at normal P of 0·52 MPa (Growth Rate, open symbols), described in Proseus et al. (2000).
CONCLUSIONS
These results establish a role for P in the deposition of wall polymers in addition to its generally accepted role in extending the walls during the growth process. The fact that similar P are involved in polysaccharide entry and wall enlargement has important implications for coordinating in vivo wall deposition and growth. P provides the force for polymer deposition in the wall mainly via a mechanism of concentration and P-induced deformation of the polymers themselves. The strain of the matrix caused by P, while readily detected and central to wall enlargement, did not account for polymer entry. Polymer deformation allowed entry of polymers larger than the interstices in the surrounding wall. It appears that this P effect would allow the protoplast to supply large polymers and have them enter the wall or move through where they could play diverse roles.
The selectivity for polymer entry occurred at the inner wall face because steep gradients in concentration and P existed there and provided the energy for polymer deformation. The threshold P appeared to increase as molecular weights increased, until normal P was insufficient to move the polymers into the wall. In this situation, the largest polymers remained pressed against the inner wall face where, in the living cell, they would encase new cellulose microfibrils being produced at the plasma membrane.
Acknowledgments
We thank Dr Kirk Czymmek of the Delaware Biotechnology Institute for transmission electron micrographs giving the dimensions of the gold colloids used in this work, and Professor Norman Wagner of the University of Delaware Department of Chemical Engineering for many stimulating discussions. Early phases of this work were supported by DOE grant DE-FG02-87ER13776 to J.S.B. Later phases were supported by an Okie Fellowship from the College of Marine Studies to T.E.P.
LITERATURE CITED
- Amsden B. 2002. Modeling solute diffusion in aqueous polymer solutions. Polymer 43: 1623–1630. [Google Scholar]
- Baron-Epel O, Gharyal PK, Schindler M. 1988. Pectins as mediators of wall porosity in soybean cells. Planta 175: 389–395. [DOI] [PubMed] [Google Scholar]
- Berestovsky GN, Ternovsky VI, Kataev AA. 2001. Through pore diameter in the cell wall of Chara Journal of Experimental Botany 52: 1173–1177. [PubMed] [Google Scholar]
- Bonner J. 1934. Studies on the growth hormone of plants. V. The relation of cell elongation to cell enlargement. Proceedings of the National Academy of Sciences of the USA 20: 393–397. [DOI] [PMC free article] [PubMed] [Google Scholar]
- Bret-Harte MS, Baskin TI, Green PB. 1991. Auxin stimulates both deposition and breakdown of material in the pea outer epidermal cell wall, as measured interferometrically. Planta 185: 462–471. [DOI] [PubMed] [Google Scholar]
- Carpita NC, Gibeaut DM. 1993. Structural models of primary cell walls in the flowering plants: consistency of molecular structure with the physical properties of walls during growth. Plant Journal 3: 1–30. [DOI] [PubMed] [Google Scholar]
- Casero PJ, Knox JP. 1995. The monoclonal antibody JIM5 indicates patterns of pectin deposition in relation to pit fields at the plasma-membrane-face of tomato pericarp cell walls. Protoplasma 188: 133–137. [Google Scholar]
- Cleland RE. 1971. Cell wall extension. Annual Review of Plant Physiology 22: 197–222. [Google Scholar]
- Davidson MG, Deen WM. 1988. Hindered diffusion of water soluble macromolecules in membranes. Macromolecules 21: 3474–3481. [Google Scholar]
- Ekani-Nkodo A, Fygenson D. 2003. Size exclusion and diffusion of fluoresceinated probes within collagen fibrils. Physical Review E 67: 021909-1-7. [DOI] [PubMed] [Google Scholar]
- Fleischer A, O'Neill MA, Ehwald R. 1999. The pore size of non-graminaceous plant cell wall is rapidly decreased by borate ester cross-linking of the pectic polysaccharide rhamnogalacturonan II. Plant Physiology 121: 829–838. [DOI] [PMC free article] [PubMed] [Google Scholar]
- Fry SC, Smith RC, Renwick KF, Martin DJ, Hodge SK, Matthews KJ. 1992. Xyloglucan endotransglycosylase, a new wall-loosening enzyme activity from plants. Biochemical Journal 282: 821–828. [DOI] [PMC free article] [PubMed] [Google Scholar]
- Giddings TH Jr, Brower DL, Staehelin LA. 1980. Visualization of particle complexes in the plasma membrane of Micrasterias denticulata associated with the formation of cellulose fibrils in primary and secondary cell walls. Journal of Cell Biology 84: 327–339. [DOI] [PMC free article] [PubMed] [Google Scholar]
- Granath KA. 1958. Solution properties of branched dextrans. Journal of Colloid Science 13: 308–328. [Google Scholar]
- Kamiya N, Tazawa M, Takata T. 1962. Water permeability of the cell wall in Nitella Plant and Cell Physiology 3: 285–292. [Google Scholar]
- Kamiya N, Tazawa M, Takata T. 1963. The relation of turgor pressure to cell volume in Nitella with special reference to mechanical properties of the cell wall. Protoplasma 57: 501–521. [Google Scholar]
- Kimura S, Laosinchai W, Itoh T, Cui X, Linder CR, Brown, RM Jr. 1999. Immunogold labeling of rosette terminal cellulose-synthesizing complexes in the vascular plant Vigna angularis The Plant Cell 11: 2075–2085. [DOI] [PMC free article] [PubMed] [Google Scholar]
- Kohorn B. 2000. Plasma membrane-cell wall contacts. Plant Physiology 124: 31–38. [DOI] [PMC free article] [PubMed] [Google Scholar]
- Laurent TC, Killander J. 1964. A theory of gel filtration and its experimental verification. Journal of Chromatography 14: 317–330. [Google Scholar]
- Loeble HC, Randel R, Goodwin SP, Matthai CC. 2003. Simulation of polymer translocation through a channel. Physical Review E 67: 041913-1-5. [DOI] [PubMed] [Google Scholar]
- Loescher WH, Nevins DJ. 1973. Turgor-dependent changes in Avena coleoptile cell wall composition. Plant Physiology 52: 248–251. [DOI] [PMC free article] [PubMed] [Google Scholar]
- McCann MC, Roberts K. 1994. Changes in cell wall architecture during cell elongation. Journal of Experimental Botany 45: 1683–1691. [Google Scholar]
- McCann MC, Hammouri M, Wilson R, Belton P, Roberts K. 1992. Fourier transform microspectroscopy is a new way to look at the plant cell wall. Plant Physiology 100: 1940–1947. [DOI] [PMC free article] [PubMed] [Google Scholar]
- McCann MC, Roberts K, Wilson RH, Gidley MJ, Gibeaut DM, Kim J-B, Carpita NC. 1995. Old and new ways to probe plant cell wall architecture. Canadian Journal of Botany 73 (Suppl. 1): S103–S113. [Google Scholar]
- McCann MC, Wells B, Roberts K. 1990. Direct visualization of the cross-links in the primary cell wall. Journal of Cell Science 96: 323–334. [Google Scholar]
- Meeuse ADJ. 1957. Plasmodesmata (vegetable kingdom). Protoplasmatologia IIA1a: 1–43. [Google Scholar]
- Meiners S, Gharyal K, Schindler M. 1991. Permeabilization of the plasmalemma and wall of soybean cells to macromolecules. Planta 184: 443–447. [DOI] [PubMed] [Google Scholar]
- Meller A, Nivon L, Branton D. 2001. Voltage-driven translocations through a nanopore. Physical Review Letters 86: 3435–3438. [DOI] [PubMed] [Google Scholar]
- Metraux J-P, Richmond PA, Taiz L. 1980. Control of cell elongation in Nitella by endogenous cell wall pH gradients. Plant Physiology 65: 204–210. [DOI] [PMC free article] [PubMed] [Google Scholar]
- Moore PJ, Swords KMM, Lynch MA, Staehelin LA. 1991. Spatial organization of the assembly pathways of glycoproteins and complex polysaccharides in the Golgi apparatus of plants. Journal of Cell Biology 112: 589–602. [DOI] [PMC free article] [PubMed] [Google Scholar]
- Morrison JC, Greve LC, Richmond PA. 1993. Cell wall synthesis during growth and maturation of Nitella internodal cells. Planta 189: 321–328. [DOI] [PubMed] [Google Scholar]
- Munch WD, Zester LP, Anderson JL. 1979. Rejection of polyelectrolytes from microporous membranes. Journal of Membrane Science 5: 77–102. [Google Scholar]
- Muthukumar M. 1999. Polymer translocation through a hole. Journal of Chemical Physics 111: 10371–10374. [Google Scholar]
- Muthukumar M. 2001. Translocation of a confined polymer through a hole. Physical Review Letters 86: 3188–3191. [DOI] [PubMed] [Google Scholar]
- Muthukumar M. 2003. Polymer escape through a nanopore. Journal of Chemical Physics 118: 5174–5184. [Google Scholar]
- Nishitani K, Tominaga R. 1992. Endo-xyloglucan transferase, a novel class of glycosyltransferase that catalyses transfer of a segment of xyloglucan molecule to another xyloglucan molecule. Journal of Biological Chemistry 267: 21058–21064. [PubMed] [Google Scholar]
- Northcote DH, Pickett-Heaps JD. 1966. A function of the Golgi apparatus in polysaccharide synthesis and transport in root-cap cells of wheat. Biochemical Journal 98: 159–167. [DOI] [PMC free article] [PubMed] [Google Scholar]
- Nykypanchuk D, Strey HH, Hoagland DA. 2002. Brownian motion of DNA confined within a two-dimensional array. Science 297: 987–990. [DOI] [PubMed] [Google Scholar]
- Perrin R, Wilkerson C, Keegstra K. 2001. Golgi enzymes that synthesize plant cell wall polysaccharides: finding and evaluating candidates in the genomic era. Plant Molecular Biology 47: 115–130. [PubMed] [Google Scholar]
- Peters R. 1986. Fluorescent microphotolysis to measure nucleocytoplasmic transport and intracellular mobility. Biochemica et Biophysica Acta 864: 305–359. [DOI] [PubMed] [Google Scholar]
- Popper ZA, Fry SC. 2003. Primary cell wall composition of bryophytes and charophytes. Annals of Botany 91: 1–12. [DOI] [PMC free article] [PubMed] [Google Scholar]
- Preston RA, Murphy RF, Jones EW. 1987. Apparent endocytosis of fluorescein isothiocyanate-conjugated dextran by Saccaromyces cerevisiae reflects uptake of low molecular weight impurities, not dextran. Journal of Cell Biology 105: 1981–1987. [DOI] [PMC free article] [PubMed] [Google Scholar]
- Preston RD. 1974.The physical biology of plant cell walls. London: Chapman and Hall. [Google Scholar]
- Proseus TE, Ortega, JKE, Boyer JS. 1999. Separating growth from elastic deformation during cell enlargement. Plant Physiology 119: 775–784. [DOI] [PMC free article] [PubMed] [Google Scholar]
- Proseus TE, Zhu G-L, Boyer JS. 2000. Turgor, temperature, and the growth of plant cells: using Chara corallina as a model system. Journal of Experimental Botany 51: 1481–1494. [DOI] [PubMed] [Google Scholar]
- Ray PM. 1967. Radioautographic study of cell wall deposition in growing plant cells. Journal of Cell Biology 35: 659–674. [DOI] [PMC free article] [PubMed] [Google Scholar]
- Read SM, Bacic A. 1996. Cell wall porosity and it's determination. Modern Methods of Plant Analysis 17: 63–80. [Google Scholar]
- Roberts K. 1994. The plant extracellular matrix: in a new expansive mood. Current Opinion in Cell Biology 6: 688–694. [DOI] [PubMed] [Google Scholar]
- Scott D, Coleman PJ, Mason RM, Levick JR. 2000. Action of polysaccharides of similar average mass but different molecular volume and charge on fluid drainage through the synovial interstitium in rabbit knees. Journal of Physiology 528·3: 609–618. [DOI] [PMC free article] [PubMed] [Google Scholar]
- Shepherd VA, Goodwin PB. 1989. The porosity of permeabilised Chara cells. Australian Journal of Plant Physiology 16: 213–219. [Google Scholar]
- Slonkina E, Kolomeisky AB. 2003. Polymer translocation through a long nanopore. Journal of Chemical Physics 118: 7112–7118. [Google Scholar]
- Steudle E, Zimmermann U. 1974. Determination of the hydraulic conductivity and reflection coefficients in Nitella flexilis by means of direct cell-turgor pressure measurements. Biochimica et Biophysica Acta 332: 399–412. [Google Scholar]
- Taiz L. 1984. Plant cell expansion: regulation of cell wall mechanical properties. Annual Review of Plant Physiology 35: 585–657. [Google Scholar]
- Taiz L, Metraux JP, Richmond PA. 1981. Control of cell expansion in the Nitella internode. In: Kiermeyer O, ed. Cytomorphogenesis in plants. New York: Springer-Verlag, 231–264. [Google Scholar]
- Talbot LD, Ray PM. 1992. Molecular size and separability features of pea cell wall polysaccharides. Plant Physiology 98: 357–368. [DOI] [PMC free article] [PubMed] [Google Scholar]
- Tepfer M, Taylor IEP. 1981. The permeability of plant cell walls as measured by gel filtration chromatography. Science 213: 761–763. [DOI] [PubMed] [Google Scholar]
- Titel C, Woehlecke H, Afifi I, Ehwald R. 1997. Dynamics of limiting cell wall porosity in plant suspension cultures. Planta 203: 320–326. [Google Scholar]
- Thompson EW, Preston RD. 1968. Evidence for a structural role of protein in algal cell walls. Journal of Experimental Botany 19: 690–697. [Google Scholar]
- Wei C, Srivastava, D. 2003. Theory of transport of long polymer molecules through carbon nanotube channels. Physical Review Letters 91: 235901-1-4. [DOI] [PubMed] [Google Scholar]
- Williams JC Jr, Mark LA, Eichholtz S. 1998. Partition and permeation of dextran in polyacrylamide gel. Biophysical Journal 75: 493–502. [DOI] [PMC free article] [PubMed] [Google Scholar]
- Zhu GL, Boyer JS. 1992. Enlargement in Chara studied with a turgor clamp: growth rate is not determined by turgor. Plant Physiology 100: 2071–2080. [DOI] [PMC free article] [PubMed] [Google Scholar]