

Abstract
• Background and Aims Plastic responses to stress in components of reproduction can have important effects on plant fitness and can vary both within and between species. Responses may also depend on when in the life cycle stress occurs. Here, it is predicted that the timing of initiation of a stress, defoliation, would affect the pattern of plastic responses. These differences should occur because some components of reproduction, such as flower number, are determined earlier in a plant's life than others, such as individual seed mass.
• Methods To test this prediction, 50 % artificial defoliation treatments were initiated at four different times for Sesbania macrocarpa and S. vesicaria. Responses were measured in plant size, number of flowers, number of flowers/plant size, fruit set, number of seeds per fruit, individual seed mass and total seed mass per plant.
• Key Results For S. vesicaria, changes in the timing of stress changed the severity, but not the pattern of response. For S. macrocarpa, plastic responses to defoliation varied strikingly between early and late treatments. Late treatments resulted in over-compensation in this species. Sesbania macrocarpa was generally more plastic than S. vesicaria and the species showed opposite responses for most components of reproduction.
• Conclusions While there were effects of timing of defoliation and differences between species, the nature of these effects did not precisely fit our predictions. Our results suggest that differences in the length and flexibility of the life cycles of the two species allowed for unexpected variation in responses. For example, because flower production continued after the last treatment in S. vesicaria, responses were not constrained to reductions in individual seed mass.
Keywords: Phenotypic plasticity, components of reproduction, artificial defoliation, reproductive allocation, overcompensation, Sesbania macrocarpa, Sesbania vesicaria
INTRODUCTION
The environment varies over space and time at many scales. Because plants are sessile, it is important that they have the ability to respond to environmental heterogeneity. This ability of a single genotype to alter its phenotype in response to environmental conditions is commonly referred to as plasticity (Bradshaw, 1965; Schlichting, 1986; Sultan, 1987, 2000, 2001; Schlichting and Pigliucci, 1995, 1998). Plasticity in several classes of characters has been observed in many plant taxa in response to changes in the amount of water (Sultan and Bazzaz, 1993; Singh, 1995; Volis et al., 1998; Pigliucci and Kolodynska, 2002), nutrients (May and Killingbeck, 1995; Valladares et al., 2000) and light (Havens et al., 1995; Urbas and Zobel, 2000) and to herbivore damage (Koptur et al., 1996; Mabry and Wayne, 1997; Agrawal, 2000, 2001). This plasticity includes variation in resource allocation, morphology, physiology and reproduction (Marshall, 1989; Niesenbaum, 1996; Sugiyama and Bazzaz, 1997; McConnaughay and Coleman, 1999; Volis et al. 2002). Plasticity is of interest because it may affect individual fitness, the success of populations and even community-level interactions (Schlichting and Pigliucci, 1998; Sultan, 2001).
Plasticity in the components of plant reproduction in response to stress is particularly important for understanding the environments in which a species can produce offspring, for understanding the evolution of plastic responses, and for predicting economic consequences of stress on crop plants. For example, plant response to stress can be mitigated by the pattern of adjustment in the various components of reproduction: plant size, number of flowers, number of fruit per flower, number of ovules per fruit, number of seeds per ovule and seed size (Stephenson, 1980; Lee and Bazzaz, 1986; Gorchov, 1988). If a plant is stressed, one or more of these components must be affected; however, there is considerable disagreement as to which of these characters will be most affected.
It has long been thought that there is a common sequence of reproductive responses to stress. First fruit number is reduced, followed by a reduction in seed number per fruit and, finally, seed mass may be affected (Harper, et al., 1970; Stephenson, 1981). This pattern has been expected because of the hypothesis that reductions in seed mass will have particularly detrimental effects on plant fitness (Black, 1956; Bradshaw, 1965; Adams, 1967; Harper et al., 1970; Stanton, 1984; Susko and Lovett-Doust, 2000).
However, the prediction that seed mass will be conserved through reductions in other components of reproduction has not always been supported. In fact, any of the components of reproduction may respond to stress (e.g. Stephenson, 1980; Willson and Price, 1980; Marshall et al., 1986), and several data sets suggest that seed size may vary within a species (Lloyd, 1980; Stanton, 1984; Marshall et al., 1985a; Smith-Huerta and Vasek, 1987; Winn and Werner, 1987; Sultan and Bazzaz, 1993; Cheplick, 1995; Susko and Lovett-Doust, 2000; and Parciak, 2002).
A variety of responses to stress may occur because all of the components of reproduction affect fitness. That is, despite the importance of seed size to fitness, seed number is also crucial since it determines the maximum number of offspring that may be produced. In fact, seed number is one of the most important aspects of reproductive success in annual plants (Sugiyama and Bazzaz, 1997). Seed number is particularly important when only a small proportion of seeds reach safe sites, when seed predators are common or when seedling emergence is very low.
Previous studies using species of Sesbania show that variation in plasticity of the components of reproduction can occur among species. Sesbania vesicaria has large seed size and a strong correlation between seed size and seedling success (Marshall et al., 1985b; Marshall, 1986). When stressed this species aborts fruits and conserves seed mass, conforming to the general prediction (Marshall et al., 1986). In contrast, S. macrocarpa shows a very different response. This species has smaller seeds and shows less effect of seed size on seedling growth (Marshall et al., 1985b; Marshall, 1986). When stressed, most response is in seed abortion and seed mass (Marshall et al., 1986).
However, these results were obtained by starting experimental stress at a single time early in the plants' life cycles, the day that flowering began for each plant. Due to this early timing, a range of responses in components of reproduction was possible. Changes in the timing of the experiment may have given very different responses since the nature of plastic responses may depend on the developmental stage (Diggle, 1994; Pigliucci, 1998).
The components of reproduction represent a developmental sequence where some components are determined earlier than others (Fig. 1). Therefore, the pattern of plastic response may depend on the timing and duration of stress. After a plant has stopped flowering it can no longer change the number of flowers it has produced and it can no longer increase the total number of fruits. Thus, if resources increase late in the season, flower number cannot increase and, conversely, a stress that is initiated after flowering has stopped cannot affect total flower production. If a new stress begins very late in the growing season only seed mass can be adjusted as all other components of reproduction have already been determined. As a result, the developmental sequence may constrain the type of responses possible at any one time and stresses imposed at different times may have different effects on reproductive components. For example, when soybeans and black beans were exposed to drought at three developmental stages, flower number was reduced by early stress, seed number per pod was reduced by intermediate stress and individual seed mass was reduced by late stress (Son et al., 1996; Nielsen and Nelson, 1998; Desclaux et al., 2000). Therefore, our understanding of plastic responses to stress is incomplete if we confine our investigations to stress initiated at a single point in a plant's life history.
Fig. 1.
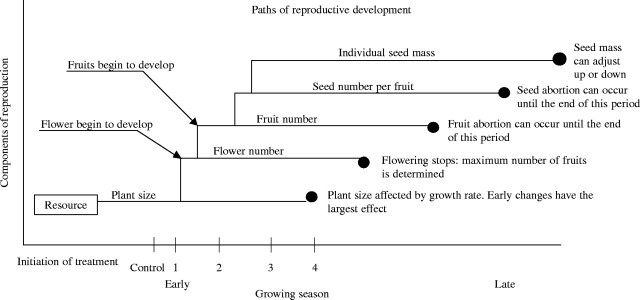
Reproduction represents a developmental series. Each path represents an interval of time in the reproductive cycle in which reproductive components can be adjusted. Circles at the end of each path represent the point in the growing season when that component can no longer be altered. Early in the growing season many components of reproduction can be adjusted. As the growing season proceeds, reproduction becomes developmentally constrained and fewer components can be changed. The period when each defoliation treatment would occur in the developmental series is indicated along the growing season axis.
A series of experimental defoliations of S. macrocarpa and S. vesicaria were used to address the relationship between time of stress and pattern of plasticity of components of reproduction. The following specific questions were asked:
Did experimental defoliation cause reductions in the components of reproduction? It was predicted that these stresses (i.e. defoliations) would affect the reproductive characters measured.
Did the time of initiation of stress affect the pattern of plasticity in components of reproduction within each species? It was predicted that early stress would allow responses in a variety of components of reproduction and late stress would affect only those components determined very late, such as seed mass.
Did the responses to stress and timing of stress differ between the species? It was predicted that responses would vary between the species when stress was early, but that when stress was administered very late in the life cycle the two species would be constrained to show the same responses.
MATERIALS AND METHODS
The species
Both species of Sesbania used in this study are large, annual legumes. They are self-compatible; seed size and number per fruit are indistinguishable between self- and outcross matings (D. Marshall, pers. Obs.). Both species grow in wet, disturbed habitats throughout the south-eastern United States. They germinate from March to May and bloom from August to September. Fruits mature in about 7 weeks.
Sesbania macrocarpa Muhl. ex Raf. produces, on average, 26 10-mg seeds per fruit while S. vesicaria Ell. produces, on average, two 220-mg seeds per fruit. Further details of the reproductive biology of these species are described elsewhere (Marshall et al. 1985a, b, 1986; Marshall, 1989).
Experimental methods
One hundred plants of each species were used in this experiment: 20 plants from each of five maternal sibships (called families) from each species. Seeds were collected from sites in central Texas. They were scarified for 30 min in concentrated sulfuric acid and then planted into 4 L pots in a 4 : 1 : 1 mixture of sand, peat and perlite in a greenhouse in Albuquerque, NM. Initially 2–4 seeds were planted in each pot; 2 weeks after germination the seedlings were thinned to one per pot. Plants were fertilized weekly with Peter's 20 : 20 : 20 fertilizer and bottom-watered. After a few weeks, roots grew out of the pots and into the water in the benches, just as roots in the field grow into the water table. Thus, plants had continuous access to water and, as a result grew quite large.
Seeds were planted in May. After the plants had grown for 2 months, flowering was triggered by manipulation of the light regime in the greenhouse. Overhead incandescent lights were turned on for 24 h for 4 d. The plants were then returned to the ambient light regime and they began flowering a few weeks later. The same trigger had been used to initiate flowering in a previous experiment (Marshall, 1989).
The 20 plants from each maternal family were stratified among ten blocks in the greenhouse, with two from each family in each block. Then, treatments were assigned at random within families such that four randomly chosen plants from each family were assigned to each treatment.
The 100 plants of each species were divided among five treatments as follows:
Control: no defoliation.
Treatment 1: defoliation beginning 5 weeks prior to flowering. The manipulation of the light regime started at the same time as this treatment.
Treatment 2: defoliation beginning at the time of flower initiation. This treatment began as soon as the first ten plants within a species showed flower buds.
Treatment 3: defoliation beginning 2 weeks after initiation of flowering.
Treatment 4: defoliation beginning 4 weeks after the initiation of flowering.
The dates on which treatments 2, 3 and 4 were initiated were slightly different for each species because they responded differently to the flowering trigger. Treatment 1 began on July 9, as that is the date the lighting regime was changed. For S. macrocarpa, treatment 2 began on August 16, treatment 3 on August 30, and treatment 4 on September 13. Because S. vesicaria began flowering later, treatment 2 began on September 13, treatment 3 on September 27, and treatment 4 on October 9. Had we not made this change, all of the treatments to S. vesicaria would have been initiated before flowering.
Defoliation was performed by removing half of each leaf on each plant. Because the Sesbania species have pinnately compound leaves, for defoliation the central rachis of the leaf was cut once halfway along its length. Once defoliation started, new leaves were located and clipped once each week. Removal of half of the leaf tissue has been shown to be sufficient to reduce reproduction in these species of Sesbania (Marshall et al., 1986).
Plants continued to grow for several months after the treatments began. Most S. macrocarpa plants continued to produce flowers until the end of September and a few plants continued to flower until November. Most S. vesicaria plants flowered until November. Plants were harvested in November and December when all fruits had matured and the plants were dry and brown.
Data collection
As flowers developed, each inflorescence was marked with a small plastic tag. New inflorescences were marked and developing fruits were examined every 2 weeks, until fruit maturation. Counts were made of all buds, flowers, pedicels where flowers or fruits had aborted, and fruits. Thus, a complete record was obtained of the numbers of flowers and fruits produced by each plant.
At maturity, all fruits were collected and plant size was measured in the following manner: measurements (to the nearest cm) were made of both the height of each plant from the soil surface to the apical meristem and of the length of each branch. The total number of branches per plant was also counted.
From the mature fruits, the following were recorded: the number of good seeds per fruit, the number of aborted seeds per fruit (indicated by small, shrivelled ovules), the mass of individual seeds and the total mass of seeds per fruit. For S. macrocarpa five randomly selected seeds per fruit were individually weighed. This was repeated for ten fruits per plant. For S. vesicaria both fruit number and seed number were smaller; therefore, all seeds (one or two) within each fruit were weighed.
Four additional variables were calculated from the measured variables. Plant size was estimated as the sum of plant height and the length of all branches. This takes into account both differences in height and in tendency to branch. Because we wanted to separate the effects of plant size on flower production from those of increases in proportional allocation to flower production, we divided total flower number by plant size to produce flowers/size. Fruit set was also calculated as total fruits produced/total flowers produced and total reproduction was calculated as total number of seeds produced × mean seed mass.
Analysis
In order to ask whether there were overall treatment effects on reproduction, a MANOVA was first performed for each species using all reproductive variables as dependent variables and maternal family, block, defoliation treatment, and the interaction between block and defoliation treatment as independent variables. Then, for each species, more detailed effects of defoliation treatment on reproduction were analysed using ANOVAs where plant size, total flower number, total fruit number, flowers/size, fruit set, good seeds/fruit, individual seed mass and total reproduction were the dependent variables. Maternal family, block, defoliation treatment and the interaction between block and defoliation treatment were the independent variables. Because there was a large number of blocks (ten) and only 100 plants per species, inclusion of all possible interactions was not feasible. We chose to examine the block by treatment effect rather than other possible interaction effects as our primary interest was the environmental effects on character means. For the analysis of individual seed mass, number of good seeds/fruit was used as a covariate. A mixed model was used in which block and treatment were fixed effects and maternal family was a random effect. Variables were measured and analysed at the same scale; that is plant size, total flower number, total fruit number, flowers/size, fruit set, and total reproduction were analysed at the level of the plant, good seeds/fruit at the level of the fruit, and individual seed mass at the level of the seed. Following the ANOVAs, Tukey tests were performed to compare the means among treatments. To satisfy the assumption of normality, fruit set was arcsine square-root transformed prior to analysis.
The effects of treatment between the species were also compared using a second set of ANOVAs. Again, plant size, total number of flowers, total number of fruits, flowers/size, fruit set, good seeds/fruit, individual seed mass and total reproduction were the dependent variables. However, in this case, species, block, treatment, the species by treatment interaction and the block by treatment interaction were the independent variables. All of the independent variables were treated as fixed.
Patterns of plasticity were examined in several ways. First, coefficients of variation (CVs) within and between species were examined. Because CVs are on the same scale for all variables, they allow comparison of the amount of plasticity among characters and between species. Next, we looked for significant species by treatment effects in the ANOVAs as these indicate cases where response to treatment differed between the species. Finally, correlation coefficients were calculated between the treatment means of each species for each variable. This allowed us to ask whether the direction of response to treatments was the same for each species. Since we used only five treatments, there were only five pairs of points for each correlation. With such a small sample size we expected few significant correlations (the correlation coefficient must be nearly 0·9 to be significant at P < 0·05 at our sample size). However, we were interested in the magnitude and sign of even non-significant correlation coefficients.
RESULTS
The defoliation treatments were sufficient to affect overall reproduction in both species. MANOVAs using all measures as dependent variables reveal an overall effect of treatment for both species (for Wilk's lambda, P = 0·0003 and P < 0·0001 for the overall effect of treatment in S. macrocarpa and S. vesicaria, respectively). Total numbers of flowers and fruits differed significantly among treatments for both species (Tables 1–3). Total reproduction (total mass of seeds produced per plant) was significantly affected by treatment for S. vesicaria and approached significance for S. macrocarpa (Tables 1–3). Interestingly, however, the effect of treatment was not always to reduce reproduction. Flower production, fruit production and total reproduction tended to be higher in the latest defoliation treatment (treatment 4) than in the control for S. macrocarpa (Table 1).
Table 1.
Means for each component of reproduction in Sesbania macrocarpa and S. vesicaria across five defoliation treatments
| Species |
||||
|---|---|---|---|---|
| Component of reproduction |
Treatment |
S. macrocarpa |
S. vesicaria |
|
| Size (cm) | 1 | 356·8b | 174·2b | |
| 2 | 411·5b | 191·2ab | ||
| 3 | 554·3ab | 200·4a | ||
| 4 | 690·1a | 193·2ab | ||
| Control | 522·7ab | 205·1a | ||
| Total number of flowers | 1 | 116c | 52a | |
| 2 | 157bc | 49a | ||
| 3 | 202ab | 49a | ||
| 4 | 228a | 55a | ||
| Control | 193ab | 53a | ||
| Total number of fruits | 1 | 26b | 11b | |
| 2 | 28b | 11b | ||
| 3 | 37ab | 13ab | ||
| 4 | 51a | 14ab | ||
| Control | 36b | 15a | ||
| Flowers/size | 1 | 0·35a | 0·30a | |
| 2 | 0·41a | 0·25a | ||
| 3 | 0·36a | 0·24a | ||
| 4 | 0·36a | 0·28a | ||
| Control | 0·38a | 0·25a | ||
| Fruit set (transformed for analysis) | 1 | 0·22a | 0·23a | |
| 2 | 0·19a | 0·26a | ||
| 3 | 0·20a | 0·26a | ||
| 4 | 0·22a | 0·27a | ||
| Control | 0·19a | 0·29a | ||
| Number of good seeds per fruit | 1 | 19·7c | 1·68a | |
| 2 | 22·5a | 1·61a | ||
| 3 | 20·7bc | 1·59a | ||
| 4 | 21·9ab | 1·64a | ||
| Control | 20·4bc | 1·58a | ||
| Individual seed mass (mg) | 1 | 10·44a | 180·8c | |
| 2 | 8·79c | 199·6a | ||
| 3 | 9·03b | 190·5b | ||
| 4 | 9·04b | 190·2b | ||
| Control | 9·05b | 195·1ab | ||
| Total reproduction per plant (g) | 1 | 4·98b | 3·39c | |
| 2 | 5·49b | 3·89bc | ||
| 3 | 6·96ab | 3·98abc | ||
| 4 | 10·69a | 4·61ab | ||
| Control | 6·67ab | 5·09a | ||
Means for a variable within a species with different superscripts are significantly different according to a Tukey's Studentized Range test (P < 0·05).
Table 2.
P-values for analysis of variance in components of reproduction for Sesbania macrocarpa.
| Independent variable in an ANOVA |
||||||||||
|---|---|---|---|---|---|---|---|---|---|---|
| Component of reproduction |
Sample size |
Family |
Block |
Treatment |
Block × Treatment |
R2 |
||||
| Size | 100 | 0·050 | 0·0877 | 0·0560 | ns | 0·61 | ||||
| Total number of flowers1 | 100 | 0·0012 | 0·0098 | 0·001 | ns | 0·75 | ||||
| Total number of fruits1 | 100 | 0·012 | ns | 0·001 | ns | 0·65 | ||||
| Flowers/size1 | 100 | ns | 0·012 | ns | ns | 0·60 | ||||
| Fruit set (transformed)1 | 100 | 0·001 | 0·086 | ns | ns | 0·74 | ||||
| Number of good seeds per fruit2 | 1033 | 0·0001 | 0·0001 | 0·0001 | 0·0001 | 0·26 | ||||
| Individual seed mass3 | 5129 | 0·0001 | 0·0001 | 0·0001 | 0·0001 | 0·39 | ||||
| Total reproduction11 | 100 | ns | ns | 0·076 | ns | 0·50 | ||||
In the model, family was treated as a random effect and number of good seeds per fruit was included as a covariate for analysis of average individual seed mass. ns, not significant.
Variable was measured and analysed at the level of the plant.
Variable was measured and analysed at the level of the fruit.
Variable was measured and analysed at the level of the seed.
Table 3.
P-values for analysis of variance in components of reproduction for Sesbania vesicaria
| Independent variable in an ANOVA |
||||||||||
|---|---|---|---|---|---|---|---|---|---|---|
| Component of reproduction |
Sample size |
Family |
Block |
Treatment |
Block × Treatment |
R2 |
||||
| Size | 100 | ns | 0·001 | 0·0003 | 0·0025 | 0·70 | ||||
| Total number of flowers1 | 100 | 0·0027 | 0·0001 | 0·0295 | 0·0001 | 0·83 | ||||
| Total number of fruits1 | 100 | 0·0001 | 0·0001 | 0·0005 | 0·0002 | 0·78 | ||||
| Flowers/size1 | 100 | 0·0010 | 0·0001 | 0·0713 | 0·0014 | 0·76 | ||||
| Fruit set (transformed)1 | 100 | ns | ns | ns | ns | 0·53 | ||||
| Number of good seeds perfruit2 | 1250 | 0·0010 | 0·0134 | ns | 0·0006 | 0·084 | ||||
| Individual seed mass3 | 2022 | 0·0001 | 0·0001 | 0·0001 | 0·0001 | 0·42 | ||||
| Total Reproduction11 | 100 | 0·0071 | 0·0001 | 0·0001 | 0·0001 | 0·82 | ||||
In the model, family was treated as a random variable, and number of good seeds per fruit was included as a covariate for analysis of average individual seed mass. ns, not significant.
Variable was measured and analyzed at the level of the plant.
Variable was measured and analyzed at the level of the fruit.
Variable was measured and analyzed at the level of the seed.
Pattern of plasticity in response to defoliation, S. macrocarpa
The most dramatic responses to stress in S. macrocarpa were in plant size and in variables that are directly affected by plant size, such as total number of flowers and total number of fruits (Tables 1, 2). For the most severe defoliation treatment, treatment 1, reductions from control were 32 %, 24 %, 28 %, and 25 % for plant size, total number of flowers, total number of fruits, and total reproduction, respectively. The effect on these reproductive variables was primarily a consequence of variation in plant size, as the number of flowers/size was unaffected by the treatment (Tables 1, 2). While number of good seeds per fruit and individual seed mass also differed significantly between treatments, the magnitude of the effect was small (Tables 1, 2). The pattern of response appears to be different for the four defoliation treatments (Fig. 2A). In Fig. 2A (and 2B) changes in components of reproduction are illustrated by lines that have a positive or negative slope. Treatments 1 and 2 show a reduction in plant size, meaning that growth rate was reduced after defoliation, while treatment 4 shows an increase in plant size presumably due to increased growth after defoliation. With the exception of a moderate, but not significant reduction in fruit set for treatment 1, the lines for treatments 1–3 are comparatively flat after the change in plant size (Fig. 2A). Treatment 4, however, shows a drop (not significant) in flowers/size and then modest increases in the remaining variables (Table 1, Fig. 2A).
Fig. 2.
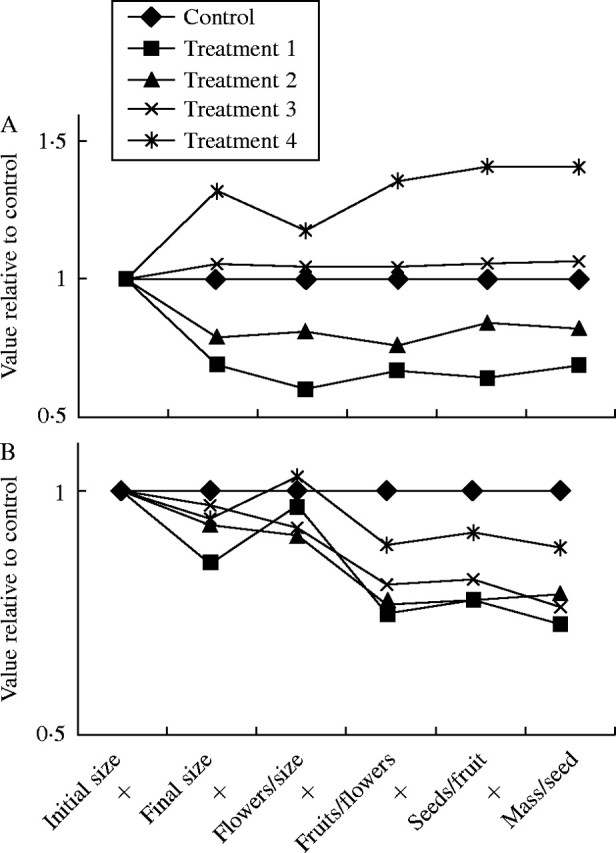
Cummulative effects of defoliation on the components of reproduction in (A) Sesbania macrocarpa and (B) S. vesicaria. The points on the graph were calculated in two steps. First, each component of reproduction was calculated as a percentage of the control. Then the percentages were multiplied by the factors indicated on the x-axis to determine the cumulative effect on reproduction. The product of all of the components of reproduction is total seed mass per plant. Treatments 1–4 are defoliation treatments initiated at different times in the growing season with treatment 1 initiated earliest and treatment 4 initiated latest (see Methods for details). Initial plant size was considered to be equal for all treatments because plants were assigned to treatments at random. The line from initial size to final size represents the growth rate for each plant. A flat line means the growth rate equalled the control, a line that slopes upward indicates an increase in growth rate and a line that slopes downward indicates a decrease in growth rate.
Pattern of plasticity in response to defoliation, S. vesicaria
Sesbania vesicaria also showed an initial response in growth that translated into final differences in plant size between the treatments (Tables 1, 3). Total numbers of flowers and fruits and total reproduction were also affected by treatments (Tables 1, 3). Reductions relative to control for the most stressful treatment (treatment 1) were 15 %, 7·5 %, 27 % and 33 % for plant size, total number of flowers, total number of fruits, and total reproduction, respectively. The significant effect of treatment on individual seed mass resulted from reductions in seed mass in response to treatments 1, 2 and 3. The patterns of response to defoliation were quite similar among treatments (Fig. 2B). Final plant size was less than in controls for all defoliation treatments, but flowers per unit size increased for treatments 1 and 4. This trend approached significance and suggests a difference in allocation to flowers rather than a simple effect of size on final flower number. Fruit set was lower than in controls for all treatments and three of four treatments showed a final reduction in individual seed mass. Most of these individual responses are not statistically significant. Nonetheless, the trend is that the effect of timing of treatment was mostly on the severity of reductions in components of reproduction while the pattern of response was quite similar across treatments (Fig. 2B).
Differences between species in responses to defoliation
Several pieces of evidence show that the response to stress differed between the species. There were significant species by treatment effects on six of the eight variables analysed (Table 4). These differences are best illustrated by comparing the patterns of response to the earliest treatment (1) and the latest treatment (4) (Fig. 3A, B). In these cases the pattern of response is opposite in nearly every character plotted.
Table 4.
P-values for analysis of variance in components of reproduction for both species of Sesbania
| Independent variable in an ANOVA |
||||||||||
|---|---|---|---|---|---|---|---|---|---|---|
| Component of reproduction |
Species |
Block |
Treatment |
Species × Treatment |
Block × Treatment |
R2 |
||||
| Size | 0·0001 | 0·0090 | 0·0407 | 0·0051 | ns | 0·62 | ||||
| Total number of flowers1 | 0·0001 | 0·0141 | 0·0005 | 0·0004 | ns | 0·74 | ||||
| Total number of fruits1 | 0·0001 | 0·0600 | 0·0017 | 0·0039 | ns | 0·62 | ||||
| Flowers/size1 | 0·0001 | 0·0600 | ns | ns | ns | 0·45 | ||||
| Fruit set (transformed)1 | 0·0001 | ns | ns | ns | ns | 0·34 | ||||
| Number of good seeds per fruit2 | 0·0001 | 0·0001 | 0·0001 | 0·0232 | 0·0001 | 0·84 | ||||
| Individual seed mass3 | 0·0001 | 0·0001 | 0·0001 | 0·0001 | 0·0001 | 0·92 | ||||
| Total reproduction11 | 0·0001 | ns | 0·0242 | 0·0468 | ns | 0·41 | ||||
Number of good seeds per fruit was included as a covariate for analysis of average individual seed mass. ns, not significant.
Variable was measured and analyzed at the level of the plant.
Variable was measured and analyzed at the level of the fruit.
Variable was measured and analyzed at the level of the seed.
Fig. 3.
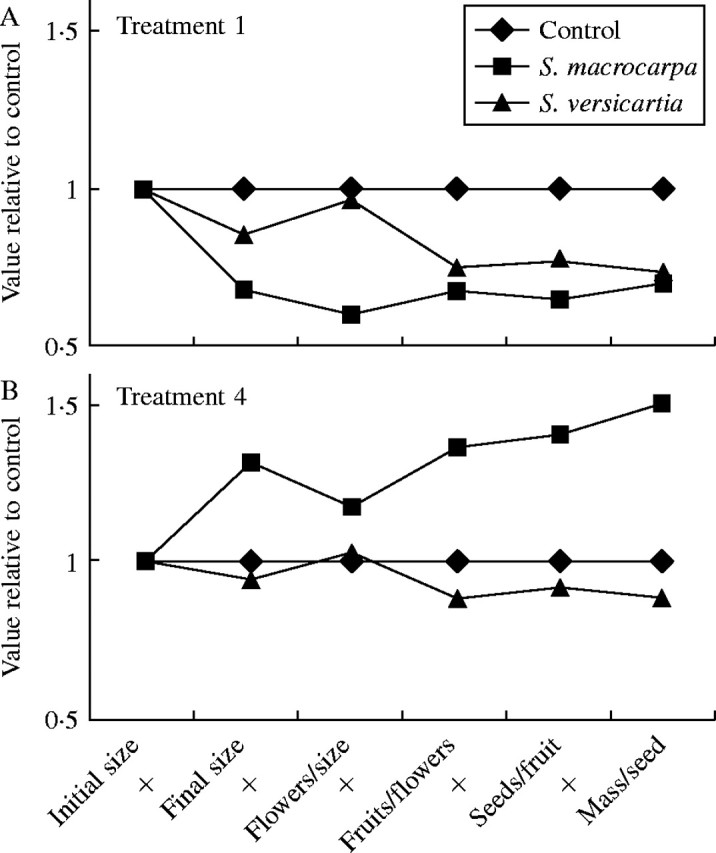
Comparison of the cumulative effects of (A) treatment 1 and (B) treatment 4 on the components of reproduction in Sesbania macrocarpa and S. vesicaria. The points on the graph were calculated as described in Fig. 1. For treatment 1, defoliation was initiated prior to flowering, while for treatment 4 defoliation was initiated about 4 weeks after flowering began. (see Methods for details). Initial plant size was considered to be equal for all treatments because plants were assigned to treatments at random. The line from initial size to final size represents the growth rate for each plant. A flat line means the growth rate equalled the control, a line that slopes upward indicates an increase in growth rate and a line that slopes downward indicates a decrease in growth rate.
The difference in pattern of response is also illustrated by the patterns of correlations among the traits between species. Although none of the correlations in response of the two species are significant, they are substantial and often negative (Table 5). While the response in size across treatments shows a positive correlation where R > 0·60, there are negative correlations of the same magnitude for flowers/size, fruit set and individual seed mass.
Table 5.
Comparison of the pattern of response to stress
| Component of reproduction |
R |
P |
|---|---|---|
| Size | 0·61 | 0·27 |
| Flowers/size | −0·62 | 0·27 |
| Fruit set | −0·69 | 0·20 |
| Number of good seeds per fruit | −0·15 | 0·81 |
| Individual seed mass | −0·62 | 0·26 |
| Total reproduction | 0·49 | 0·40 |
Correlation coefficients were calculated using the mean response of each Sesbania species in each of the five treatments. Thus, for each variable, n = 5.
The amount of plasticity in components of reproduction also varies between the species (Tables 6, 7). When coefficients of variation (CV) in trait values are calculated across plants, the average CVs for components of reproduction are 33·1 % and 24·1 % for S. macrocarpa and S. vesicaria, respectively. In addition, the CV for total reproduction across plants is also considerably higher for S. macrocarpa. Using treatment means to calculate coefficients of variation yields lower values (Table 7). However, both the average CV for components of reproduction (9·9 % vs 5·7 %) and the CV for total reproduction (32·3 % vs 26·3 %) are larger in S. macrocarpa than S. vesicaria. For S. macrocarpa, plant size followed by fruit set were the most variable among plants and among treatments (Tables 6, 7). For S. vesicaria, flowers/size and fruit set were the most variable among plants and among treatments (Tables 6, 7). Number of good seeds per fruit was the least variable component of reproduction for both species.
Table 6.
Coefficients of variation in the components of reproduction for S. macrocarpa and S. vesicaria
| Component of reproduction |
S. macrocarpa |
S. vesicaria |
|---|---|---|
| Size | 56·7 | 18·3 |
| Flowers/size | 27·9 | 35·8 |
| Fruit set | 42·1 | 35·9 |
| Number of good seeds per fruit | 18·9 | 10·3 |
| Individual seed mass | 19·8 | 20·2 |
| Total reproduction | 73·9 | 52·6 |
For size, flowers per unit size and fruit set, CVs were calculated from the values of the measures for each plant. For good seeds per fruit the values for each fruit were used and for individual seed mass the values for each seed were used.
Table 7.
Coefficients of variation in the components of reproduction for S. macrocarpa and S. vesicaria
| Component of reproduction |
S. macrocarpa |
S. vesicaria |
|---|---|---|
| Size | 24·3 | 6·1 |
| Flowers/size | 6·1 | 8·45 |
| Fruit set | 7·9 | 8·3 |
| Number of good seeds per fruit | 4·9 | 1·9 |
| Individual seed mass | 6·4 | 3·6 |
| Total reproduction | 32·3 | 26·3 |
CVs were calculated from the treatment means of each variable for each species. Thus n = 5 for calculating each CV.
DISCUSSION
Plasticity in components of reproduction is important to plant fitness because it can affect both the number and quality of offspring produced when environmental conditions vary. While it has often been proposed that plants will respond to stress primarily by changing total number of seeds such that seed size remains relatively constant (e.g. Harper et al., 1970), data show that changes in the components of reproduction may vary between species (e.g. Marshall et al., 1986). The pattern of plastic response to stress in components of reproduction, such as flower number, fruit abortion, number of seeds per fruit and seed mass, might also vary within species depending on the time during the season when environmental change occurs. Early stress, for example, might alter plant size and flower number while stress imposed late in the season might only affect seed mass and seed number per fruit, because these components of reproduction are determined at different times in plant development (Fig. 1). We investigated this possibility by varying the timing of initiation of defoliation for two species of Sesbania. While the timing of defoliation did affect the pattern of plastic response and there were differences between the species, the nature of the responses was not precisely as we had predicted.
First, removal of half of each leaf was sufficient to reduce overall reproduction, but not so severe as to kill plants. Generally, the defoliation treatments were sufficient to reduce plant size, total number of flowers and total reproduction per plant (total mass of seeds produced) when defoliation was initiated at the two earliest time periods. However, defoliation initiated later did not tend to reduce reproduction. In fact, the latest defoliation treatment actually resulted in a significant increase in plant size in S. macrocarpa.
Although the treatments caused a response, the effect on the plants was not as strong as in other experiments with Sesbania (Marshall et al., 1986; Marshall, 1989). This may be because of the growing conditions in this study. Plants were watered from the bottom and had no limit on water availability. Sunlight is intense in New Mexico, so light was unlikely to have limited plant growth in the greenhouse. Finally, plants formed root nodules, providing a supply of nitrogen. Thus, even removal of half of each leaf may not have been a particularly strong treatment as plants had plenty of light and nitrogen and thus the capacity to make additional leaves or increase the rate of photosynthesis in the remaining leaf tissue.
Second, we predicted that the timing of initiation of defoliation would affect the pattern of plastic response in a particular way. We thought that the plants might respond to early stress by alteration of several components of reproduction, but would respond to later stress by altering only those components of reproduction that were determined latest in development (e.g. seed mass). The time of initiation of stress did affect the plastic response, but not in the way we predicted.
For S. vesicaria, the treatments affected most of the components of reproduction (Table 3); however, the pattern of plastic response was very similar among treatments initiated at different times in the experiment (Fig. 2B). Generally, final plant size and amount of fruit set were reduced relative to controls (although the effect on fruit set was not significant) and the later components of reproduction (number of seeds per fruit and seed mass) showed less effect. The earlier treatments had the greatest overall effect on reproduction. This probably occurred because the earlier the treatment started, the longer the period during which the plants lacked some leaf tissue. Thus, for S. vesicaria, timing of defoliation primarily affected the intensity of response rather than the pattern of response. There was no indication that starting a treatment late forced a response in seed mass. This may have been because, despite adjustments during the course of the experiment, none of the treatments were actually initiated as late in the life cycle as we had wished. The plants continued to flower for several weeks after the initiation of the last treatment. Thus, plants were still adding new tissue and could still adjust all of the components of reproduction.
The pattern of response to defoliation differed more between treatments in S. macrocarpa (Fig. 2A). Generally, there was a switch in the response between the two earliest and the two latest defoliation treatments. Early treatments resulted in a reduction in total reproduction or under-compensation. Defoliation at the third time period produced nearly exact compensation; total reproduction was almost identical to that of the control plant. Defoliation at the final time period resulted in over-compensation; total reproduction was significantly higher than in the control plants. Despite these differences in the results, most of the change in total reproduction was due to changes in plant size that led to changes in number of flowers, number of fruits and total mass of seeds (Fig. 2A).
Our observation of over-compensation in response to late defoliation of S. macrocarpa requires some comment as there is considerable interest in the frequency with which over-compensation might occur in natural populations (e.g. Belsky, 1986; Paige and Whitham, 1987; Paige, 1992, 1999; Bergelson et al., 1996; Lennartson et al., 1998; Agrawal, 2000; Warner and Cushman; 2002; Freeman et al., 2003). We think over-compensation occurred in this case due to a combination of the time in the life cycle at which defoliation was initiated and the availability of resources for further growth. The last defoliation treatment for S. macrocarpa occurred at a time when plant growth was slowing and plants had begun to move nutrients from leaves to fruits. The late defoliation appeared to slow senescence in the plants. Plants defoliated late continued to grow, reaching a greater size with more nodes at which fruits could be produced. Thus, the increase in overall reproduction was mostly due to continued growth late in the experiment. Timing of herbivory has also been important in other cases of over-compensation (Lennartson et al., 1998; Warner and Cushman, 2002; Freeman et al., 2003).
Over-compensation might not operate in the same way in the field for S. macrocarpa. Late growth and late fruit production could be unsuccessful if the season is truncated by frost. Also, it is important to note that light, water and nitrogen were abundant and there was little opportunity for competition under the conditions of this experiment. Populations are often dense in the field (D. L. Marshall, pers. Obs.). Nonetheless, over-compensation in response to beetle herbivory has also been seen in S. sesban when 25–50 % defoliation occurred on 3-month-old seedlings (Sileshi et al., 2002).
The over-compensation we saw contrasts with some previous studies. Here, part of the tissue of each leaf was removed; no meristems were damaged. Thus, this case of over-compensation is very different from those in which it occurs after early clipping of flowering stems (e.g. Paige and Whitham, 1987).
It is also interesting to consider why over-compensation occurred in S. macrocarpa, but not in S. vesicaria. We think there are two reasons. First, because the life cycle of S. vesicaria is longer, none of the defoliation treatments occurred at a stage that is as late in development as in S. macrocarpa: the S. vesicaria plants were not beginning to senesce when the latest treatments were applied. Also, in all of our previous experiments, S. vesicaria has been less plastic than S. macrocarpa (Marshall et al., 1986; Marshall, 1989) and may not have the flexibility to overcompensate.
As in previous studies of these species of Sesbania, the pattern of plastic response differed between the species. This conclusion is supported by significant species by treatment interactions for six variables, comparison of coefficients of variation for each variable, and the pattern of correlations among responses to treatments for each variable. Overall, S. macrocarpa showed more plasticity than S. vesicaria. For S. macrocarpa the mean coefficient of variation for individual components of reproduction was 33 % and the coefficient of variation for total reproduction was 73·9 %. In contrast, the mean coefficient of variation and the coefficient of variation for total reproduction were 24·1 % and 52·6 %, respectively, in S. vesicaria. While number of good seeds per fruit and individual seed mass were the least variable components of reproduction for both species, the most variable components of reproduction differed between the species (Tables 6, 7).
None of the correlations in responses were significant because the number of treatments, and therefore the sample sizes, for calculating correlation coefficients were quite small. However, four of the five correlations for individual components of reproduction were negative, three of them strongly so. The fifth, plant size, was positively correlated between the species (Table 5).
We predicted that patterns of response to stress would be different between the species for early treatments when all components of reproduction could respond to stress, and similar for late treatments when responses were constrained to be in those characters determined late in development. We saw the opposite effect; responses to early stress were most similar (Fig. 3A, B). We think that the responses to late stress differed because, even though seeds of both species were planted at the same time and even though both species are annuals, S. vesicaria has a longer and less flexible life cycle than S. macrocarpa. In the field in central Texas, S. vesicaria germinates in February, but does not flower until August or September. In contrast, S. macrocarpa germinates between February and June, but still flowers in August or September (D. L. Marshall, pers. Obs.). Thus, S. macrocarpa can reach maturity more quickly if it germinates late. Sesbania vesicaria does not show this pattern. In the greenhouse, S. vesicaria continued to grow and flower over a longer period of time than S. macrocarpa. Despite our attempt to adjust the treatment schedule, none of the treatments occurred as late in the life cycle for S. vesicaria as for S. macrocarpa. Thus, in treatments 3 and 4, for example, S. macrocarpa plants had begun to senesce and responded to the treatment by growing new leaves after the control plants had stopped growing. This resulted in compensation in treatment 3 and over-compensation in treatment 4. This stimulation of growth was not seen in S. vesicaria.
Although it was expected that the latest treatments might result in decreases in seed mass, our data did not support this prediction. However, in an earlier experiment, seed mass was reduced in both species when fruits were subjected to damage very late in the season (Marshall et al., 1985b). In that experiment, treatments began after plants had stopped flowering. In this experiment, no treatments were initiated after flowering had ceased. Thus, our late treatments may not have been late enough to constrain plants to respond by reducing seed mass. Patterns of response to stress exactly as we predicted have been seen, especially in crop species (Son et al., 1996; Nielsen and Nelson, 1998; Desclaux et al., 2000). In those cases, the schedule of initiation of stress covered the plant life cycle more thoroughly than in our experiment.
We conclude that the time of initiation of a stress is important to plant response. In nature occurrence of stresses is likely to vary across populations and seasons. Thus, understanding of species' repertoires of plastic responses should include investigation of treatments of different magnitudes as well as of treatments initiated at different times in the life cycle. As seen in this study, the consequences of stress are likely to depend on the interaction between the time of occurrence of the stress and the length and flexibility of the species' life cycle.
Acknowledgments
Funding for this project was provided by the University of New Mexico Faculty Research Allocations Committee.
LITERATURE CITED
- Adams MW. 1967. Basis of yield components in crop plants with special reference to the field bean Phaseolus vulgaris Crop Science 7: 505–510. [Google Scholar]
- Agrawal AA. 2000. Overcompensation of plants in response to herbivory and the by-product benefits of mutualism. Trends in Plant Science 5: 309–313. [DOI] [PubMed] [Google Scholar]
- Agrawal AA. 2001. Phenotypic plasticity in the interactions and evolution of species. Science 294: 321–326. [DOI] [PubMed] [Google Scholar]
- Belsky AJ. 1986. Does herbivory benefit plants: a review of the evidence. American Naturalist 127: 870–892. [Google Scholar]
- Bergelson J, Juenger T, Crawley MJ. 1996. Regrowth following herbivory in Ipomopsis aggregata: compensation but not overcompensation. American Naturalist 148: 744–755. [Google Scholar]
- Black JN. 1956. The influence of seed size and depth of sowing on pre-emerbence and early vegetative growth of subterranean clover (Trifolium subterraneum L.). Australian Journal of Agriulture Research 7: 98–109. [Google Scholar]
- Bradshaw AD. 1965. Evolutionary significance of phenotypic plasticity in plants. Advances in Genetics 13: 115–155. [Google Scholar]
- Cheplick GP. 1995. Plasticity of seed number, mass, and allocation in clones of the perennial grass Amphibromus-scabrivalvis International Journal of Plant Sciences 156: 522–529. [Google Scholar]
- Desclaux D, Huynh T, Roumet P. 2000. Identification of soybean plant characteristics that indicate the timing of drought stress. Crop Science 40: 716–722. [Google Scholar]
- Diggle PK. 1994. The expression of andromonoecy in Solanum hirtum (Solanaceae): phenotypic plasticity and ontogenetic contingency. American Journal of Botany 81: 1354–1365. [Google Scholar]
- Freeman RS, Brody AK, Neefus CD. 2003. Flowering phenology and compensation for herbivory in Ipomopsis aggregata Oecologia 136: 394–401. [DOI] [PubMed] [Google Scholar]
- Gorchov DL. 1988. Effects of pollen and resources on seed number and other fitness components in Amelanchier arborea (Rosaceae: Maloideae). American Journal of Botany 75: 1275–1285. [Google Scholar]
- Harper JL, Lovell PH, Moore KG. 1970. The shapes and sizes of seeds. Annual Review of Ecology and Systematics 1: 327–356. [Google Scholar]
- Havens K, Preston KA, Richardson C, Delph LF. 1995. Nutrients affect allocation to male and female function in Abutilon theophrasti (Malvaceae). American Journal of Botany 82: 726–733. [Google Scholar]
- Koptur S, Smith CL, Lawton JH. 1996. Effects of artificial defoliation on reproductive allocation in the common vetch, Vicia sativa (Favaceae: Papilionoideae). American Journal of Botany 83: 886–889. [Google Scholar]
- Lee TD, Bazzaz FA. 1986. Maternal regulation of fecundity: non-random ovule abortion in Cassia fasciculata Michx. Oecologia 68: 459–465. [DOI] [PubMed] [Google Scholar]
- Lennartson T, Nilsson P, Tuomi J. 1998. Induction of overcompensation in the field gentian, Gentianella campestris Ecology 79: 1061–1072. [Google Scholar]
- Lloyd DG. 1980. Sexual strategies in plants 1. An hypothesis of serial adjustment of maternal investment during one reproductive session. New Phytologist 86: 69–79. [Google Scholar]
- McConnaughay KDM, Coleman JS. 1999. Biomass allocation in plants: ontogeny or optimality? A test along three resource gradients. Ecology 80: 2581–2593. [Google Scholar]
- Mabry CM, Wayne PW. 1997. Defoliation of the annual herb Abutilon theophrasti: mechanisms underlying reproductive compensation. Oecologia 111: 225–232. [DOI] [PubMed] [Google Scholar]
- Marshall DL. 1986. Effect of seed size on seedling success in 3 species of Sesbania (Fabaceae). American Journal of Botany 73: 457–464. [Google Scholar]
- Marshall DL. 1989. Integration of response to defoliation within plants of 2 species of Sesbania Functional Ecology 3: 207–217. [Google Scholar]
- Marshall DL, Fowler NL, Levin DA. 1985. Plasticity in yield components in natural populations of three species of Sesbania Ecology 66: 753–761. [Google Scholar]
- Marshall DL, Levin DA, Fowler NL. 1985. Plasticity in yield components in response to fruit predation and date of fruit initiation in 3 species of Sesbania (Leguminosae). Journal of Ecology 73: 71–81. [Google Scholar]
- Marshall DL, Levin DA, Fowler NL. 1986. Plasticity of yield components in response to stress in Sesbania macrocarpa and Sesbania vesicaria (Leguminosae). American Naturalist 127: 508–521. [Google Scholar]
- May JD, Killingbeck KT. 1995. Effects of herbivore induced nutrient stress on correlates of fitness and on nutrient resorption in scrub oak (Quercus ilicifolia). Canadian Journal of Forest Research—Revue Canadienne de Recherche Forestiere 25: 1858–1864. [Google Scholar]
- Nielsen DC, Nelson NO. 1998. Black bean sensitivity to water stress at various growth stages. Crop Science 38: 422–427. [Google Scholar]
- Niesenbaum RA. 1996. Linking herbivory and pollination: defoliation and selective fruit abortion in Lindera benzoin Ecology 77: 2324–2331. [Google Scholar]
- Paige KN. 1992. Overcompensation in response to mammalian herbivory—from mutualistic to antagonistic interactions. Ecology 73: 2076–2085. [Google Scholar]
- Paige KN. 1999. Regrowth following ungulate herbivory in Ipomopsis aggregata: geographic evidence for overcompensation. Oecologia 118: 316–323. [DOI] [PubMed] [Google Scholar]
- Paige KN, Whitham TG. 1987. Overcompensation in response to mammalian herbivory—the advantage of being eaten. American Naturalist 129: 407–416. [Google Scholar]
- Parciak W. 2002. Environmental variation in seed number, size, and dispersal of a fleshy-fruited plant. Ecology 83: 780–793. [Google Scholar]
- Pigliucci M. 1998. Developmental plasticity: where internal programming meets the external environment. Current Opinion in Plant Biology 1: 87–91. [DOI] [PubMed] [Google Scholar]
- Pigliucci M, Kolodynska A. 2002. Phenotypic plasticity and integration in response to flooded conditions in natural accessions of Arabidopsis thaliana (L.) Heynh (Brassicaceae). Annals of Botany 90: 199–207. [DOI] [PMC free article] [PubMed] [Google Scholar]
- Schlichting CD. 1986. The evolution of phenotypic plasticity in plants. Annual Review of Ecology and Systematics 17: 667–693. [Google Scholar]
- Schlichting CD, Pigliucci M. 1995. Lost in phenotypic space: Environment-dependent morphology in Phlox drummondii (Polemoniaceae). International Journal of Plant Sciences. 156: 542–546. [Google Scholar]
- Schlichting CD, Pigliucci M. 1998.Phenotypic evolution: a reaction norm perspective. Sunderland, MA: Sinauer Associates Inc. [Google Scholar]
- Sileshi G, Mafongoya PL, Kwesiga F. 2002. Performance of Sesbania sesban infested by the defoliating beetle Mesoplatys ochroptera in Zambia. Agroforestry systems 56: 177–184. [Google Scholar]
- Singh SP. 1995. Selection for water-stress tolerance in interracial populations of common bean. Crop Science 35: 118–124. [Google Scholar]
- Smith-Huerta NL, Vasek FC. 1987. Effects of environmental stress on components of reproduction in Clarkia unguiculata American Journal of Botany 74: 1–8. [Google Scholar]
- Son CK, Park SG, Kim CY, Choi BS. 1996. Effects of water stress on growth characteristics and grain yield of soybean. RDA Journal of Agricultural Science Upland Industrial Crops 38: 123–128. [Google Scholar]
- Stanton ML. 1984. Seed variation in wild radish: effect of seed size on components of seedling and adult fitness. Ecology 65: 1105–1112. [Google Scholar]
- Stephenson AG. 1980. Fruit set, herbivory, fruit reduction, and the fruiting strategy of Catalpa speciosa (Bignoniaceae). Ecology 61: 57–64. [Google Scholar]
- Stephenson AG. 1981. Flower and fruit abortion: proximate causes and ultimate functions. Annual Review of Ecology and Systematics 12: 253–279. [Google Scholar]
- Sugiyama S, Bazzaz FA. 1997. Plasticity of seed output in response to soil nutrients and density in Abutilon theophrasti: implications for maintenance of genetic variation. Oecologia 112: 35–41. [DOI] [PubMed] [Google Scholar]
- Sultan SE. 1987. Evolutionary implications of phenotypic plasticity in plants. Evolutionary Biology 21: 127–178. [Google Scholar]
- Sultan SE. 2000. Phenotypic plasticity for plant development, function and life history. Trends in Plant Science 5: 537–542. [DOI] [PubMed] [Google Scholar]
- Sultan SE. 2001. Phenotypic plasticity for fitness components in Polygonum species of contrasting ecological breadth. Ecology 82: 328–343. [Google Scholar]
- Sultan SE, Bazzaz FA. 1993. Phenotypic plasticity in Polygonum persicaria 3. The evolution of ecological breadth for nutrient environment. Evolution 47: 1050–1071. [DOI] [PubMed] [Google Scholar]
- Susko DJ, Lovett-Doust L. 2000. Plant-size and fruit-position effects on reproductive allocation in Alliaria petiolata (Brassicaceae). Canadian Journal of Botany 78: 1398–1407. [Google Scholar]
- Urbas P, Zobel K. 2000. Adaptive and inevitable morphological plasticity of three herbaceous species in a multi-species community: field experiment with manipulated nutrients and light. Acta Oecologica 21: 139–147. [Google Scholar]
- Valladares F, Wright SJ, Lasso E, Kitajima K, Pearcy RW. 2000. Plastic phenotypic response to light of 16 congeneric shrubs from a Panamanian rainforest. Ecology 81: 1925–1936. [Google Scholar]
- Volis S, Mendlinger S, Olsvig-Whittaker L, Safrie UN, Orlovsky N.1998. Phenotypic variation and stress resistance in core and peripheral populations of Hordeum spontaneum Biodiversity and Conservation 7: 799–813. [Google Scholar]
- Volis S, Medlinger S, Ward D. 2002. Differentiation in populations of Hordeum spontaneum Koch along a gradient of environmental productivity and predictability: plasticity in response to water and nutrient stress. Biological Journal of the Linnean Society 75: 301–312. [Google Scholar]
- Warner PJ, Cushman JH. 2002. Influence of herbivores on a perennial plant: variation with life history stage and herbivore species. Oecologia 132: 77–85. [DOI] [PubMed] [Google Scholar]
- Willson MF, Price PW. 1980. Resource limitation of fruit and seed production in some Asclepias species. Canadian Journal of Botany–Revue Canadienne de Botanique 58: 2229–2233. [Google Scholar]
- Winn AA, Werner PA. 1987. Regulation of seed yield within and among populations of Prunella vulgaris Ecology 68: 1224–1233. [Google Scholar]