Abstract
• Background and Aims Tillering is an essential factor when estimating yield, but investigations rarely include both the temporal and spatial changes that occur in tillers. This study analyses the morphology and development dynamics of each tiller, based on its topological location, the timing of appearance and main stem development stage.
• Methods An indica cultivar of rice, ‘Ir64’, glasshouse-grown (25/20 °C, 12 h photoperiod), was used to examine the emergence, phenology and morphology of each axis starting at the third leaf stage up to heading.
• Key Results Little variability was observed in the structural and morphological characteristics of the tillers, and the rice population appeared to be hierarchical. Blade length initially increased with leaf rank and then decreased sharply for the last three leaves. The number of phytomers per axis decreased with branching order and rank. An analysis of plant dynamics showed synchronous emergence of the leaves on the main stem and on the tillers up to flowering. Axillary bud development into tillers depended on their topological location and plant developmental stage.
• Conclusions The timing and frequency of flowering tillers complied with rules of priority depending on their order, rank and emergence time. Precise description of plant topology in grasses is a useful tool that can be used to quantify growth events and predict tillering in terms of location, structure and fate according to growing conditions.
Keywords: Oryza sativa L., rice, tillering, phyllochron, ontogeny, synchrony, development dynamics, tiller flowering
INTRODUCTION
Rice tillering is a major determinant for panicle production (Miller et al., 1991) and as a consequence affects total yield (Gallagher and Biscoe, 1978). The substantial variability observed in responses of rice varieties to tillering is closely related to plasticity with respect to environmental conditions (Yoshida, 1981). Leaf emergence dynamics and leaf morphology are key elements in understanding tillering regulation mechanisms.
Leaf emergence rate (determined through the phyllochron), expressed either as calendar time or thermal time, has been widely studied in grasses (Wilhelm and McMaster, 1995). Both phyllochron and leaf morphological characteristics vary substantially with environmental factors (Klepper et al., 1982; Kiniry et al., 1991; Ritchie and Nesmith, 1991; Yin and Kropff, 1996). Despite this variability, Sié et al. (1998) showed that rice varieties exhibit specific phyllochrons on the main stem (MS). The tiller phyllochron differs from the MS phyllochron during both the vegetative and reproductive phases (Skinner and Nelson, 1994; Bos and Neutebom, 1998); but leaf emergence on the MS and tiller development are nevertheless closely linked and result in synchrony between leaf emergence rates on the MS and tillers. This type of synchrony has been observed in rice (Katayama, 1951; Hanada, 1993), as well as in barley and wheat (Kirby et al., 1985). Moreover, the final number of leaves on a rice tiller at a given position is strongly dependent on the MS leaf number (Matsuba, 1988).
Moulia et al. (1999a, b) in maize and pea, and Stafstrom (1995) in pea highlighted the effect of nodal position and emergence time on the morphology and development of a given bud. Unfortunately, most chronological studies on rice development neglect leaf and tiller morphology. On the other hand, most tillering studies include some degree of plant morphology but not the timing of tiller emergence or their flowering relative to location (Bauer et al., 1984; Wu et al., 1998). Therefore, although certain development phases of grasses have been described, little information is available concerning the dynamics of cereals up to flowering. Tillering is a complex process where the expression of many genes must be fine-tuned. Li et al. (2003) identified Monoculm1 (MOC 1) as the first functional gene that controls tillering in rice.
In the study presented here, the development dynamics of a rice population (‘Indica’ type) were investigated and the effects of MS topological location and development stage on the structural and temporal characteristics of the tillers were examined. Data were processed using plant architecture analysis methods commonly applied to tree architecture and, in some cases, to herbaceous species (Jeannoda-Robinson, 1977; Moulia et al., 1999a, b). The development of concepts and tools (Godin et al., 1997a, b; Godin and Caraglio, 1998) enabled us to quantify plant architecture using a multiscale representation of plant topological structure. Rice structure and morphology were followed over time in terms of number and position of leaves and tillers. This approach was chosen to determine quantitative aspects of tillering as a basis for simulation models.
MATERIALS AND METHODS
Study site, plant material and treatments
The rice cultivar studied, Oryza sativa L. ssp. Indica (‘IR 64’), is characterized by above-average tillering, an erect growth habit, narrow leaves, fine roots and a long, slender grain (Glaszmann, 1987). The Indica group is found in lowland paddies of the tropics.
Seeds were germinated in Petri dishes inside a culture chamber at 31 °C (day), 24 °C (night) and a 12-h photoperiod. At the three-phytomer stage (coleoptile + first two leaves), 40 seedlings were selected and transferred to 2-L pots containing a mixture of 1/3 leaf mould (Neuhauss No. 2), 1/3 pozzolana and 1/3 sphagnum peat. [Note: a phytomer (also called a metamer; Harper et al., 1986) consists of a node plus the leaf at that node and its subtended bud if present, plus a portion of internode (Bell, 1991). In monocotyledons, adventitious roots are added.] A slow-release fertilizer (plantacote 14-9-12) was added to the substrate surface (20 g m2) after transfer. The pots were placed 20 cm apart in sub-irrigation trays containing a few centimetres of water.
The glasshouse study was conducted at the Institut de Recherche pour le Développement (IRD) in Montpellier (France) from January to June. The temperature was 25 °C (70 % relative humidity) in the daytime and 20 °C (90 % relative humidity) at night. Natural daylight was complemented with 400 W mercury lamps for a 12-h photoperiod.
Measurement of plant morphological characteristics
Blade elongation was measured every 2 d from the 3-phytomer to the 13-phytomer stage of the main stem (MS) and once a week thereafter up to heading (1 cm long inflorescence above the flag leaf sheath).
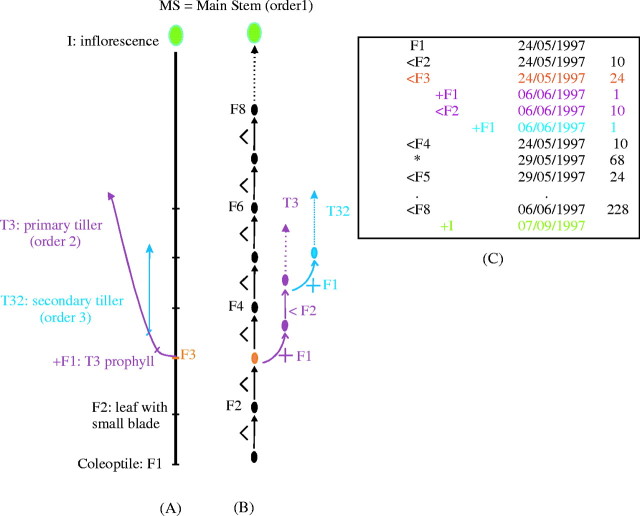
By convention, the MS was defined as an order-1 axis, the primary tillers as order-2 axes and the secondary tillers as order-3 axes (Fig. 1A). Tiller or leaf position was defined by the rank of the axillating phytomer on the bearing axis. A primary tiller axillated by the ‘x’ phytomer on the MS was thus designated ‘Tx’ and a secondary tiller axillated by the ‘y’ phytomer on the Tx tiller was designated ‘Txy’.
Fig. 1.
Diagrammatic representation of rice a plant. (A) Schematic structure of the axes. MS = main stem = order 1; Tx = primary tillers = order 2; Txy = secondary tillers = order 3. Elementary units are F = phytomer and I = inflorescence. (B) Corresponding tree graph represented by elementary units and the two types of relationships, e.g. F3 preceeds (<) F4 and F3 bears (+) a tiller T3. (C) Corresponding topological coding. The first three columns are for topological coding and columns 4 and 5 are for unit attributes. * = corresponding to the same unit (here F4) at another date.
When quantifying plant architecture, the topological structure and the relationships (‘+’, ‘<’) between the elementary units were described using the Godin and Caraglio (1998) coding method. Two types of elementary units were defined: phytomer and inflorescence, coded by a letter (F = phytomer, I = inflorescence). An associated numerical index indicated the rank of the unit, numbered from the base to the tip. The first phytomer considered (F1) corresponds to the coleoptile on the MS or to the prophyll on the tillers. Two kinds of relationship were established between plant units: succession and branching, denoted by the operators ‘<’ and ‘+’, respectively. As an example, the succession relationship ‘x < y’ means that unit ‘y’ was created by the terminal bud of unit ‘x’. Likewise, the branching relationship ‘x + y’ means that unit ‘y’ developed from an axillary bud on ‘x’ (Fig. 1B, C).
The phytomers were examined periodically and characterized by two attributes: blade length and sheath length. The total number of phytomers was calculated for the flowering axes according to their branching order and their rank on the bearing axis. Secondary tillers were analysed, but only a few flowered.
Data processing
The information collected was coded in a multiple-tree graph (MTG, illustrated in Fig. 1C) and analysed by the statistical processing chain included in AMAPmod software (Godin et al., 1997a, b). Datasets for the 40 plants were examined statistically to quantify structural variability in terms of number of phytomers and tillers, branching intensity and location, axillary bud fate (dormant, bud developing a few leaves and aborting, and flowering) and leaf blade length.
At successive dates, the number of leaves emerged at a fixed stage (1 cm leaf blade length) was noted. The phyllochron was calculated by a non-parametric estimation of the renewal process from count data (Cox, 1967; Guédon and Cocozza-Thivent, 2003; Guédon and Monsan, in press). An elementary variable is the time interval between consecutive events (in our case, the emergence of two consecutive leaves). Values are the results of a sample of independent measurements of the type [(τ1, n1), …, (τr, nr)] where n1 is the number of events occurring over an observation period of length τ1. The procedure (Guédon and Costes, 1997) determined an inter-event distribution from count data (corresponding to the time interval between consecutive leaves).
As some climatic records for this study were lost, the phyllochron could not be expressed as thermal time, but only in days.
As the results will show, the rice population was clustered into three sub-populations (15, 16 and 17 phytomers on the MS). This source of variability was integrated in data processing. Two kinds of statistical analyses according to a random effect model were performed to measure the predictive value of node rank on leaf length, using the DIOGENE software, an extended version including resampling techniques of the OPEP software (Baradat and Labbé, 1995): (1) within each of the three sub-populations (model 1), the analysed data were leaf lengths from rank three to the last rank corresponding to the sub-population; (2) over the three sub-populations, by considering both the variability for leaf length due to the sub-population and the rank of node, and the interaction between these two factors (model 2).
In both cases, we used the notion of intraclass correlation to synthetize results of variance decomposition. This parameter, first defined by Kempthorne (1957), was comprehensively discussed for characterization of relatedness between groups of olive trees on the basis of molecular markers by Besnard et al. (2001, 2002) in the case of nested classifications with its extension for correlations where two different traits are considered.
Model 1, corresponding to a one-way variance analysis, may be written as:
 |
where yjk is the observed leaf length corresponding to rank j of the plant number k of the considered population, μ is the general mean, rj is the effect of rank j, and ejk is the within-rank deviation. The respective variances of two sources of variation are named as  and
and  , respectively, and the intraclass correlation is:
 |
It is the correlation between two leaves borne by different plants, yjk and yjk′, belonging to the considered sub-population and borne by the same leaf rank, j.
Model 2, corresponding to a two-way variance analysis according to a cross non-orthogonal and unbalanced classification, may be written as:
 |
where yijk is the observed leaf length of the plant number k within the combination of population i and rank j, μ is the general mean, pi the effect of sub-population i, rj the effect of rank j, (pr)ij the interaction between sub-population i and rank j, and eijk the within-cell deviation. The algorithm followed the Henderson's III fitting constant method for non-orthogonal data (Searle, 1987; Searle et al., 1992). The respective variances of these four sources of variation are named as  ,
,  ,
,  , and
, and  , respectively. We computed the intraclass correlation as: between leaf lengths of two tillers yijk and yi′jk′ from two different sub-populations, and borne by the same leaf rank, j:
 |
It is the correlation between two leaves yijk and yi′jk′ borne by the same rank, j, randomly chosen on two different sub-populations, i and i′ (and, therefore, on different plants).
For the two models, the significance of each intraclass correlation was assessed using the bootstrap technique (Shao and Tu, 1995; Sokal and Rohlf, 1995).
Additionally, model 2 was processed as a conventional fixed-effects two-factor ANOVA, associated with Newman–Keuls tests at 1 % level to compare population and rank means over the range rank 3 to rank 15.
RESULTS
Statistical analysis of plant structure
Total number of phytomers on flowering axes. Little variability was observed in the final number of phytomers in relation to branching order (MS, primary tillers) and primary tiller rank (T3, T4, T5, T6…) (Fig. 2). The number of phytomers on the different axes decreased with branching order (order1 = MS > order2 = primary tillers) and with increasing tiller rank (T3 > T4 > T5 > T6 > T7 …). By adding the number of phytomers on the tillers to those on the bearing axis below the point of tiller insertion, 15·9 phytomers (s.d. = 0·44, n = 153) were found for primary tillers and 15·9 (s.d. = 0·45, n = 39) for secondary tillers. These values were very similar to the number of phytomers on the MS (mean = 16·2, s.d. = 0·56, n = 40). Of the 153 tillers observed, 102 had the same number as the MS and 45 had one phytomer less. Only two tillers had two phytomers less than the MS, and four had two phytomers more than the MS. A Newman–Keuls test (P < 0·05) failed to show any significant difference between the number of phytomers on the primary and secondary tillers, but the MS had significantly (P < 0·01) more phytomers than both the primary and secondary tillers.
Fig. 2.
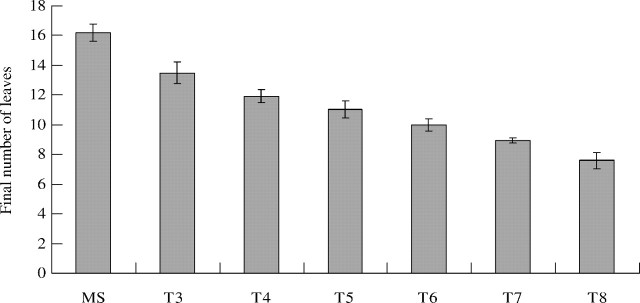
Final number of leaves on the main stem (MS) and primary tillers (Tx). x = the rank on the axillating phytomer on the MS. Leaves were counted only on axes that reached the flowering stage.
Tiller number and position. The highest branching order in this study was 3 since no tertiary tillers were observed. The MS supported 5·4 ± 0·81 (±s.d.) primary tillers and 6·1 ± 1·87 secondary tillers. On average, each plant bore 11·4 ± 3·01 tillers.
An axillary bud was present on each leaf axis (data not shown), but relatively few axillary buds developed into tillers. In many grasses, tillers are formed on the unelongated basal phytomers (Matsuo and Hoshikama, 1993). To analyse branching for each given axillary bud, the position and the relative frequency of its fate (see Materials and Methods) were calculated in relation to the increasing rank of the bearing phytomer. The results are reported for branching on the MS (Fig. 3) since all of these flowered.
Fig. 3.
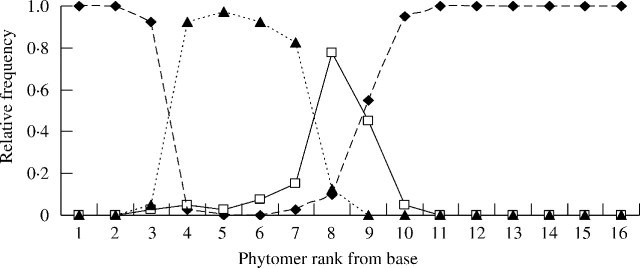
Relative frequency of the different fates of axillary buds along the main stem in relation to phytomer rank from the base on the main stem. Closed diamonds = buds remaining dormant; open squares = resulting in an aborted axis; closed triangles = resulting in a flowering axis.
Primary tillers. All buds on the MS phytomers before rank 3 and after rank 10 remained dormant. Tillers developed between ranks 3 and 10, and most flowered before rank 9, with the rest aborting (Fig. 3). Branching relative frequency (Bf) within this zone increased from 0·3 in rank 3 to 0·9 in ranks 5 and 6, then decreased progressively up to rank 10 (Fig. 3).
Secondary tillers. Secondary tillers appeared from phytomers 2 (Tx2) to 5 (Tx5) of the primary tillers (Table 1), with 98 % related to primary tillers on rank 4 (T4) to 6 (T6). A few secondary tillers developed on rank 3 and rank 7 primary tillers (n = 3).
Table 1.
Branching frequency (Bf) of secondary tillers depending on primary tiller rank (Tx) on the main stem and the rank of the phytomer (Txy) supporting the secondary tiller
| Bearing primary tiller (Tx) |
Tx2 |
Tx3 |
Tx4 |
Tx5 |
|---|---|---|---|---|
| T3 (n = 3) | 2 | 1 | ||
| T4 (n = 39) | 20 | 32 | 26 | 12 |
| T5 (n = 40) | 38 | 35 | 23 | 3 |
| T6 (n = 40) | 28 | 12 | 4 | |
| T7 (n = 39) | 3 |
Blade length of main stem and primary tillers. Final blade length was analyzed in relation to leaf rank on the MS and primary tillers. It was impossible to analyze leaf size on the secondary tillers because of insufficient data and marked variability. Blade length on the MS increased regularly up to leaf ranks 12 and 13, then decreased rapidly up to the last leaf, known as the flag leaf (Fig. 4). In practice, on the MS, the rank of the leaf with the longest blade depended on the final number of phytomers (15, 16 and 17) and generally the reduction in blade length occurred only in the last three upper leaves. For plants with 15 phytomers and 17 phytomers, the longest blade was observed on rank 13 and 15, respectively (Fig. 4). The blade size pattern on primary tillers (Fig. 5) was similar to that observed for the MS. A comparison of blade length on the MS and on primary tillers showed that leaf size decreased with tiller rank and these could be placed in the following order: T7 > T6 > T5 > T4 > T3 > MS (Fig. 5). A reverse order was observed for the total number of phytomers (T3 > T4 > T5 > T6 > T7). Blade length for a given leaf rank increased with tiller rank whereas the number of phytomers decreased with tiller rank.
Fig. 4.
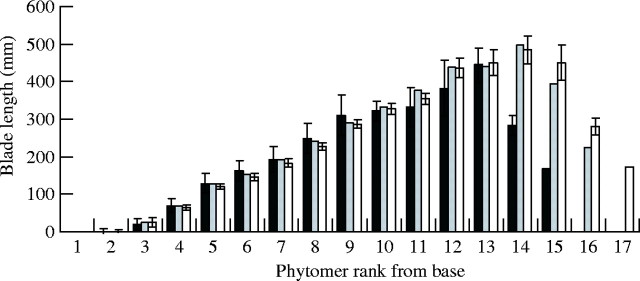
Blade length for leaves on the main stem. Blade length at each phytomer was averaged separately for the sub-populations of plants that developed 15 leaves (solid bars), 16 leaves (shaded bars) and 17 leaves (open bars). Vertical lines represent the s.e.m.
Fig. 5.
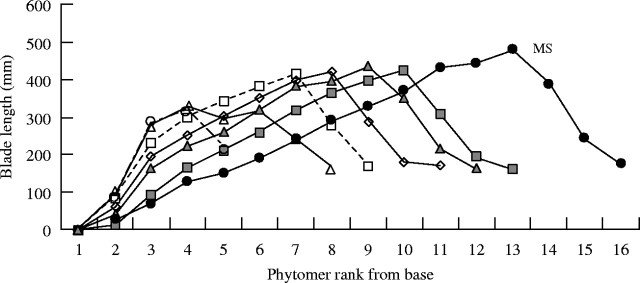
Blade length vs phytomer rank on the main stem (closed circles) and primary tillers (Tx), x = phytomer rank from the base of the main stem: T4 (closed squares), T5 (closed triangles), T6 (open diamonds), T7 (open squares), T8 (open triangles) and T9 (open circles). Vertical lines represent s.e.m: MS, n = 40; T3, n = 2; T4, n = 39; T5, n = 39; T6, n = 40; T7, n = 39; T8, n = 36; T9, n = 18.
The Newman–Keuls comparison of ranks over the three sub-populations checked by the F-test (significant at the 0·001 level) confirmed this trend by demonstrating significant average differences for mean blade length at the 5 % level between all ranks except for ranks 12 and 13, which belong to the same cluster. From rank 3 to rank 11, there was a constant increase of leaf length. On the other hand, the sub-population with 15 phytomers had a mean leaf length significantly lower than those of the two others sub-populations (16 or 17 phytomers). Therefore, this category is a criterion of vigour. It is interesting to note that the flag leaf is similar in length regardless of the position of the tiller.
Table 2 shows the result of the random-model analyses of variance. The bootstraps with 10 000 iterations gave a precise estimate of the standard errors of the intraclass correlations and show that their estimates followed a distribution very close to Normal. The rank appeared to be a very good predictor of leaf length for each of the three sub-populations (model 1) (Table 2). This property increases with the number of leaves produced, with intraclass correlations ranging from 0·91 for the sub-population with 15 phytomers to 0·98 for the sub-population with 17 phytomers. Moreover, this property was preserved with a variability taking into account the between-group differences (model 2) (Table 2), in spite of a change of the phenological meaning of the rank number according to the population: rank 15 corresponds to the last node for the sub-population with 15 phytomers and not for the sub-populations with 16 and 17 phytomers. Therefore, there is a skip of phenology of the rank which may be responsible of the major part of the sub-population × rank component of variance, which reduces the intraclass correlation. The between-sub-population variance was significantly greater than zero only at the 10 % level, as the variance of interaction between sub-population and rank was significant at the 1 % level.
Table 2.
Intra-class correlation corresponding to the models 1 and 2 of variance analysis with their confidence intervals
| Model 1 | Model 2 | |||||
|---|---|---|---|---|---|---|
| Sub-population (15 phytomers) |
Sub-population (16 phytomers) |
Sub-population (17 phytomers) |
Among the three sub-populations |
|||
| Intraclass correlation | 0·910 | 0·956 | 0·979 | 0·917 | ||
| t-value (9999 df) | 42·064*** | 118·923*** | 223·826*** | 24·999*** | ||
| 99 % confidence interval | 0·854–0·966 | 0·935–0·976 | 0·968–0·991 | 0·869–0·964 | ||
Significant at the 0·1 % level.
Leaf and tiller dynamics
Leaf emergence rate on the main stem. The visible tip of a new leaf blade appeared when the preceeding sheath leaf was completely expanded. When considering the cumulated number of leaves on the MS at each observation date (Fig. 6), six leaves were noted after 20 d and nine after 34 d. A total of 12 leaves were present on the MS after 48 d, with the 15th leaf appearing 35 d later (i.e. on day 83). The number of leaves on the MS increased linearly over time for 45–50 d after sowing (i.e. up to the 10–11th leaf), as well as in the three plant sub-populations (i.e. those with 15, 16 and 17 phytomers). Thereafter, the time increased for each new leaf and differences appeared between the sub-populations with a maximum for the population with 15 phytomers.
Fig. 6.
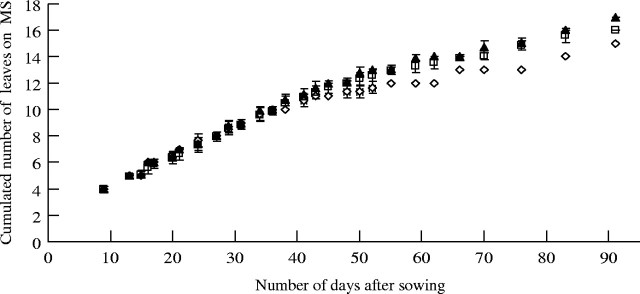
Changes over time (number of days after sowing) in the cumulated number of leaves on the main stem according within three sub-populations: with 15 leaves (open diamonds), with 16 leaves (open squares) and with 17 leaves (closed triangles). Vertical lines represent the s.e.m: for the sub-population with 15 leaves, n = 3; sub-population with 16 leaves. n = 26; sub-population with 17 leaves, n = 11.
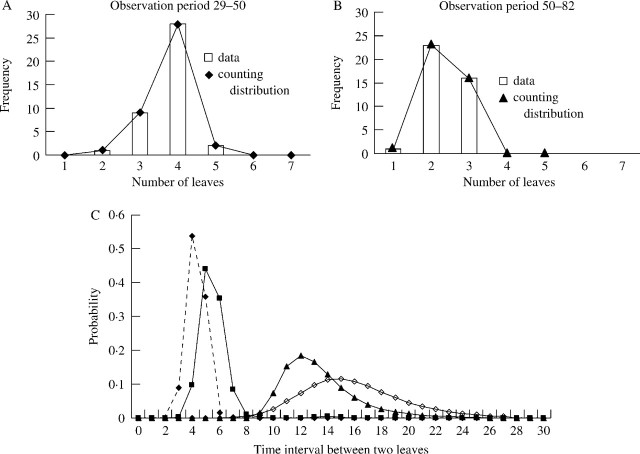
The estimation of phyllochron showed a time interval between leaves depending on plant age (Fig. 7). Inter-events distributions were estimated for the 9–50 and 50–109 observation periods; 50 d corresponded approximately to a slope change (Fig. 6). A mean time interval between events for the first observation period (9–50) was 4·9 d with, on average, eight new leaves. An abrupt change was identified for the second period with a mean time interval between events of 14·5 d with only four new leaves (Table 3). To further refine this estimation of the phyllochron, the observation periods were then split into sub-periods (Table 3). The comparison of sub-periods showed different mean time intervals between events before and after 50 d. For the two periods represented, the graphs (Fig. 7A, B) showed a decrease in mean number of leaves between 29–50 d (mean = 3·77) and 50–82 d (mean = 2·35) and a good fit between counting distribution and count data. Before 50 d, the phyllochron appeared different and could be linked to MS development stage. During development of the first four leaves on the MS (period 9–20) the phyllochron was 4·5 d. It was shorter (4 d) over the 20–29 period, grew longer (6·4) over the period 38–50 and increased rapidly thereafter (periods 50–82 and 82–109) corresponding to 12th leaf to heading (15th leaf). The time interval distribution computed for each sub-period (Fig. 7C) showed these changes. The comparison of variance of number of leaves between different sub-periods by the equation (νT = ν1 + ν2 + ν3 …) identified a rice population as homogeneous, suggesting that plants which tend to grow faster during a given observation period will continue to grow faster during the subsequent observation period (and conversely plants growing slower will continue to grow slower).
Fig. 7.
(A) Count data fitted by counting distribution for the 29–38 observation period (mean of leaf number = 3·77), and (B) the 50–82 observation period (mean of leaf number = 2·35). (C) Estimated inter-event distributions over consecutive observation periods: 9–29 d (closed diamonds), 29–50 d (closed squares), 50–82 d (closed triangles), and 82–100 d (open diamonds).
Table 3.
Comparison of inter-events distributions (mean) and of number of leaves (mean and variance) estimated over the different periods
| Observation period (days after sowing) |
Mean time interval (d) |
Mean number of leaves |
Variance ν |
|---|---|---|---|
| 9–50 | 4·87 | 8·42 | 0·4 |
| 50–109 | 14·48 | 4·07 | 0·32 |
| 9–29 | 4·29 | 4·65 | 0·28 |
| 29–50 | 5·56 | 3·77 | 0·33 |
| 50–82 | 13·48 | 2·37 | 0·28 |
| 82–109 | 15·88 | 1·7 | 0·26 |
| 9–20 | 4·58 | 2·4 | 0·29 |
| 20–29 | 3·99 | 2·25 | 0·19 |
| 29–38 | 4·79 | 1·9 | 0·13 |
| 38–50 | 6·4 | 1·87 | 0·21 |
Tiller appearance dynamics. The first primary tillers emerged 24 d after sowing, and continued to emerge until about day 65 for T10 (Figs 8 and 9). Tillers T4 and T5, which were found in over 90 % of plants, appeared at the same time as leaf 7 or leaf 8 on the MS (Fig. 9A). In a few cases (n = 3), T3 appeared at the same time as T4. While the first tillers (T3 to T7) appeared within 10 d, 20 days elapsed between T9 and T10 (Fig. 9A). If the speed of tiller appearance decreased with their rank, the synchronism between leaf emergence and tiller emergence on the MS remained. For example, T9 tillers (18 tillers on 40 plants) developed during elongation of leaves 12 and 13 on the MS (Fig. 9A, B). Primary tillers appeared between the 7th leaf up to 12–13th leaf stage of the MS.
Fig. 8.
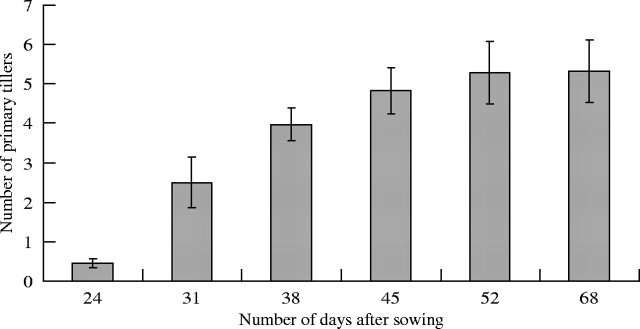
Number of visible primary tillers on the main stem vs. the number of days after sowing (n = 40).
Fig. 9.
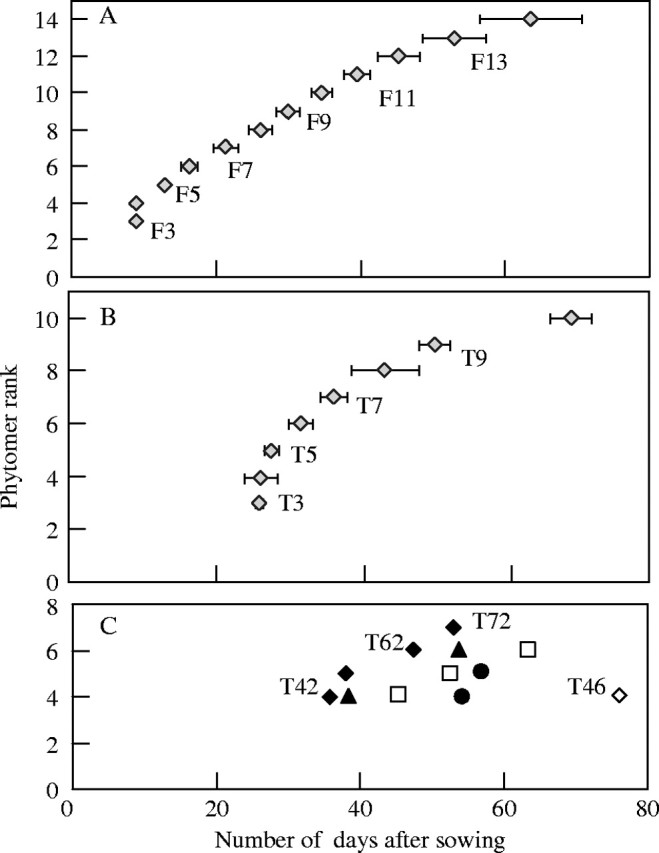
Appearance of (A) main stem leaf rank (Fx), (B) primary tillers leaf rank (Tx), and (C) secondary tillers (Txy) with x = 2 (closed diamonds), x = 3 (closed triangles), x = 4 (open squares), x = 5 (closed circles) and x = 6 (open diamonds).
Secondary tillers emerged between 34 and 76 d after sowing (Fig. 9C). The secondary tillers were first visible at a precise stage of MS development, between emergence of leaves 10 and 11 (Fig. 9A). The time that the last secondary tillers appeared seemed to be more variable, and the synchronism with leaf appearance on the MS was less strict.
Tiller flowering. Inflorescences emerged between 97 and 111 d after sowing depending on the plant and the tiller rank. The probability of tillers reaching heading depended on their topological position and emergence time (Fig. 10). The primary tillers of increasing rank (T4, T5, T6 …) generally appeared successively on the MS with a decreasing flowering ratio. Of the overall primary tillers, 71 % flowered and nearly all of these were located on phytomers 4 to 7 where the probability of a bud developing into a tiller was greatest. In the few cases (5 %) in which this chronological order was not followed [a reversal of appearance: T4/T3 (n = 1) and T5/T4 (n = 3)], only the tiller that appeared first (T4, T5) reached the flowering state. Moreover, the high-rank tillers (T8 to T10) aborted in most cases (Fig. 3).
Fig. 10.
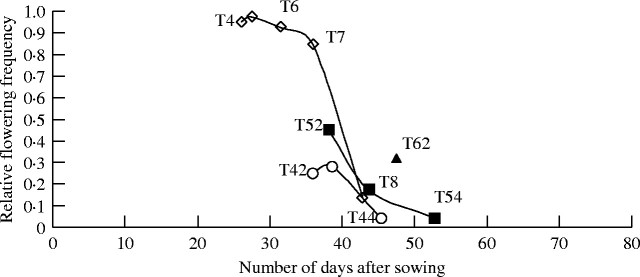
Relation between relative flowering frequency for primary tillers (Tx) and secondary tillers (Txy) according to their time of appearance (in days after sowing). Data are presented for primary tillers (open diamonds) and for secondary tillers (T4y = open circles; T5y = closed squares; T6y = closed triangles).
Flowering occurred on a small percentage (16 %) of the secondary tillers (Table 4), only at position 2 to 4 (Tx2 to Tx4) and seemed to depend on their location on the primary tillers. Flowering relative frequency (Ff) was higher for the secondary tillers on phytomers with a high branching frequency (T4, T5 and T6). The flowering frequency of secondary tillers decreased with their rank on the bearing axis (e.g. T42 > T43 > T44). For Tx4, the frequency was low (0·1) and reached zero for Tx5 (Table 4).
Table 4.
Flowering frequency (Ff) of secondary tillers depending on primary tiller rank (Tx) on the main stem and the rank of the phytomer (Txy) supporting the secondary tiller
| Bearing primary tiller (Tx) |
Tx2 |
Tx3 |
Tx4 |
Tx5 |
|---|---|---|---|---|
| T3 (n = 3) | 0 | 0 | ||
| T4 (n = 39) | 5 | 9 | 1 | 0 |
| T5 (n = 40) | 16 | 6 | 1 | 0 |
| T6 (n = 40) | 9 | 0 | ||
| T7 (n = 3) | 0 |
Generally, none of the primary or secondary tillers that appeared after emergence of the 12th leaf on the MS (i.e. around 45 d after sowing) flowered (Fig. 10).
DISCUSSION
This study highlighted the low level of variability in the structural and temporal changes occurring in a rice population and the dependency of tillers on both their topological location and the MS development stage. The principal changes identified were leaf size and tillering.
Blades were longer up to leaf 12 or 14, then decreased in length for the last leaves. Leaves were larger on tillers than the leaves of the same rank on the MS, but the flag leaf length was similar for all axes. The same variations in leaf size have previously been observed by Tivet et al. (2001) in other rice varieties. According to Hanada (1982) and Matsuo and Hoshikawa (1993) the increase in the size of rice tiller buds depends on apex size and causes an increase in leaf size. Likewise, Dale and Wilson (1979) showed in barley that during primordia formation the dome increases in size for each new primordium.
Anatomical studies of the apex have identified two or three leaf primordia plus three developing leaves in rice, irrespective of the stage of development (Sylvester et al., 2001). Our observations of the MS between the 3- and 8-leaf stages confirmed the systematic occurrence of three primordia, so it could be concluded that flowering is triggered at the 12–13 visible-leaves stage, [i.e. 16 (total number of leaves) minus 3 or 4 hidden foliar elements (primordia and young developing leaves)]. At this stage, the MS blade length decreased in the same manner as tiller blade length. Heading appeared to be synchronous for the MS and tillers, which suggests that floral initiation is triggered at the same time on the different axes and may therefore be linked to the reduction in blade length at the 12- to 13-leaf stage. These results suggest that the leaf changes observed may be related to the apical meristem of the bearer axis. This relationship between the end of elongation in the longest blade and floral initiation is consistent with wheat (Borrill, 1959) and other grasses. Likewise, Sylvester et al. (2001) demonstrated the importance of the changes that occur in leaf shape when switching to the reproductive stage. By the Newman–Keuls comparison of ranks over the three sub-populations checked by the F-test, the two leaves (12–13) were identified as belonging to the same cluster. Bos and Neutebom (1998) considered that the maximum leaf width and LER (leaf elongation rate) are explained by their dependence on the values for the previous leaf on the same tiller or on the parent tiller and could be related to the apical meristem of the bearer axis. However, Dale and Wilson (1979) believed that no critical dome size was necessary for the apex to produce an inflorescence. Likewise Gallagher (1979) considered that final leaf length in wheat and barley was not associated with changes in apical development stage or apical size.
Axillary buds either remained dormant, developed a few leaves before aborting, or reached flowering. Branching frequency showed that the main tillering zone was located between the phytomers in ranks 3 to 10 for primary tillers and in ranks 2 to 3 for secondary tillers. Analyses of branching frequency (Bf) (Fig. 3) and flowering frequency (Ff) (Table 4) resulted in very similar primary tiller classifications: T5 (Bf = 100 % and Ff = 97·5 %) > T6 (Bf = 100 % and Ff = 92·5 %) > T3 (Bf = 7·5 % and Ff = 5 %). The classification of flowering frequency in relation to branching orders was: order 1 = 100 % > order 2 = 70 % > order 3 = 16 %.
This hierarchy established a preferred tillering and flowering zone for specific phytomers related to the highest branching frequency. This concept of fertile tillers depending on their leaf axis of origin was also proposed for wheat by Masle-Meynard and Sebillote (1981), for rice by Wu et al. (1998) and for sorghum by Lafarge et al. (2002).
The development stage reached by the bearing axis played a significant role in tiller development, the triggering of tillering at the 7–8-leaf stage and the abortion of all tillers after the 10–12-leaf stage. Earlier emergence of primary tillers in this rice cultivar may possibly be linked to a higher probability of flowering. A similar result was reported in rice by Kim and Vergara (1991).
The chronological studies showed that the phyllochron is correlated with growth events. A shorter phyllochron may coincide with the triggering of branching and a longer phyllochron may be due to floral differentiation. The time that elapsed between the emergence of two leaves increased from the 10-leaf to the 12-leaf stage, and this led to the end of primary tillering and a decrease in secondary tillers' emergence rate. In rice, internode elongation starts at the same time as floral primordium differentiation (Matsuo and Hoshikama, 1993), but Yoshida (1981) concluded that early and late varieties start floral differentiation before and after internode elongation, respectively. Baker et al. (1980) determined that the increase in the phyllochron is associated with the time of floral initiation, whereas Nemoto and Yamazaki (1993) considered that the increase is related to internode elongation.
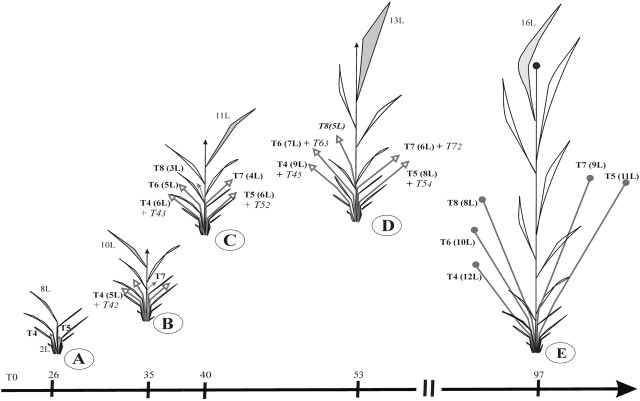
The dynamic approach presented in Fig. 11 can be used to quantify precise development stages of the MS in relation to tiller branching, flowering and mortality. Our results show the synchronous appearance of tillers and leaves on the MS throughout plant development until flowering, and a relation between emergence time and tiller flowering. Parallel trends for the phyllochron of the MS and tillers could explain why there are the same number of phytomers on the MS (16·2) and primary tillers (15·9). However, Skinner and Nelson (1994) and Bos and Neutebom (1998) found that the tiller phyllochron differs from the MS phyllochron. The synchrony between MS leaves and tillers has previously been described by several authors and for different grasses (Kirby, 1990; Hanada, 1993; Skinner and Nelson, 1994). In the same manner, co-ordination between primordium initiation and leaf expansion has been reported under a wide range of conditions in pea (Turc and Lecoeur, 1997). However, the mechanisms that result in this synchronism are poorly understood. It has been reported that the synchronism of events points to a key role by the cell division process in regulating leaf and tiller development in tall fescue (Skinner and Nelson, 1994). We also support this notion of rigid chronology in leaf initiation and development by physiological co-ordination in rice plant growth. Thus, morphological and temporal changes during plant development may be explained by the assumption of ‘assimilate availability’ (Lafarge et al., 2002). The greater the ability of the first tillers to draw assimilates compared with those developing later (Wu et al., 1998) could explain the hierarchy of branching and flowering frequencies. The enhanced competition for assimilates at flowering initiation and internode elongation (Tivet, 2000), and increased demand for resources in reproductive tillers (Briske, 1991), could explain the coincidence between vegetative tiller mortality, the flowering of bearing axes and the shorter length of the last leaves. Also, the temporal variation (phyllochron) may be interpreted as a dependence on resources such as carbohydrates, water, nutrients and light (quality, photoperiod and intensity) (McMaster et al., 2003). This interpretation is consistent with our data, which show both structural changes (reduction in blade length and tillering intensity, tiller development) and temporal changes (increased phyllochron). However, in our study we cannot exclude the implication of internal factors (relation or dependency between meristems, assimilates) and external factors (environmental) in the regulation of rice development.
Fig. 11.
Schematic diagram of rice development at different stages characterized by the number of leaves on the MS with reference to days after sowing. The number of emerged leaves on the tillers is indicated in brackets (xL). Primary tillers are represented in bold (Tx), secondary tillers in italics (TXy). (A) 8 leaves (8L) = emergence of first primary tillers (T4, T5). (B) 10L = emergence of first secondary tillers (Txy). (C): 11L = most of the primary tillers are emerged. (D) 13L = most of the secondary tillers are emerged. (E) 16L = heading on the MS and primary tillers.
CONCLUSIONS
Little variability was observed in structural and temporal characteristics, and rice appears to be hierarchical. The principal changes appeared relative to their topological location and to the developmental stage of the main stem. The emergence of the first tillers occurred at the 7-leaf emergence on the MS. The decrease in leaf size and the death of late tillers occurred at the floral initiation stage, identified when 12–13 leaves were visible on the MS. Rice plant development showed synchronies and was regular for all axes until flowering. This study showed the relevance of employing architectural analyses generally used for trees to describe and quantify development dynamics in a rice cultivar. Finally, our results could be placed in a database that may be used to develop rice plant simulation models, in particular with regard to the topological aspects of architectural development. Considerable genetic diversity is observed between rice cultivars and the effects of environmental factors show considerable phenotypical plasticity. It would therefore appear appropriate to experiment with the same cultivar under different environmental conditions and then to compare with other cultivars.
Acknowledgments
This study was part of the project ‘Comparative cartography of tropical plants (Gramineae)’ sponsored by CIRAD (Centre International de Recherche en Agronomie pour le Développement). Special thanks are due to Drs C. Edelin and M. Coumans for useful discussions, and to Dr P. Baradat for the statistical analysis.
LITERATURE CITED
- Baker CK, Gallagher JN, Monteith JL. 1980. Daylength change and leaf appearance in winter wheat. Plant, Cell & Environment 3: 285–287. [Google Scholar]
- Baradat P, Labbé T. 1995. Un logiciel intégré pour l'amélioration des plantes pérennes. In: Centre International de la Recherche Agronomique. Cultures pérennes (Cirad-Cp), ed. Traitements statistiques des essais de sélection. Stratégies de sélection des espèces pérennes. Montpellier, France: Cirad-Cp, 303–330. [Google Scholar]
- Bauer A, Frank AB, Black AL. 1984. Estimation of spring wheat leaf growth rates and anthesis from air temperature. Agronomy Journal 76: 829–835. [Google Scholar]
- Bell AD. 1991.Plant form: an illustrated guide to flowering plant morphology. Oxford: Oxford University Press. [Google Scholar]
- Besnard G, Baradat P, Bervillé A. 2001. Genetic relationships in the olive (Olea europaea L.) reflect multilocal selection of cultivars. Theoretical and Applied Genetics 102: 251–258. [Google Scholar]
- Besnard G, Baradat P, Bervillé A. 2002.Olea europaea (Oleacea) phylogeography based on chloroplast DNA polymorphism. Theoretical and Applied Genetics 104: 1353–1361. [DOI] [PubMed] [Google Scholar]
- Borrill M. 1959. Inflorescence initiation and leaf size in some gramineae. Annals of Botany 23: 217–226. [Google Scholar]
- Bos HJ, Neutebom JH 1998. Morphological analysis of leaf and tiller number dynamics of wheat (Triticum aestivum L.): responses to temperature and light intensity. Annals of Botany 81: 131–139. [Google Scholar]
- Briske DD. 1991. Development morphology and physiology of grasses. In: Heitschmidt RK, Stuth JW, eds. Grazing management. An ecological perspective. Portland, OR: Timber Press. [Google Scholar]
- Cox DR. 1967.Renewal theory. London: Chapman and Hall. [Google Scholar]
- Dale JE, Wilson RG. 1979. The effects of photoperiod and mineral nutrient supply on growth and primordial production at the stem apex of barley seedlings. Annals of Botany 44: 537–546. [Google Scholar]
- Gallagher JN. 1979. Field studies of cereals leaf growth. I: Initiation and expansion in relation temperature and ontogeny. Journal of Experimental Botany 30: 625–636. [Google Scholar]
- Gallagher JN, Biscoe PV. 1978. Radiation absorption, growth and yield of cereals. Journal of Agricultural Science 91: 47–60. [Google Scholar]
- Glaszmann JC. 1987. Isozyme and classification of Asian rice varieties. Theoretical and Applied Genetics 74: 21–30. [DOI] [PubMed] [Google Scholar]
- Guédon Y, Cocozza-Thivent C. 2003. Nonparametric estimation of renewal processes from count data. Canadian Journal of Statistics 31: 191–223. [Google Scholar]
- Guédon Y, Costes E. 1997. Modélisation de la croissance d'un axe végétatif: In: Bouchon J, Reffye P de, Barthélémy D, eds. Modélisation et simulation de l'architecture des végétaux. Paris, France: Science Update, INRA Editions, 173–185. [Google Scholar]
- Guédon Y, Monsan V. Nonparametric estimation of renewal processes from time interval data. Journal of Statistical Planning and Inference (in press). [Google Scholar]
- Godin C, Caraglio Y. 1998. A multiscale model of plant topological structures. Journal of Theoretical Biology 19: 1–46. [DOI] [PubMed] [Google Scholar]
- Godin C, Costes E, Caraglio Y. 1997. Exploring plant topological structures with the AMAPmod software: an outline. Silva Fennica 31: 357–368. [Google Scholar]
- Godin C, Guédon Y, Costes E, Caraglio Y. 1997. Measuring and analyzing plants with the AMAPmod software. In: Michalewicz MT, ed. Advances in computational life sciences. Vol. 1. Plants to ecosystems. Collingwood, Australia: CSIRO Publishing, 53–84. [Google Scholar]
- Hanada K. 1982. Differenciation and development of tiller buds in rice plants. Japan Agricultural Research Quarterly 26: 79–86. [Google Scholar]
- Hanada K. 1993. Morphology and development of vegetative organs. 4. Tillers. In Matsuo T, Hoshikama K, eds. Science of the rice plants. Vol. 1 Morphology. Tokyo: Food and Agricultural Policy Research Center, 222–258. [Google Scholar]
- Harper J, Rosen B, White J. 1986.The growth and form of modular organisms. London: The Royal Society. [Google Scholar]
- Jeannoda-Robinson V. 1977.Contribution à l'étude de l'architecture des herbes. PhD Thesis. University Sciences et Techniques du Languedoc, Montpellier, France. [Google Scholar]
- Katayama T. 1951.Studies on tillering of rice, wheat and barley. Tokyo: Yokendo. [Google Scholar]
- Kempthorne OR. 1957.An introduction to genetic statistics. New York: Wiley. [Google Scholar]
- Kim JK, Vergara BS. 1991. Morpho-anatomical characteristics on spikelet filling of different tiller orders in rice. Korean Journal of Crop Science 36: 521–531. [Google Scholar]
- Kiniry JR, Rosenthal WD, Jackson BS, Hoogenboom G. 1991. Predicting leaf development of crop plants. In: Hodges T, ed. Predicting crop phenology. Boca Raton, Florida: CRC Press, 29–42. [Google Scholar]
- Kirby EJM. 1990. Co-ordination of leaf emergence and leaf and spikelet primordium initiation in wheat. Field Crops Research 25: 253–264. [Google Scholar]
- Kirby EJM, Appleyard M, Fellowes G. 1985. Leaf emergence and tillering in barley and wheat. Agronomie 5: 193–200. [Google Scholar]
- Klepper B, Rickman RW, Peterson CM. 1982. Quantitative characterization of vegetative development in small cereal grains. Agronomy Journal 74: 789–792. [Google Scholar]
- Lafarge TA, Broad IJ, Hammer GL. 2002. Tillering in grain sorghum over a wide range of population densities: Identification of a common hierarchy for tiller emergence, leaf area development and fertility. Annals of Botany 90: 87–98. [DOI] [PMC free article] [PubMed] [Google Scholar]
- Li X, Qian Q, Fu Z, Wang Y, Xiong G, Zeng D, Wang X, Liu X, Teng S, Hiroshi F, et al. 2003. Control of tillering in rice. Nature 422: 618–621. [DOI] [PubMed] [Google Scholar]
- Masle-Meynard J, Sebillote M. 1981. Etude de l'hétérogéneité d'un peuplement de blé d'hiver. I Notion de structure du peuplement. Agronomie 1: 217–224. [Google Scholar]
- Matsuba K. 1988. Morphological studies on the regularity of shoot development in rice plants. III. Regularity of the total number of leaves emerging in tillers. Japanese Journal of Crop Science 57: 614–620. [Google Scholar]
- Matsuo T, Hoshikawa K. 1993.Science of the rice plant. Vol. 1, Morphology. Tokyo: Food and Agriculture Policy Research Center. [Google Scholar]
- McMaster G, Wilhelm WW, Palic DB, Porter JR, Jamieson PD. 2003. Spring wheat leaf appearance and temperature: extending the paradigm? Annals of Botany 91: 697–705. [DOI] [PMC free article] [PubMed] [Google Scholar]
- Miller BC, Hill JE, Roberts SR. 1991. Plant population effects on growth and tied in water-seeded rice. Agronomy Journal 83: 291–297. [Google Scholar]
- Moulia B, Edelin C, Loup C, Jeuffroy MH. 1999. Architectural analysis of herbaceous crop species: a comparative study of maize (Zea mays L.) and garden pea (Pisum sativum L.). Agronomie 19: 305–312. [Google Scholar]
- Moulia B, Loup C, Chartier M, Allirand JM, Edelin C. 1999. Dynamics of architectural development of isolated plants of maize (Zea mays L.), in a non-limiting environment: the branching potential of modern maize. Annals of Botany 84: 645–656. [Google Scholar]
- Nemoto K, Yamazaki K. 1993. Morphological studies of the rice plants. 2. Correlative development of vegetative organs. In Matsuo T, Hoshikama K, eds. Science of the rice plants. Vol. 1. Morphology. Tokyo: Food and Agricultural Policy Research Center, 625–627. [Google Scholar]
- Ritchie JT, Nesmith DS. 1991. Temperature and crop development. In: Hanks RJ, Ritchie JT, eds. Modeling plant and soil systems. Madison, Wisconsin: American Society of Agronomy, 5–29. [Google Scholar]
- Searle SR. 1987.Linear models for unbalanced data. New York: Wiley. [Google Scholar]
- Searle SR, Casella G, McCulloch CM. 1992.Variance components. New York: Wiley. [Google Scholar]
- Shao J, Tu D. 1995.The jackknife and bootstrap. New York: Spinger. [Google Scholar]
- Sié M, Dingkuhn M, Wopereis MCS, Miezan KM. 1998. Rice crop duration and leaf appearance rate in a variable thermal environment. III. Heritability of photothermal traits. Field Crops Research 58: 141–152. [Google Scholar]
- Skinner RH, Nelson CJ. 1994. Epidermal cell division and the coordination of leaf and tiller development. Annals of Botany 70: 493–499. [DOI] [PubMed] [Google Scholar]
- Sokal RR, Rohlf FJ. 1995.Biometry, 3rd edn. New York: Freeman. [Google Scholar]
- Stafstrom JP. 1995. Influence of bud position and plant ontogeny on the morphology of branch shoots in pea. Annals of Botany 76: 343–348. [Google Scholar]
- Sylvester AW, Parker-Clark V, Murray GA. 2001. Leaf shape anatomy as indicators of phase change in the grasses: comparison of maize, rice, and bluegrass. American Journal of Botany 88: 2157–2167. [PubMed] [Google Scholar]
- Tivet F. 2000.Etude des facteurs génotypiques et environnementaux déterminant la mise en place de la surface foliaire chez le riz (Oryza sativa L.et Oryza glaberrima Steud). Incidence particulière d'un déficit hydrique. PhD Thesis, Institut National de la recherche Agronomique Paris-Grignon, France. [Google Scholar]
- Tivet F, DA Silveira Pinheiro B, De Raïssac M, Dingkuhn M. 2001. Leaf blade dimensions of rice (Oryza sativa L. and Oryza glaberrima Steud.). Relationships between tillers and the main stem. Annals of Botany 88: 507–511. [Google Scholar]
- Turc O, Lecoeur J. 1997. Leaf primordium initiation and expanded leaf production are co-ordinated through similar responses to air temperature in Pea (Pisum sativum L.). Annals of Botany 80: 265–273. [Google Scholar]
- Wilhelm WW, McMaster GS. 1995. Importance of the phyllochron in studying development and growth in grasses. Crop Science 35: 1–3. [Google Scholar]
- Wu G, Wilson LT, McClung AM. 1998. Contribution of rice tillers to dry matter accumulation and yield. Agronomy Journal 90: 317–323. [Google Scholar]
- Yin X, Kropff MJ. 1996. The effect of temperature on leaf appearance in rice. Annals of Botany 77: 215–221. [Google Scholar]
- Yoshida S. 1981. In: International Rice Research Institute (IRRI), ed. Fundamentals of rice crop science. Los Baños, Philippines: IRRI, 269 pp. [Google Scholar]


