

Abstract
• Background and Aims Monsi and Saeki (1953) published the first mathematical model of canopy photosynthesis that was based on the light attenuation within a canopy and a light response of leaf photosynthesis. This paper reviews the evolution and development of their theory.
• Scope Monsi and Saeki showed that under full light conditions, canopy photosynthesis is maximized at a high leaf area index (LAI, total leaf area per unit ground area) with vertically inclined leaves, while under low light conditions, it is at a low LAI with horizontal leaves. They suggested that actual plants develop a stand structure to maximize canopy photosynthesis. Combination of the Monsi–Saeki model with the cost–benefit hypothesis in resource use led to a new canopy photosynthesis model, where leaf nitrogen distribution and associated photosynthetic capacity were taken into account. The gradient of leaf nitrogen in a canopy was shown to be a direct response to the gradient of light. This response enables plants to use light and nitrogen efficiently, two resources whose supply is limited in the natural environment.
• Conclusion The canopy photosynthesis model stimulated studies to scale-up from chloroplast biochemistry to canopy carbon gain and to analyse the resource-use strategy of species and individuals growing at different light and nitrogen availabilities. Canopy photosynthesis models are useful to analyse the size structure of populations in plant communities and to predict the structure and function of future terrestrial ecosystems.
Keywords: Monsi–Saeki theory, Boysen Jensen, canopy photosynthesis, light, nitrogen, resource use, cost–benefit analysis, competition, coexistence, size structure, model, plant community
INTRODUCTION
Masami Monsi (1914–1997) and Toshiro Saeki (1927–2004) published the paper ‘Über den Lichtfaktor in den Pflanzengesellschaften und seine Bedeutung für die Stoffproduktion’ (‘On the factor light in plant communities and its importance for matter production’) in the Japanese Journal of Botany in 1953. This paper is now well known as the first that presented a mathematical model of canopy photosynthesis. They quantified attenuation of light through the canopy and modelled canopy photosynthesis as an integration of photosynthesis of leaves exposed to different light climates in the canopy. They demonstrated that stand structures develop to maximise canopy photosynthesis under a given light climate. The paper opened a new research area on canopy structure and function and is still an inspiration for plant ecologists, botanists and agronomists today. Yet, in spite of its importance, its acceptance by scientists in the western hemisphere was delayed by more than ten years (de Wit, 1965; Monteith, 1965; Ross, 1981; for review see Monsi et al., 1973), probably because it was published in German in a local journal.
There is a history behind the development of any new idea, and the Monsi–Saeki theory is no exception. It has its roots in the work of Boysen Jensen (1932), a Danish plant physiologist. Boysen Jensen (1883–1959) was the founder of the science of dry mass production of plants. He wrote in the preface of his book (1932) that ‘sie bilden einen Versuch, den Schwerpunkt der Lehre von der Stoffproduktion der Pflanzen dorhin zu verlegen, wo sie meiner Meinung nach liegen muß: In die CO2-Assimilation der Blätter’ (‘those publications attempt to shift the emphasis of the study of biomass production by plants to where, according to me, it should be: leaf CO2 assimilation’). He thus emphasized CO2 assimilation of leaves in the study of dry mass production in plants. He first studied canopy photosynthesis in relation to stand structure, and suggested the importance of leaf arrangement in the plant stand. Suppose a stand has a LAI (leaf area index, total leaf area per unit ground area) of 3, i.e. the stand maintains a leaf area three times more than the ground area beneath it. When leaves are arranged horizontally as shown in Fig. 1A(a), only leaves in the first layer receive full light, whereas leaves in lower layers receive light that has penetrated the first layer and that is close to or less than the light compensation point. If the same amount of leaf area is arranged with inclinations within the canopy [Fig. 1A(b)], then light reaches every leaf more uniformly. Boysen Jensen noted that actual plants indeed have canopies with vertically inclined rather than horizontal leaves to distribute light uniformly within the canopy and thus to use light efficiently. For another example, Boysen Jensen established a small experimental stand of plants to measure the whole-canopy photosynthesis of the stand. He demonstrated that canopy photosynthesis was not saturated, while photosynthesis of a single leaf was saturated at relatively low light intensities (Fig. 1B).
Fig. 1.
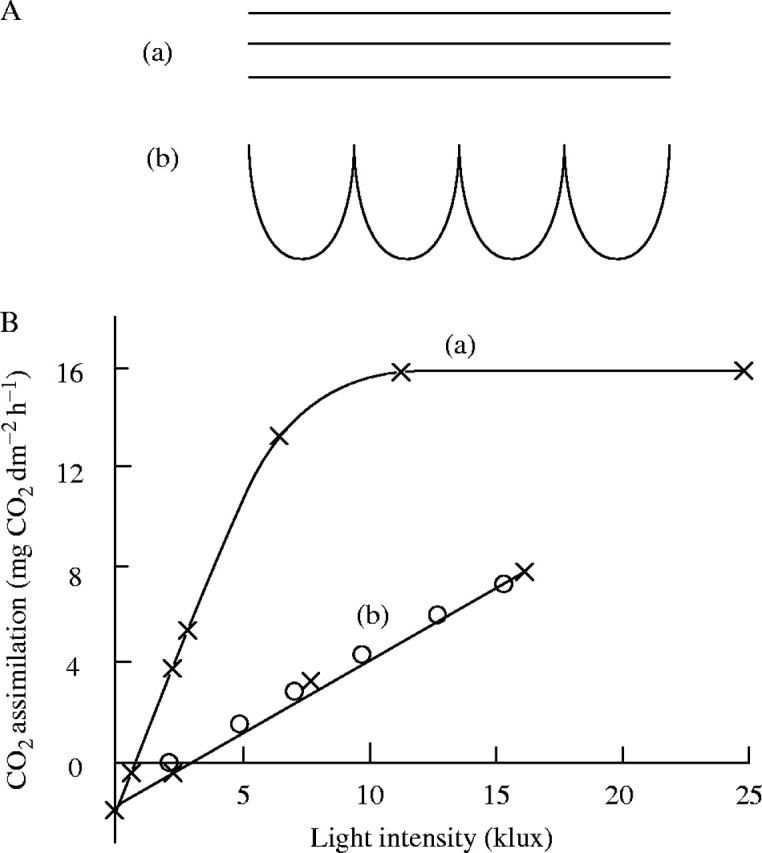
(A) Schematic arrangements of photosynthetic tissues. (a) Three layers of photosynthetic tissues placed horizontally. (b) The same area placed with inclination. (B) Light-response curve of photosynthesis of (a) a single leaf and (b) a stand of Sinapis alba, where both are presented on a leaf area basis. Stand photosynthesis is obtained by multiplying b by 3·4 (= LAI). Canopy photosynthesis calculated with eqn (4) by Monsi and Saeki (1953) is added as open circles. Redrawn with modifications from Boysen Jensen (1932). Note that 1 klux corresponds to 18 μmol photons m−2 s−1 for daylight PAR (Larcher, 1995).
THE MONSI–SAEKI THEORY OF CANOPY PHOTOSYNTHESIS
Monsi and Saeki (1953) refined the idea of Boysen Jensen to develop a quantitative theory of canopy structure and function. They devised a stratified clipping technique to describe the structure of plant communities. Vertical distribution of plant mass was presented in a figure separately for photosynthetic and non-photosynthetic tissues together with a distribution of light intensity (see fig. 1 in Monsi and Saeki, 1953; reproduced in this issue). This figure was named ‘the productive structure of a plant community’ to imply that plant function is determined by the structure of the stand and, inversely, that the stand structure is determined by plant functions. Light attenuates more strongly in a stand of plants having horizontal leaves (broad-leaf type) than in a stand with vertical leaves (grass type). They found that light attenuation in the canopy was approximated by Beer's Law:
 |
where I is the photosynthetic photon flux density (PPFD) measured on a horizontal plane, F is the leaf area index cumulated from top of the canopy, and K is the extinction coefficient. I0 is the PPFD above the canopy. They showed that if small horizontal leaves were distributed randomly in the canopy, K should be equal to 1. In reality, leaves are not small enough to comply with theory and are sometimes large, they are not horizontal but inclined, and they are not randomly distributed but are clumped or uniformly distributed. K-values deviate from 1 accordingly, and change from 0·3 to 2·0 (Monsi and Saeki, 1953). They noted that K in a canopy with horizontal leaves was commonly 0·7–1·0, whereas K in a canopy with vertically inclined leaves was 0·3–0·5.
The PPFD that leaves receive within the canopy (I′) is different from PPFD on a horizontal plane (I) because leaves are not horizontally distributed in the canopy. They showed that I′ is calculated from eqn (1) as
 |
where m is the transmittance of a leaf (Saeki, 1960). It is assumed that only leaves intercept PPFD in the canopy. A rectangular hyperbola was employed to describe the net photosynthesis of a single leaf (p) as a function of I′:
 |
where a and b are constants that characterise the light-response curve, and r is dark respiration (Tamiya, 1951). Substituting eqn (2) into (3) and integrating with respect to F from 0 to F, they calculated canopy photosynthesis, P, as
 |
(Monsi and Saeki, 1953; Saeki, 1960). This equation was tested with the Sinapis alba stand of Boysen Jensen assuming m = 0 and K = 1, and with the parameters for leaf photosynthesis of this species (Fig. 1B). The result (table 8a in Monsi and Saeki, 1953) gave a good agreement with the experimental result, as is shown by the open circles here in Fig. 1B. Equation 4 implies that canopy photosynthesis is determined by stand structure (K and F), leaf physiology (a, b and r), an optical property of a leaf (m), and the light environment (I0).
Figure 2A shows canopy photosynthesis under full light conditions as a function of F. Canopy photosynthesis of the stand is maximized with a low K at a higher F. This result demonstrates well why many canopies developing under full sunlight have a value of K around 0·7 and LAI around 5. The optimal LAI is defined by the lowest leaves that receive PPFD at the light compensation point (I′c), where daily leaf photosynthesis is cancelled out by respiration. At the light compensation point, the following two equations hold:
 |
and
 |
Eliminating I′c from both equations, the optimal LAI (Fopt) was derived:
 |
Substitution of eqn (7) for F in (4) gives the maximal canopy photosynthesis [Pmax = P(Fopt)]:
 |
This Pmax is plotted against the relative incident radiation for different K-values in Fig. 2B, which shows that a canopy with a small K responds to irradiance more strongly than one with a large K. At high irradiance canopy photosynthesis is maximized at a small K, whilst at low irradiance it is maximized at a larger K. These predictions are in agreement with our every-day experience: thick vegetation develops in open habitats, where most leaves are vertically inclined. In forest understoreys, we see flat leaves sparsely distributed in one layer. Kuroiwa (1971) proposed an ideal distribution of leaf angles in the canopy in which leaves change their angle from vertical at the top to horizontal at the bottom. However, many species in open habitats have leaf angles more horizontal than the expectation from the optimization theory. Later, Hikosaka and Hirose (1997) showed that in an evolutionary stable pattern of leaf angles of individuals subject to competition, the leaves are more horizontal than would lead to maximal photosynthesis. In the period of the International Biological Programme (IBP, 1964–1974), the Monsi–Saeki theory was broadly applied to study primary production in a range of plant communities from grasslands to forests and from natural vegetation to agricultural crops (Monsi, 1968; Monsi et al., 1973; Kira, 1975; Saeki, 1975).
Fig. 2.
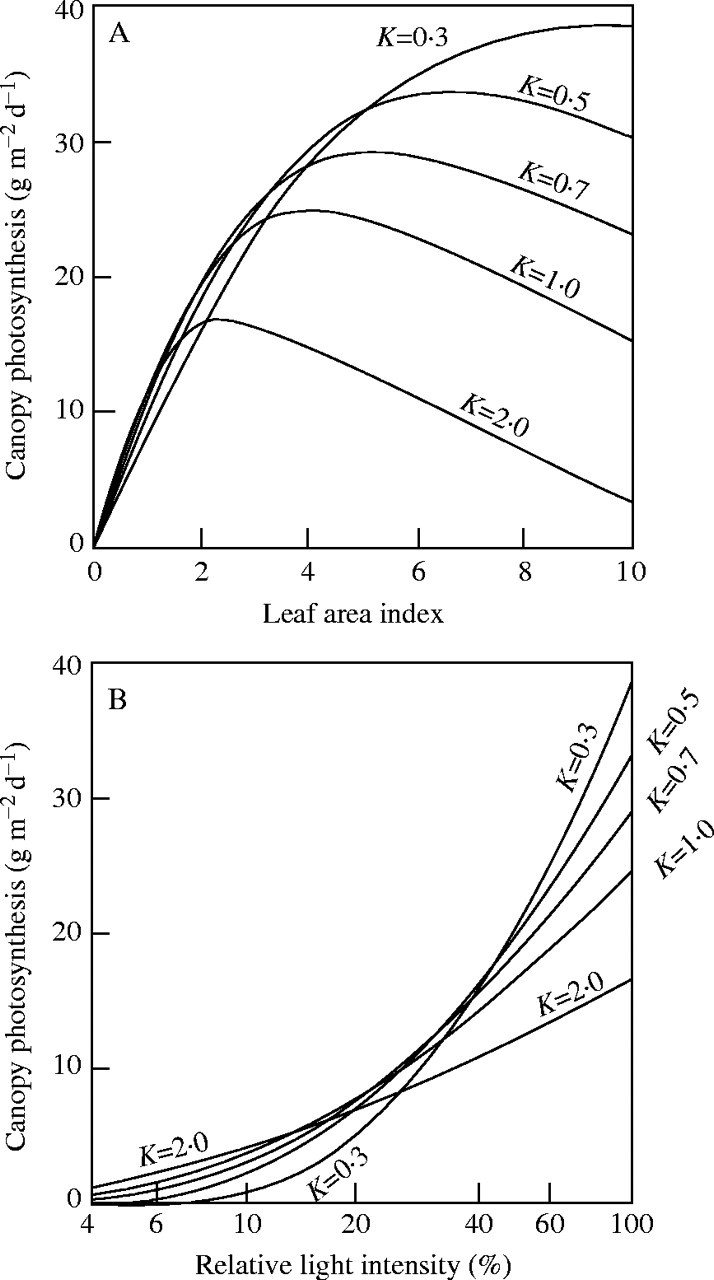
(A) Daily canopy photosynthesis of a Celosia cristata stand under full daylight (100 %) calculated from eqn (4), plotted as a function of leaf area index. Different K-values are assumed. (B) Daily maximum canopy photosynthesis as a function of relative incident radiation. Calculated from eqn (8) for different K-values. Redrawn after Saeki (1960).
The canopy photosynthesis model of Monsi and Saeki (1953) explained well the different stand structures that develop depending on a given light environment. However, some caveats should be stated here. First, the assumption that every leaf in the canopy has the same photosynthetic characteristics is not true. Sun and shade leaves differentiate within a stand and they have different photosynthetic capacities from each other (Boardman, 1977; Björkman, 1981). [McCree and Troughton (1966) suggested that the optimal LAI as assumed by Monsi and Saeki (1953) would not exist because shade leaves have a lower light compensation point.] However, Saeki (1959) noted that as the contribution of shaded leaves to total canopy photosynthesis was small, canopy photosynthesis calculated based on the photosynthesis of sun leaves gave virtually the same result as that calculated based on different photosynthetic capacities between sun and shade leaves. As will become clear from the remainder of this review, consideration of the photosynthetic capacity of leaves in different layers in the canopy provides new insights into canopy photosynthesis with respect to the resource use strategy of plants. The second caveat to be noted is that Monsi and Saeki (1953) assumed diffuse light (or overcast conditions, with parallel light coming from all directions) to derive eqn (1), on which their canopy photosynthesis model was built. Under sunny conditions, however, light distribution is more heterogenous within the canopy: deep in the canopy, some leaves that receive sunflecks are sun-lit, whilst the others are shaded to different degrees. In such a situation, an assumption of overcast conditions over-estimates canopy photosynthesis, owing to the non-linearity of the light response of photosynthesis. The role of diffuse vs direct light on canopy photosynthesis was considered first by de Wit (1965) and Duncan et al. (1967), and has received renewed interest by Gu et al. (1999) and Roderick et al. (2001) (see Farquhar et al., in later issue). The third caveat is that however well the ‘optimal’ LAI might explain the natural pattern observed, it must not be interpreted that the optimum has been realized at the stand level through natural selection. Individuals, not whole stands of vegetation, are the unit of natural selection (Williams, 1966). The optimal may be realized in isolated individuals and in those that produce a large canopy, such as clonal plants and trees, but not in individuals interacting and competing with each other (see Anten, 2005). Nonetheless, the theory and the concept of optimal LAI has a practical importance for agricultural management and the breeding of cultivars to increase crop yields (Loomis and Williams, 1969).
COST–BENEFIT ANALYSIS OF RESOURCE USE
Mooney and Gulmon (1979) introduced the concept of costs and benefits in the study of resource use by plants with an econometric analogy. It is well known that there is a strong correlation between photosynthetic capacity and leaf nitrogen (Natr, 1975; Field and Mooney, 1986), because more than half of the nitrogen in a leaf is directly involved in photosynthesis (Evans, 1989; Evans and Seemann, 1989). The rate of photosynthesis increases with increasing protein content of a leaf. A question then arises: why don't all plants have high leaf-protein contents and hence high photosynthetic rates? Mooney and Gulmon (1979) answered this question by assuming costs in manufacturing proteins for photosynthetic carbon gains. In a light-limited habitat, photosynthesis saturates at a lower enzyme content than in a light-unlimited habitat (Fig. 3), indicating that plants growing in low light conditions should have leaves with low enzyme contents. Now assume that there are costs (C) in manufacturing enzyme proteins (E) and that the costs increase with increasing investment of proteins. To maximize net carbon gain [i.e. the difference between photosynthesis (P) and C, P − C], the partial derivative of (P − C) with respect to E should equal to zero: δ(P − C)/δE = 0. Then,
 |
Fig. 3.

Photosynthesis (P) increases with increasing enzyme content (E), but saturates at higher E. Saturation starts earlier in a light-limited (A) than light-unlimited (B) habitat. The slope of the tangent lines represents the cost (C) of manufacturing one unit of enzyme. The tangent point defines the optimal enzyme investment (EA,opt and EB,opt) that maximizes photosynthesis per enzyme content. See text for further explanation. Modified from Mooney and Gulmon (1979).
This equation defines the optimal amount of enzymes that should be invested within a leaf. The left- and right-hand sides of this equation are called ‘marginal gain’ and ‘marginal cost’, respectively. While marginal gain decreases with an increase in enzyme investment, plants should invest to the point at which the marginal cost (represented by the tangent lines in Fig. 3) exceeds the marginal gain. Note that the optimal enzyme content is smaller in a light-limited than in a light-unlimited habitat (Fig. 3).
Field (1983) formulated the allocation of leaf nitrogen for the maximization of carbon gain as
 |
where pday is the daily carbon gain, nL is leaf nitrogen per unit leaf area and λ is a constant. This equation may be derived from eqn (9) by substituting P and C for pday and nL, respectively, with the assumption that the marginal cost is constant. Since at high nL the marginal gain is higher at high rather than at low irradiance, nitrogen should be allocated in the canopy such that leaves receiving the highest irradiance have the highest nitrogen per unit leaf area. Field (1983) applied this concept to a Californian chaparral shrub Lepechinia calycina and calculated daily carbon gain for different distributions of nitrogen in the canopy. However, profits from distributing nitrogen non-uniformly in the canopy were not large. The optimal distribution increased canopy photosynthesis by 3 % and the actual distribution increased it by 1 %, as compared with uniform distribution. Field suggested that 1–3 % benefits can be still larger than the cost involved in nitrogen redistribution (i.e. protein degradation, transport and loading of amino acids, and re-synthesis of proteins). Mooney et al. (1981) demonstrated that nitrogen redistribution is much more rapid in annual species native to closed-canopy habitats than in annuals of open habitats, implying that the potential importance of nitrogen distribution in the canopy increases with a larger gradient of irradiance. Assuming that photosynthetic capacity is linearly related to leaf nitrogen, Charles-Edwards et al. (1987) described a pattern of nL that declines in proportion to the degree of shade within a canopy.
LEAF NITROGEN DISTRIBUTION AND CANOPY PHOTOSYNTHESIS
Hirose and Werger (1987a, b) studied canopy photosynthesis in a Solidago altissima stand. This is a clonal species that produces many leaves along a tall stem without branching, and often makes a dense, pure stand in flood plains and in an abandoned fields (Iwaki et al., 1969; Hirose, 1971; Kitamoto, 1972). Hirose and Werger (1987b) found that leaf nitrogen content per area (nL) decreased exponentially with increasing LAI cumulated from the top of the canopy (F):
 |
where Ft is the total LAI, n0 is leaf nitrogen per area at the top of the canopy, and Ka is the coefficient of nitrogen allocation in the canopy. Ka = 0 indicates a uniform distribution of nitrogen, in which every leaf has a nitrogen concentration equal to the mean. Ka increases with increasing non-uniformity of nitrogen distribution where upper leaves have higher nitrogen per unit leaf area than lower ones.
Hirose and Werger (1987b) modelled canopy photosynthesis of the Solidago stand, extending the Monsi–Saeki model with nitrogen distribution in the canopy being taken into account. Leaf net photosynthesis (p) as a function of PPFD (I′) was described by a non-rectangular hyperbolic equation (Johnson and Thornley, 1984):
 |
This equation includes four parameters: ϕ, the initial slope; pmax, the light-saturated rate of photosynthesis; θ, a curvature factor; and r, dark respiration. As these parameters were found to be a function of leaf nitrogen per area (nL), leaf net photosynthesis was calculated for a given leaf nitrogen under a given irradiance (Hirose and Werger, 1987a). Combining light [eqn (2)] and nitrogen [eqn (11)] distribution within the canopy and leaf photosynthesis as a function of light and nitrogen [eqn (12)] with a daily change in PPFD gave a daily canopy carbon gain.
Table 1 shows the effect of nitrogen distribution on daily canopy carbon gain. A large increase was found in actual and optimal nitrogen distribution as compared with uniform distribution. Non-uniform distribution benefited actual plants by 21 %, although the value was lower than the 27 % increase assumed by an optimal distribution. Large profits of non-uniform nitrogen distribution were demonstrated both in herbaceous species, Lysimachia vulgaris (27 % increase in actual over uniform distribution, Pons et al., 1990) and Carex acutiformis (28 %; Werger and Hirose, 1991; Schieving et al., 1992a), and in a broad-leaved evergreen tree Nothofagus fusca (6 %, Hollinger, 1996). Anten et al. (1995a) showed that profits from non-uniform distribution in actual plants were larger in dicots (41 % in Glycine max and 35 % in Amaranthus cruentus) than in monocots (14 % in Oryza stativa and 13 % in Sorghum bicolor). However, none of these plants attained the optimal N distribution. Actual plants distribute N more uniformly than the optimal distribution. Why didn't plants exhibit optimal N-distribution when this optimization would further enhance their carbon gain? A clue may be found in the range of nitrogen concentrations (see the last column in Table 1). The difference between actual and optimal distribution implies that optimal nitrogen distribution leads to leaf nitrogen per unit area that is too low at the bottom and too high at the top to be realized. Some nitrogen may not be capable of translocation, and a certain amount of nitrogen is necessary to utilize sunflecks that leaves receive in lower layers in the canopy (see Pons et al., 1990). On the other hand, high nitrogen may be risky: when plants are subjected to herbivory, they would loose a large amount of nitrogen at once (Stockhoff, 1994). Under a risk of herbivory, marginal costs increase with increasing nitrogen investment (Mooney and Gulmon, 1979).
Table 1.
Predicted daily canopy photosynthesis for a Solidago altissima stand with uniform, actual and optimal nitrogen distributions among leaves. Ka, the coefficient of nitrogen allocation; Pday, daily canopy photosynthesis; nL, nitrogen per leaf area. Ft = 4·24 m2 m−2, Nt = 5·62 gN m−2, PPFD = 43·2 mol m−2 d−1. From Hirose and Werger (1987b)
|
Ka |
Pday (mol CO2 m−2 d−1) |
nL (gN m−2) |
|
|---|---|---|---|
| Uniform | 0 | 0·614 (100 %) | 1·33 |
| Actual | 0·80 | 0·744 (121 %) | 0·86–1·92 |
| Optimal | 1·30 | 0·781 (127 %) | 0·65–2·37 |
Large returns from non-uniform distribution contrast with Lepechinia calycina where the effect of non-uniform distribution was small (see above; Field, 1983). The apparent disagreement between the result of Field and ours was solved by a model simulation. Hirose and Werger (1987b) calculated the daily carbon gain for different availabilities of nitrogen and leaf area index (Fig. 4). Leaf area as well as nitrogen availability were doubled or halved relative to those found in the Solidago altissima stand. Nitrogen was distributed either uniformly or optimally in the canopy. The effect of non-uniform distribution was larger in a dense than in an open stand. An open canopy showed a very small effect of 2–3 %, similar to the result of Field (1983). In reality, the Californian chaparral had an open canopy where the darkest microsite still received 20 % of full irradiance, which corresponds to LAI = 2·3 in our model. Plants in a dense stand benefit more from non-uniform distribution of nitrogen than those in an open stand, and dense canopies are expected to develop a steeper gradient of nitrogen than open canopies. In accordance with this expectation, a dense stand of Lysimachia vulgaris developed a steeper gradient of nitrogen than an open stand (Hirose et al., 1988). At flowering and early seed ripening of S. altissima, part of the leaf nitrogen was translocated to reproductive structures. As a result less nitrogen was available for photosynthesis and lower leaves were dropped, with the remaining leaves being kept within the same range as before flowering and the gradient of leaf nitrogen becoming less steep (Werger and Hirose, 1988, 1991; Schieving et al., 1992b). Leaf area index of the canopy appears to be the key regarding how nitrogen gradients will be set up. Strong gradients of nitrogen were found to develop in dense oak forest canopies (LAI up to 6; Wilson et al., 2000), while most leaves had the same nitrogen in open oak savanna (LAI about 0·6; Xu and Baldocchi, 2003).
Fig. 4.
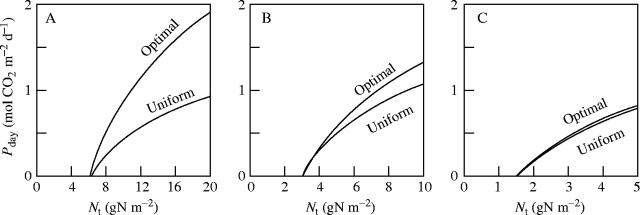
Daily canopy photosynthesis (Pday) versus total leaf nitrogen (Nt) under the optimal and uniform nitrogen allocation program. The optimal allocation was determined by eqn (10). Note different scales on the x-axis. (A) Ft = 8·48 m2 m−2; (B) 4·24 m2 m−2; (C) 2·12 m2 m−2. From Hirose and Werger (1987b).
An important question raised from the optimal allocation theory is what controls nitrogen distribution within the canopy. As new leaves are produced at top of the plant, which is exposed to full irradiance, and as young leaves are usually high in protein content, leaf age was suggested to control the allocation program (Field, 1983; Field and Mooney, 1983), although the effect of ageing was different in extent between species native to closed habitats and those native to open canopy habitats (Mooney et al., 1981). Hirose et al. (1989) studied nitrogen distribution in a stand of a monocotyledonous species, Carex acutiformis. As this species is a rosette plant having a meristem at the base of the plant, the youngest portion of a leaf blade is always subject to the lowest irradiance within the canopy. New leaf blades are produced in the centre and push older blades outwards, thus facilitating a comparison of nitrogen in leaf blades with different ages but exposed to the same light intensity. It was found that nitrogen distribution was correlated strongly with the light gradient in the canopy (r = 0·82–0·91), with only a small effect of leaf age (r = 0·16–0·39). Pons et al. (1993) demonstrated that this species developed little gradient of nitrogen when leaves were illuminated uniformly from the top to bottom. Vines provide a useful material to study the control of leaf nitrogen, presenting leaves that can be exposed naturally or experimentally to different irradiance independently of leaf age. Ackerly (1992) found that leaf nitrogen in a tropical vine Synogonium podophyllum was more strongly determined by light than by leaf age. Hikosaka et al. (1994) subjected a vine Ipomoea tricolor to reverse canopy-type shading (progressively shading younger leaves) and found the more illuminated older leaves had a higher leaf nitrogen per area than the more shaded younger leaves. The importance of irradiance rather than age in determining leaf nitrogen was also shown in individuals with different heights in a dense stand (Anten and Werger, 1996; Anten et al., 1998; for review, Anten et al., 2000; but see Kitajima et al., 2002, 2005).
Theoretically, canopy photosynthesis is maximized when each leaf in the canopy receives irradiance in proportion to the associated photosynthetic capacity (Farquhar, 1989; see also Terashima et al., 2005):
 |
where 1, 2, 3, … indicate different leaves. Assuming that the photosynthetic capacity is proportional to the amount of nitrogen directly involved in photosynthesis, Anten et al. (1995a) derived the optimal nitrogen distribution:
 |
where Nt is the total amount of leaf canopy nitrogen, Ft is the total LAI, and nb is the leaf nitrogen per area that is not involved in photosynthesis. Equation (14) indicates that the photosynthetic nitrogen (nL − nb) decreases exponentially as a function of F where the proportionality constant is K, the light extinction coefficient [see eqn (1)]. Nitrogen distribution is primarily determined by the structure of the canopy (K), by the availability of nitrogen (Nt), and by the amount of nitrogen invested to structural components of the leaf (nb). It is independent of leaf physiology and the absolute amount of photons that plants receive. Reduction in nL with increasing depth in the canopy has been observed both in agricultural crops and wild plants, and in both herbaceous and woody species (Grindlay, 1997).
These experimental and theoretical studies supported the hypothesis that the gradient of leaf nitrogen that develops in a canopy is a direct response to the gradient of light. Leaf age plays a secondary role in the development of the gradient of leaf nitrogen. The gradient benefits plants through the efficient use of light and nitrogen, two resources whose supply is limiting in the natural environment. Chen et al. (1993) proposed the co-ordination theory to explain nitrogen distribution in a canopy. It assumed that photosynthesis is limited by either the RuBPCase-limited rate of carboxylation (Wc) or the electron transport-limited rate of carboxylation (Wj) and that at a given light level there is a unique nL at which photosynthesis is co-limited by Wj and Wc. This co-ordination theory may explain nL decreasing with increasing depth in the canopy, but does not explain nL that changes depending on nitrogen availability as well. Optimization theory, on the other hand, predicts that nL should be distributed in proportion to light levels, and thus the distribution depends both on light and nitrogen availability in the canopy [eqn (14)].
Hikosaka and Terashima (1995) applied the optimization theory for studying light acclimation of leaf photosynthesis. They determined the pattern of N partitioning among photosynthetic components in chloroplasts that maximizes the daily carbon gain for various light environments and leaf N contents. At high irradiance, nitrogen should be allocated more to Calvin cycle enzymes and electron carriers, whilst at low irradiance, it is allocated relatively more to chlorophyll–protein complexes. Thus modelling of canopy photosynthesis with leaf nitrogen distribution enables us to scale up from chloroplast biochemistry to canopy carbon gain (Farquhar, 1989; Kull and Jarvis, 1995; Terashima and Hikosaka, 1995; De Pury and Farquhar, 1997). On the canopy photosynthesis model, Hikosaka (2003) developed a new model of leaf and nitrogen dynamics in a canopy (see Hikosaka, 2005). Canopy photosynthesis models were further applied for studying the strategy of resource use in species and individuals growing at different light and nitrogen availabilities (see below). Links between photosynthesis, nitrogen and light climate have also been implied in global-scale vegetation patterns (Reich et al., 1997; Niinemets, 2001) and used for global carbon exchange between vegetation and the atmosphere (Friend, 2001).
CANOPY STRUCTURE OF PLANT COMMUNITIES WITH MANY SPECIES
Most plant communities in the natural environment are composed of a range of species differing considerably in plant height. Tall dominant species occupy upper layers and receive a high irradiance, while short subordinate species receive a low irradiance. Here we may have two hypotheses: species in upper layers are limited by the availability of nitrogen rather than by the irradiance, and species in the lower layers are limited by the irradiance rather than the nitrogen availability. We may then expect a high nitrogen use efficiency and consequently a relatively low nL in the species in the upper layers. On the other hand, the cost–benefit hypothesis for nitrogen use predicts a high nL in the dominant species and a low nL in the subordinate species in the canopy.
Hirose and Werger (1994, 1995) studied a herbaceous plant community (Thelypterido–Phragmitetum) that contained 11 species in a small area. Phragmites australis developed leaves in the uppermost layer, Calamagrostis canescens and Carex acutiformis in the next layer, and the other eight species were living in lower layers. The upper three species, comprising 95 % of the total leaf area, dominated the stand. The other eight species together had only 5 % of the total leaf area. How can those smaller species survive if they receive only small amounts of light? Hirose and Werger calculated the photon flux (number of photons per unit time) absorbed by each species (Φ) from its leaf area distribution in the gradient of light in the canopy, determined by the stratified clipping technique (Monsi and Saeki, 1953). They defined ΦN as the ratio of photon flux absorption to leaf nitrogen (N):
 |
Leaves need both photons and nitrogen for photosynthetic carbon gain, and the cost–benefit theory predicted that nitrogen would be partitioned among species in proportion to the amount of absorbed photons (Anten et al., 1995a). If the photosynthetic rate is proportional to the amount of absorbed photons, ΦN indicates in situ photosynthetic nitrogen use efficiency (photosynthesis per unit leaf nitrogen; Field and Mooney, 1986). Dividing both the numerator and denominator of eqn (15) by leaf area in each species, we have
 |
where Φarea is the photon absorption per unit leaf area. When ΦN and nL are plotted logarithmically on the y- and x-axis, respectively, ΦN is given as parallel contours with a slope of 1 (Fig. 5). Across species there was a positive correlation between Φarea and nL (r = 0·54, P < 0·1). Nitrogen was partitioned between species such that those capturing a large amount of photons had high nitrogen per leaf area. This is consistent with the prediction of the cost–benefit hypothesis. Dominants captured a higher irradiance with leaves of higher nitrogen content per area, as compared to subordinate species. Subordinates received a lower fraction of irradiance, but their nitrogen use efficiency was not smaller than those of dominants. Note that subordinates with photosynthetic stems instead of leaves (Juncus and Equisetum) are outliers. nL is the ratio of leaf nitrogen per mass (nLM) to the specific leaf area (σ, leaf area per unit leaf mass):
 |
Fig. 5.

Photon absorption per unit leaf area (Φarea, y-axis), leaf nitrogen per unit area (nL, x-axis) and photon absorption per unit leaf nitrogen (ΦN, contours) of 11 species in the canopy of the Thelypterido-Phragmitetum. ΦN = Φarea/nL. Relative values for Φ. From Hirose and Werger (1994).
Within a species, nL changed responding to irradiance and the difference in nL was caused by nLM rather than by σ, whereas difference in nL between species was caused mainly by different σ (Hirose and Werger, 1994). Different photosynthetic capacities between species growing different layers have been documented in a deciduous forest (Kull and Niinemets, 1998).
Plants develop above-ground structures to competitively capture photons as an energy source. Tall dominant species capture a greater fraction of incident radiation, while shorter subordinate species receive a smaller fraction but nevertheless co-exist with taller species. In what characters do tall species differ from subordinate species as regards the exploitation of light resources, and are there any possible selective advantages in the characters of subordinates species? Hirose and Werger (1995) defined the absorption of photons per unit above-ground mass:
 |
where M is plant above-ground mass. If the above-ground mass is considered as a cost to capture photons, then this ratio indicates an efficiency of biomass use for capturing photons. There was some variation in Φmass among species but, surprisingly, no significant difference was found in Φmass between dominant and subordinate species as groups. Subordinate species absorbed much smaller amounts of photons, but their efficiencies were similar to or even higher than dominant species. Then the next question is how the subordinate species attained their high Φmass.
Dividing both the numerator and denominator of eqn (18) by leaf area, Φmass was separated into two components:
 |
AM is the leaf area ratio (ratio of leaf area to above-ground mass). When AM and Φarea are plotted logarithmically on the y- and x-axis, respectively, Φmass is given by contours (Fig. 6A). Across species there was a negative correlation between the two axes (r = 0·78, P < 0·01). Dominants captured high light by placing leaves at higher positions in the canopy using the investment of a large amount of biomass into supporting tissues and thus reducing AM, while subordinates receive low light but with a high AM resulting from a limited investment in support tissues. A decrease in the fraction of biomass in leaves with increasing plant height has been documented among understorey herbs (Givnish, 1982). AM was further separated into leaf mass ratio (fLM, fraction of above-ground mass in leaf mass) and σ:
 |
Fig. 6.
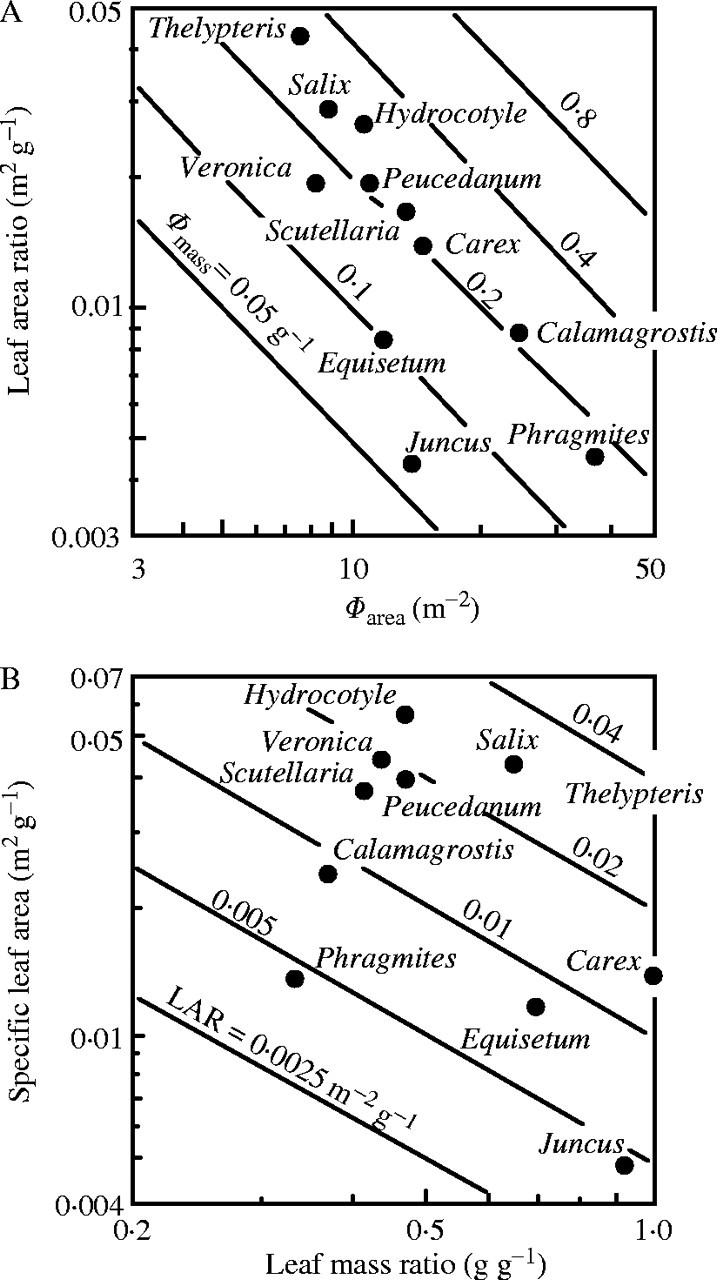
(A) Photon absorption per unit leaf area (Φarea, x-axis), leaf area ratio (AM, y-axis) and photon absorption per unit above-ground mass (Φmass, contours) of species in the canopy of the Thelypterido-Phragmitetum. Φmass = Φarea × AM. Relative values for Φ. (B) Leaf mass ratio (fLM, x-axis), specific leaf area (σ, y-axis) and leaf area ratio (AM, contours) of species. AM = fLM × σ. From Hirose and Werger (1995).
Subordinate species attained a high AM by having a high σ rather than a high fLM (Fig. 6B). In a mixed-species stand, dominant and subordinate species are different in the amount of resources they acquire, but may not be different in the efficiency of resource use, allowing them to co-exist in the stand (Hirose and Werger, 1995; Anten and Hirose, 1999). Different strategies of biomass allocation have been suggested in forest ecosystems, where upper-storey species allocate more biomass to height growth and understorey species more to lateral growth (Kohyama, 1987; King, 1990). Sakai (1991) showed that herbs develop different architectures (clonal growth forms) as a result of competition in habitats with different openness and crowding conditions.
Anten and Hirose (2003) studied canopy photosynthesis in a grassland inhabited by both C3 and C4 species. C4 species dominated at the site with their higher photosynthetic capacity. Sensitivity analysis showed that the C4 metabolism benefited the dominant species but would not benefit understorey species. Studies of canopy photosynthesis in stands with many species are limited in number. Wohlfahrt et al. (1998, 2001) modelled leaf CO2 exchange for species in mountain grassland ecosystems and incorporated the results into their vegetation–atmosphere CO2 and energy-exchange model. The model prediction of canopy net photosynthesis was verified with independent above-canopy measurements of CO2 and energy exchange.
SIZE STRUCTURE OF POPULATIONS IN THE PLANT COMMUNITY
There is a large variation in size among individuals in a stand. According to Koyama and Kira (1956), size inequality increases when the growth rate is disproportionately larger in larger individuals, but it does not change when the growth rate of individuals is proportional to their size. Competition among individuals in a stand is usually asymmetric or one-sided, where larger individuals obtain a disproportionate share of the resources and suppress the growth of smaller individuals (Weiner, 1990; Hara, 1992; Nagashima, 1999). However, there have been few studies that directly demonstrate that competition among individuals is asymmetric (but see Weiner, 1986). Anten and Hirose (1998) applied the concept of Φmass to individuals in a monospecific stand of Xanthium canadense, and showed that tall dominant individuals captured light resources more than proportionately to their size. Tall plants having higher Φmass were competitively more successful than smaller plants (see fig. 7 in Anten, 2005−this issue). Small individuals responded to low light by increasing AM, but owing to developmental constraints the plastic increase in AM was not large enough to compensate for the low Φarea. This is quite different from the pattern observed among species in multi-specific stands where Φmass was not different between dominant and subordinate species (Fig. 6A; Hirose and Werger, 1995). Therefore, it may be concluded that individuals (having different Φmass) in a monospecific stand compete for light, while different species (having similar Φmass) in a multi-specific stand tend to co-exist with each other (see also Anten and Hirose, 1999, 2001, 2003).
Fig. 7.

(A–C) Relative photosynthetic rate (R, daily net photosynthesis per unit above-ground mass), (D–F) daily photon absorption per unit above-ground mass (Φmass), and (G–I) light use efficiency (ϵ, net photosynthesis per unit photon absorption) as a function of above-ground mass of individuals in a Xantium canadense stand. Note that R = Φmass × ϵ. (A, D, G) 22 July; (B, E, H) 1 August; (C, F, I) 11 August. From Hikosaka et al. (1999).
Hikosaka et al. (1999) determined the growth of individuals in a dense stand of X. canadense by applying the canopy photosynthesis model to individual plants. Relative photosynthetic rate (R, photosynthetic rate per unit above-ground mass, a surrogate for the relative growth rate) was a saturating function of plant mass, indicating overall asymmetric competition between individuals and symmetric competition between large individuals (Fig. 7A–C). R is a product of Φmass and the light use efficiency (ε, net carbon gain per unit photon absorption):
 |
This equation implies that plant growth is determined by the efficiency of light use in photosynthesis as well as by the amount of light acquisition. Φmass was higher in larger individuals (Fig. 7D–F), while ε was highest in individuals with intermediate above-ground mass (Fig. 7G–I).
Berendse and Aerts (1987) defined nitrogen use efficiency (net carbon gain per unit nitrogen loss) as a product of the nitrogen productivity (Ingestad, 1979) and the mean residence time of nitrogen. Applying this concept to individuals in the stand of X. canadense, Hikosaka and Hirose (2001) showed that the nitrogen use efficiency was higher in dominants than in subordinates and that it was caused by a higher nitrogen productivity and a longer residence time of nitrogen in the former. They also showed that competition for nitrogen was less asymmetric between individuals than that for light. In a beech forest, Yasumura et al. (2002) found that canopy and understorey species were not different in leaf-level nitrogen use efficiency, where the high nitrogen productivity in the canopy species was offset by the low mean residence time of nitrogen.
CONCLUDING REMARKS
In this paper I have shown how Monsi and Saeki (1953) developed their theory from the work of Boysen Jensen (1932), and how the model of Monsi and Saeki was furthered with the cost–benefit hypothesis in resource use advocated by Mooney and co-workers (1979–1983). A new method was introduced to study multi-specific stands with respect to resource partitioning among species (Hirose and Werger, 1994, 1995). This method was subsequently applied to the analysis of resource acquisition and its use by individuals in the stand. One of the directions that Monsi and Saeki (1953) suggested but which has not been fully addressed is an analysis of species' replacement in plant communities. Monsi and Saeki (1953; their fig. 8) beautifully described a drama of seasonal replacement of species in the Tajimagahara plain: Sanguisorba tenuifolia started growth early in spring and dominated the stand but was soon over-shaded by Phragmites australis, which grew later but taller with a large rhizome system below ground. Phragmites nearly monopolized the stand in the summer through to the autumn, but this monopolization ended with a cover of vines. We may apply the concept of resource acquisition and use to quantitatively describe the mechanism of species replacement. Monsi and Oshima (1955) theoretically analysed the process of plant succession after gap formation in a forest. Recently Werger et al. (2002) studied the process of regeneration and species' replacement after excluding sika deer from a grazing sward. They analysed the process of taller species replacing shorter grazing-tolerant ones with respect to the species' strategy of biomass allocation for light capture.
With the rise in the atmospheric CO2 concentration, the role of terrestrial ecosystems in the global carbon cycle becomes a critical issue (Canadell et al., 2000). Canopy photosynthesis models have been extended to evaluate the potential of terrestrial carbon fixation (Cramer et al., 1999). Ecosystem carbon exchanges are being assessed extensively with the new technique of eddy covariance (FLUXNET; Aubinet et al., 2000; Baldocchi, 2003). Tests of canopy photosynthesis models with eddy covariance data have shown that the models are producing accurate estimates of canopy photosynthesis on multiple time-scales for complex forest and crop canopies (Ruimy et al., 1995; Kramer et al., 2002). Canopy photosynthesis models are useful to predict the effect of elevated CO2 on canopy structure and function (e.g. Koch and Mooney, 1996). High CO2 may benefit leaves by enabling them to photosynthesize at a low irradiance, because the light compensation point decreases due to an increase in the initial slope (Ehleringer and Björkman, 1977; Long and Drake, 1991). The Monsi–Saeki theory on the optimal LAI suggests that the LAI would increase in a high-CO2 world. Hence, Oikawa (1987) suggested a possibility that species' diversity reduces in understorey vegetation with lowered light availabilities. Nagashima et al. (2003) demonstrated that elevated CO2 benefited dominant individuals more than subordinates and consequently increased size inequality, and Hikosaka et al. (2003) analysed the mechanisms involved in the development of hierarchy. However, Hirose et al. (1996) have shown that LAI would not increase unless nitrogen availability increased simultaneously, because the increase in the initial slope makes leaves in lower layers more nitrogen-limited (Hirose et al., 1997; see also Anten et al., 1995b). The process-based mechanistic models of canopy photosynthesis initiated by Monsi and Saeki (1953) will become more useful than ever to analyse vegetation processes and to predict future ecosystems.
Acknowledgments
I thank Niels Anten, Dennis Baldocchi, Kouki Hikosaka, Ko Noguchi, Ichiro Terashima and Marinus Werger for comments.
LITERATURE CITED
- Ackerly DD. 1992. Light, leaf age and nitrogen concentration in a tropical vine. Oecologia 89: 596–600. [DOI] [PubMed] [Google Scholar]
- Anten NPR. 2005. Optimal photosynthetic characteristics of individual plants in vegetation stands and implications for species coexistence. Annals of Botany 95: 495–506. [DOI] [PMC free article] [PubMed] [Google Scholar]
- Anten NPR, Hikosaka K, Hirose T. 2000. Nitrogen utilisation and the photosynthetic system. In: Marshall B, Roberts JA, eds. Leaf development and canopy growth. Sheffield: Sheffield Academic Press, 171–203. [Google Scholar]
- Anten NPR, Hirose T. 1998. Biomass allocation and light partitioning among dominant and subordinate individuals in Xanthium canadense stands. Annals of Botany 82: 665–673. [Google Scholar]
- Anten NPR, Hirose T. 1999. Interspecific differences in aboveground growth patterns result in spatial and temporal partitioning of light among species in tall-grass meadow. Journal of Ecology 87: 583–597. [Google Scholar]
- Anten NPR, Hirose T. 2001. Limitations on photosynthesis of competing individuals in stands and the consequences for canopy structure. Oecologia 129: 186–196. [DOI] [PubMed] [Google Scholar]
- Anten NPR, Hirose T. 2003. Shoot structure, leaf physiology and carbon gain of species in a grassland. Ecology 84: 955–968. [Google Scholar]
- Anten NPR, Miyazawa K, Hikosaka K, Nagashima H, Hirose T. 1998. Leaf nitrogen distribution in relation to leaf age and photon flux density in dominant and subordinate plants in dense stands of a dicotyledonous herb. Oecologia 113: 314–324. [DOI] [PubMed] [Google Scholar]
- Anten NPR, Schieving F, Werger MJA. 1995. Patterns of light and nitrogen distribution in relation to whole canopy carbon gain in C3 and C4 mono- and dicotyledonoous species. Oecologia 101: 504–513. [DOI] [PubMed] [Google Scholar]
- Anten NPR, Schieving F, Medina E, Werger MJA, Schuffelen P. 1995. Optimal leaf area indices in C3 and C4 mono- and dicotyledonous species at low and high nitrogen availability. Physiologia Plantarum 95: 541–550. [Google Scholar]
- Anten NPR, Werger MJA. 1996. Canopy structure and nitrogen distribution in dominant and subordinate plants in a dense stand of Amaranthus dubius (L.) with a size hierarchy of individuals. Oecologia 105: 30–37. [DOI] [PubMed] [Google Scholar]
- Aubinet M, Grelle A, Ibrom A, Rannik Ü, et al. 2000. Estimates of the annual net carbon and water exchange of European forests: the EUROFLUX methodlogy. Advances in Ecological Research 30: 113–175. [Google Scholar]
- Baldocchi DD. 2003. Assessing the eddy covariance technique for evaluating carbon dioxide exchange rates of ecosystems: past, present and future. Global Change Biology 9: 479–492. [Google Scholar]
- Berendse F, Aerts R. 1987. Nitrogen-use-efficiency: a biologically meaningful definition? Functional Ecology 1: 293–296. [Google Scholar]
- Björkman O. 1981. Responses to different quantum flux densities. In: Lange OL, Nobel PS, Osmond CB, Ziegler H, eds. Physiological plant ecology I. Responses to the physical environment. Berlin: Springer-Verlag, 57–107. [Google Scholar]
- Boardman NK. 1977. Comparative photosynthesis of sun and shade plants. Annual Review of Plant Physiology 28: 355–377. [Google Scholar]
- Boysen Jensen P. 1932.Die Stoffproduktion der Pflanzen. Jena: Gustav Fischer. [Google Scholar]
- Canadell JG, Mooney HA, Baldocchi DD, Berry JA, et al. 2000. Carbon metabolism of the terrestrial biosphere: a multitechnique approach for improved understanding. Ecosystems 3: 115–130. [Google Scholar]
- Charles-Edwards DA, Stutzel H, Ferraris R, Beech DF. 1987. An analysis of spatial variation in the nitrogen content of leaves from different horizons within a canopy. Annals of Botany 60: 421–426. [Google Scholar]
- Chen JL, Reynolds JF, Harley PC, Tenhunen JD. 1993. Coordination theory of leaf nitrogen distribution in a canopy. Oecologia 93: 63–69. [DOI] [PubMed] [Google Scholar]
- Cramer W, Kicklighter DW, BondeauA, Moore B III, et al. 1999. Comparing global models of terrestrial net primary productivity (NPP): overview and key results. Global Change Biology 5 (suppl.): 1–5. [Google Scholar]
- De Pury DGG, Farquhar GD. 1997. Simple scaling of photosynthesis from leaves to canopies without the errors of big-leaf models. Plant, Cell and Environment 20: 537–557. [Google Scholar]
- de Wit CT. 1965.Photosynthesis of leaf canopies. Wageningen: Pudoc. [Google Scholar]
- Duncan WG, Loomis RS, Williams WA, Hanau R. 1967. A model for simulating photosynthesis in plant communities. Hilgardia 38: 181–205. [Google Scholar]
- Ehleringer J, Björkman O. 1977. Quantum yields for CO2 uptake in C3 and C4 plants. Plant Physiology 59: 86–90. [DOI] [PMC free article] [PubMed] [Google Scholar]
- Evans JR. 1989. Photosynthesis and nitrogen relationships in leaves of C3 plants. Oecologia 78: 9–19. [DOI] [PubMed] [Google Scholar]
- Evans JR, Seemann JR. 1989. The allocation of protein nitrogen in the photosynthetic apparatus: costs, consequences and control. In: Briggs WR, ed. Photosynthesis. New York: Alan R. Liss, 183–205. [Google Scholar]
- Farquhar GD. 1989. Models of integrated photosynthesis of cells and leaves. Philosophical Transactions of the Royal Society of London, Series B 323: 357–367. [Google Scholar]
- Field C. 1983. Allocating leaf nitrogen for the maximzation of carbon gain: leaf age as a control on the allocation program. Oecologia 56: 341–347 [DOI] [PubMed] [Google Scholar]
- Field C, Mooney HA. 1983. Leaf age and seasonal effects on light, water and nitrogen use efficiency in a California shrub. Oecologia 56: 348–355. [DOI] [PubMed] [Google Scholar]
- Field C, Mooney HA. 1986. The photosynthesis-nitrogen relationship in wild plants. In: Givnish TJ, ed. On the economy of form and function. Cambridge: Cambridge University Press, 25–55. [Google Scholar]
- Friend AD. 2001. Modelling canopy CO2 fluxes: are ‘big-leaf’ simplifications justified? Global Ecology and Biogeography 10: 604–619. [Google Scholar]
- Givnish TJ. 1982. On the adaptive significance of leaf height in forest herbs. American Naturalist 120: 353–381. [Google Scholar]
- Grindlay DJC. 1997. Towards an explanation of crop nitrogen demand based on the optimisation of leaf nitrogen per unit leaf area. Journal of Agricultural Science, Cambridge 128: 377–396. [Google Scholar]
- Gu L, Fuentes JD, Shugart HH, Staebler RM, Black TA. 1999. Responses of net ecosystem exchanges of carbon dioxide to changes in cloudness: Results from two North American deciduous forests. Journal of Geophysical Research 104: 31421–31434. [Google Scholar]
- Hara T. 1992. Effects of the mode of competition on stationary size distribution in plant populations. Annals of Botany 69: 509–513. [Google Scholar]
- Hikosaka K. 2003. A model of dynamics of leaves and nitrogen in a canopy: an integration of canopy photosynthesis, leaf life-span, and nitrogen-use efficiency. American Naturalist 162: 149–164. [DOI] [PubMed] [Google Scholar]
- Hikosaka K. 2005. Leaf canopy as a dynamic system: Ecophysiology and optimality in leaf turnover. Annals of Botany 95: (in press). [DOI] [PMC free article] [PubMed] [Google Scholar]
- Hikosaka K, Hirose T. 1997. Leaf angle as a strategy for light competition: Optimal and evolutionary stable light-extinction coefficient within a leaf canopy. Ecoscience 4: 501–507. [Google Scholar]
- Hikosaka K, Hirose T. 2001. Nitrogen uptake and use by competing individuals in a Xanthium canadense stand. Oecologia 126: 174–181. [DOI] [PubMed] [Google Scholar]
- Hikosaka K, Terashima I. 1995. A model of the acclimation of photosynthesis in the leaves of C3 plants to sun and shade with respect to nitrogen use. Plant, Cell and Environment 18: 605–618. [Google Scholar]
- Hikosaka K, Terashima I, Katoh S. 1994. Effects of leaf age, nitrogen nutrition and photon flux density on the distribution of nitrogen among leaves of a vine (Ipomoea tricolor Cav.) grown horizontally to avoid mutual shading. Oecologia 97: 451–457. [DOI] [PubMed] [Google Scholar]
- Hikosaka K, Sudoh S, Hirose T. 1999. Light acquisition and use of individuals competing in a dense stand of an annual herb, Xanthium canadense Oecologia 118: 388–396. [DOI] [PubMed] [Google Scholar]
- Hikosaka K, Yamano T, Nagashima H, Hirose T. 2003. Light-acquisition and use of individuals as influenced by elevated CO2 in even-aged monospecific stands of Chenopodium album Functional Ecology 17: 786–795. [Google Scholar]
- Hirose T. 1971. Nitrogen turnover and dry matter production in a Solidago altissima population. Japanese Journal of Ecology 21: 18–32. [Google Scholar]
- Hirose T, Ackerly DD, Traw MB, Bazzaz FA. 1996. Effects of CO2 elevation on canopy development in the stands of two co-occurring annuals. Oecologia 108: 215–223. [DOI] [PubMed] [Google Scholar]
- Hirose T, Ackerly DD, Traw MB, Ramseier D, Bazzaz FA. 1997. CO2 elevation, canopy photosynthesis, and optimal leaf area index. Ecology 78: 2339–2350. [Google Scholar]
- Hirose T, Werger MJA. 1987. Nitrogen use efficiency in instantaneous and daily photosynthesis of leaves in the canopy of a Solidago altissima stand. Physiologia Plantarum 70: 215–222. [Google Scholar]
- Hirose T, Werger MJA. 1987. Maximizing daily canopy photosynthesis with respect to the leaf nitrogen allocation pattern in the canopy. Oecologia 72: 520–526. [DOI] [PubMed] [Google Scholar]
- Hirose T, Werger MJA. 1994. Photosynthetic capacity and nitrogen partitioning among species in the canopy of a herbaceous plant community. Oecologia 100: 203–212. [DOI] [PubMed] [Google Scholar]
- Hirose T, Werger MJA. 1995. Canopy structure and photon flux partitioning among species in a herbaceous plant community. Ecology 76: 466–474. [Google Scholar]
- Hirose T, Werger MJA, Pons TL, Rheenen JWA. 1988. Canopy structure and leaf nitrogen distribution in a stand of Lysimachia vulgaris L. as influenced by stand density. Oecologia 77: 145–150. [DOI] [PubMed] [Google Scholar]
- Hirose T, Werger MJA, Rheenen JWA. 1989. Canopy development and leaf-nitrogen distribution in a stand of Carex acutiformis Ecology 70: 1610–1618. [Google Scholar]
- Hollinger DY. 1996. Optimality and nitrogen allocation in a tree canopy. Tree Physiology 16: 627–634. [DOI] [PubMed] [Google Scholar]
- Ingestad T. 1979. Nitrogen stress in birch seedlings. II. N, K, P, Ca, and Mg nutrition. Physiologia Plantarum 45: 149–157. [Google Scholar]
- Iwaki H, Takada K, Monsi M. 1969. Studies on dry matter production of Solidago altissima community. I. The plant biomass and annual net production. Botanical Magazine, Tokyo 82: 215–225. [Google Scholar]
- Johnson IR, Thornley JHM. 1984. A model of instantaneous and daily canopy photosynthesis. Journal of Theoretical Biology 107: 531–545. [Google Scholar]
- King D. 1990. Allometry of saplings and understorey trees of a Panamanian forest. Functional Ecology 4: 27–32. [Google Scholar]
- Kira T. 1975. Primary production of forests. In: Cooper JP, ed. Photosynthesis and productivity in different environments. Cambridge: Cambridge University Press, 5–40. [Google Scholar]
- Kitajima K, Mulkey SS, Mamaniego M, Wright SJ. 2002. Decline of photosynthetic capacity with leaf age and position in two tropical pioneer tree species. American Journal of Botany 89: 1925–1932. [DOI] [PubMed] [Google Scholar]
- Kitajima K, Mulkey SS, Wright SJ. 2005. Variation in crown light characteristics among tropical canopy trees. Annals of Botany 95: (in press). [DOI] [PMC free article] [PubMed] [Google Scholar]
- Kitamoto T. 1972. The spatial pattern in a natural population of goldenrod (Solidago altissima L.), with particular reference to its change during the shoot growth. Researches on Population Ecology 14: 129–136. [Google Scholar]
- Koch GW, Mooney HA. 1996.Carbon dixoxide and terrestrial ecosystems. San Diego: Academic Press. [Google Scholar]
- Kohyama T. 1987. Significance of architecture and allometry in saplings. Functional Ecology 1: 399–404. [Google Scholar]
- Koyama H, Kira T. 1956. Intraspecific competition among higher plants. VIII. Frequency distribution of individual plants weight as affected by the interaction between plants. Journal of the Institute of Polytechnic, Osaka City University 7: 73–94. [Google Scholar]
- Kramer K, Leinonen I, Bartelink H, Berbigier P, et al. 2002. Evaluation of six process-based forest growth models using eddy-covariance measurements of CO2 and H2O fluxes at six forest sites in Europe. Global Change Biology 8: 213–230. [Google Scholar]
- Kull O, Jarvis PG. 1995. The role of nitrogen in a simple scheme to scale up photosynthesis from leaf to canopy. Plant, Cell and Environment 18: 1174–1182. [Google Scholar]
- Kull O, Niinemets Ü. 1998. Distribution of leaf photosynthetic properties in tree canopies: comparison of species with different shade tolerance. Functional Ecology 12: 472–479. [Google Scholar]
- Kuroiwa S. 1971. Total photosynthesis of a foliage in relation to inclination of leaves. In: Setlik I, ed. Prediction and measurement of photosynthetic productivity. Wageningen: Pudoc, 79–89. [Google Scholar]
- Larcher W. 1995.Physiological plant ecology. Berlin: Springer. [Google Scholar]
- Long SP, Drake BG. 1991. Effect of the long-term elevation of CO2 concentration in the field on the quantum yield of photosynthesis of the C3 sedge, Scirpus olneyi Plant Physiology 96: 221–226. [DOI] [PMC free article] [PubMed] [Google Scholar]
- Loomis RS, Williams WA. 1969. Productivity and the morphology of crop stands: patterns with leaves. In: Eastin JD, Haskins FA, Sullivan CY, Van Bavel CHM, eds. Physiological aspects of crop yield. Madison, Wisconsin: American Society of Agronomy, 27–47. [Google Scholar]
- McCree KJ, Troughton JH. 1966. Non-existence of an optimum leaf area index for the production rate of white clover grown under constant conditions. Plant Physiology 41: 1615–1622. [DOI] [PMC free article] [PubMed] [Google Scholar]
- Monsi M. 1968. Mathematical models of plant communities. In: Eckhardt F, ed. Functioning of the terrestrial ecosystem at the primary production level. Paris: UNESCO, 131–149. [Google Scholar]
- Monsi M, Oshima Y. 1955. A theoretical analysis of the succession of plant community based on the production of matter. Japanese Journal of Botany 15: 60–82. [Google Scholar]
- Monsi M, Saeki T. 1953. Über den Lichtfaktor in den Pflanzengesellschaften und seine Bedeutung für die Stoffproduktion. Japanese Journal of Botany 14: 22–52. [Google Scholar]
- Monsi M, Uchijima Z, Oikawa T. 1973. Structure of foliage canopies and photosynthesis. Annual Review of Ecology and Systematics 4: 301–327. [Google Scholar]
- Monteith JL. 1965. Light distribution and photosynthesis in field crops. Annals of Botany 29: 17–37. [Google Scholar]
- Mooney HA, Field C, Gulmon SL, Bazzaz FA. 1981. Photosynthetic capacities in relation to leaf position in desert versus oldfield annuals. Oecologia 50: 109–112. [DOI] [PubMed] [Google Scholar]
- Mooney HA, Gulmon SL. 1979. Environmental and evolutionary constraints on the photosynthetic characteristics of higher plants. In: Solbrig OT, Jain S, Johnson GB, Raven PH, eds. Topics in plant population biology. New York: Columbia University Press, 316–337. [Google Scholar]
- Nagashima H. 1999. The processes of height-rank determination among individuals and neighbourhood effects in Chenopodium album L. stands. Annals of Botany 83: 501–507. [Google Scholar]
- Nagashima H, Yamano T, Hikosaka K, Hirose T. 2003. Effects of elevated CO2 on the size structure in even-aged monospecific stands of Chenopodium album Global Change Biology 9: 619–629. [Google Scholar]
- Natr L. 1975. Influence of mineral nutrition on photosynthesis and the use of assimilates. In: Cooper JP, ed. Photosynthesis and productivity in different environments. Cambridge: Cambridge University Press, 537–555. [Google Scholar]
- Niinemets U. 2001. Global-scale climatic cotrols of leaf dry mass per area, density, and thickness in trees and shrubs. Ecology 82: 453–469 [Google Scholar]
- Oikawa T. 1987. Studies on the dynamic properties of terrestrial ecosystems based on a simulation model. I. Critical light conditions for stability of a tropical rainforest ecosystem. Ecological Research 2: 289–300. [Google Scholar]
- Pons TL, Schieving F, Hirose T, Werger MJA. 1990. Optimisation of leaf nitrogen allocation for canopy photosynthesis in Lysimachia vulgaris In: Lambers H, Cambridge ML, Konings H, Pons TL, eds. Causes and consequences of variation in growth rate and productivity of higher plants. The Hague: SPB Academic Publishing, 175–186. [Google Scholar]
- Pons TL, Van Rijnbeek H, Scheurwater I, Van der Werf A. 1993. Importance of the gradient in photosynthetically active radiation in a vegetation stand for leaf nitrogen allocation in two monocotyledons. Oecologia 95: 416–424. [DOI] [PubMed] [Google Scholar]
- Reich PB, Walters MB, Ellsworth DS. 1997. From tropics to tundra: global convergence in plant functioning. Proceedings of the National Academy of Sciences of the USA 94: 13730–13734. [DOI] [PMC free article] [PubMed] [Google Scholar]
- Roderick ML, Farquhar GD, Berry SL, Noble IR. 2001. On the direct effect of clouds and atmospheric particles on the productivity and structure of vegetation. Oecologia 129: 21–30. [DOI] [PubMed] [Google Scholar]
- Ross J. 1981.The radiation regime and architecture of plant stands. The Hague: Dr W Junk Publishing. [Google Scholar]
- Ruimy A, Jarvis PG, Baldocchi DD, Saugier B. 1995. CO2 flux over plant canopies and solar radiation: a review. Advances in Ecological Research 26: 1–68. [Google Scholar]
- Saeki T. 1959. Variation of photosynthetic activity with aging of leaves and total photosynthesis in a plant community. Botanical Magazine, Tokyo 72: 404–408. [Google Scholar]
- Saeki T. 1960. Interrelationships between leaf amount, light distribution and total photosynthesis in a plant community. Botanical Magazine, Tokyo 73: 55–63. [Google Scholar]
- Saeki T. 1975. Distribution of radiant energy and CO2 in terrestrial communities. In: Cooper JP, ed. Photosynthesis and productivity in different environments. Cambridge: Cambridge University Press, 297–322. [Google Scholar]
- Sakai S. 1991. A model for the adaptive architecture of herbaceous plants. Journal of Theoretical Biology 148: 535–544. [Google Scholar]
- Schieving F, Pons TL, Werger MJA, Hirose T. 1992. Vertical distribution of nitrogen in photosynthetic activity at different plant densities in Carex acutiformis Plant and Soil 142: 9–17. [Google Scholar]
- Schieving F, Werger MJA, Hirose T. 1992. Canopy structure, nitrogen distribution and whole canopy photosynthetic carbon gain in growing and flowering stands of tall herbs. Vegetatio 102: 173–182. [Google Scholar]
- Stockhoff BA. 1994. Maximization of daily canopy photosynthesis: effects of herbivory on optimal nitrogen distribution: Journal of Theoretical Biology 169: 209–220. [Google Scholar]
- Tamiya H. 1951. Some theoretical notes on the kinetics of algal growth. Botanical Magazine, Tokyo 64: 167–173. [Google Scholar]
- Terashima I, Araya T, Miyawawa S, Sone K, Yano S. 2005. Construction and maintenance of the optimal photosynthetic systems of the leaf, herbaceous plant and tree: an eco-developmental treatise. Annals of Botany 95: (in press). [DOI] [PMC free article] [PubMed] [Google Scholar]
- Terashima I, Hikosaka K. 1995. Comparative ecophysiology of leaf and canopy photosynthesis. Plant, Cell and Environment 18: 1111–1128. [Google Scholar]
- Weiner J. 1986. How competition for light and nutrients affects size variability in Ipomoea tricolor populations. Ecology 76: 1425–1427. [Google Scholar]
- Weiner J. 1990. Asymmetric competition in plant populations. Trends in Ecology and Evolution 5: 360–364. [DOI] [PubMed] [Google Scholar]
- Werger MJA, Hirose T. 1988. Effects of light climate and nitrogen partitioning on the canopy structure of stands of a dicotyledonous, herbaceous vegetation. In: Werger MJA, van der Aart PJM, During HJ, Verhoeven JTA, eds. Plant form and vegetation structure. The Hague: SPB Academic Publishing, 171–181. [Google Scholar]
- Werger MJA, Hirose T. 1991. Leaf nitrogen distribution and whole canopy photosynthetic carbon gain in herbaceous stands. Vegetatio 97: 11–20. [Google Scholar]
- Werger MJA, Hirose T, During H, Heil GW, Hikosaka K, Ito T, Nachinshonhor UG, Nagamatsu D, Shibasaki K, Takatsuki S, et al. 2002. Light partitioning among species and species replacement in early successional grasslands. Journal of Vegetation Science 13: 615–626. [Google Scholar]
- Williams GC. 1966.Adaptation and natural selection. Princeton: Princeton University Press. 324 pp. [Google Scholar]
- Wilson KB, Baldocchi DD, Hanson PJ. 2000. Spatial and seasonal variablity of photosynthesis parameters and theiir relationship to leaf nitrogen in a deciduous forest. Tree Physiology 20: 565–587. [DOI] [PubMed] [Google Scholar]
- Wohlfahrt G, Bahn M, Horak I, Tappeiner U, Cernusca A. 1998. A nitrogen sensitive model of leaf carbon dioxide and water vapour gas exchange: application to 13 key species from differently managed mountain grassland ecosystems. Ecological Modelling 113: 179–199. [Google Scholar]
- Wohlfahrt G, Bahn M, Tappeiner U, Cernusca A. 2001. A multi-component, multi-species model of vegetation-atmosphere CO2 and energy exchange for mountain grasslands. Agricultural and Forest Meteorology 106: 261–287. [Google Scholar]
- Xu L, Boldocchi DD. 2003. Seasonal trend of photosynthetic parameters and stomatal conductance of blue oak (Quercus douglasii) under prolonged summer drought and high temperature. Tree Physiology 23: 865–877. [DOI] [PubMed] [Google Scholar]
- Yasumura Y, Hikosaka K, Matsui K, Hirose T. 2002. Leaf-level nitrogen-use efficiency of canopy and understorey species in a beech forest. Functional Ecology 16: 826–834. [Google Scholar]