

Abstract
• Background and Aims The objective of this research was to characterize the physiology and cell ultrastructure of two soybean genotypes subjected to nutrient solutions with increasing concentrations of manganese (Mn) at two contrasting iron (Fe) concentrations. Genotypes ‘PI227557’ and ‘Biloxi’ were selected based on their distinctly different capacities to accumulate Mn and Fe.
• Methods Bradyrhizobium-inoculated plants were grown in hydroponic cultures in a greenhouse. Nutrient solutions were supplied with Mn concentrations ranging from 0·3 to 90 μm, at either 5 or 150 μm Fe as FeEDTA.
• Key Results For both genotypes and at both Fe concentrations, Mn concentrations from 6·6 to 50 μm did not affect shoot, root and nodule mass, or leaf and nodule ureide concentration. Mn concentrations of 70 and 90 μm did not result in visible toxicity symptoms, but hindered growth and nodulation of ‘Biloxi’. An Mn concentration of 0·3 μm was, however, deleterious to growth and nodulation for both genotypes, and caused an accumulation of ureides in leaves and major alterations in the ultrastructure of chloroplasts, nuclei and mitochondria, regardless of the Fe concentration. In ‘PI227557’, there was also a proliferation of Golgi apparatus and endoplasmic reticulum in the cytoplasm of leaf cells, and nodules showed disrupted symbiosomes lacking poly-β-hydroxybutirate grains concomitantly with a proliferation of endoplasmic reticulum as well as arrested bacterial division. At 15 μm Fe, ferritin-like crystals were formed in the lumen of chloroplasts of ‘PI227557’ plants. For both genotypes, there was an antagonism between the Fe and Mn concentrations in leaves, the higher values of both microelements being detected in ‘PI227557’. The absence of any detectable relationship between Fe or Mn and zinc, phosphorus and copper concentrations in leaves ruled out those micronutrients as relevant for Mn and Fe nutrition in soybeans.
• Conclusions The results confirmed the greater capacity of ‘PI227557’ for Mn and Fe accumulation than ‘Biloxi’ for most nutrient treatments. Hence, ‘PI227557’ may be a very useful genetic resource both in developing soybean cultivars for growth on low nutrient soils and in physiological studies to understand differing approaches to nutrient accumulation in plants.
Key words: Glycine max, manganese, iron, zinc, copper, phosphorus, leaf ultrastructure, nodule ultrastructure, ferritin, plant growth, ureide
INTRODUCTION
Manganese (Mn) is recognized as an essential microelement for the growth of plants including soybean. Mn participates in a number of cellular activities including stabilization of structural proteins, the ultrastructure of chloroplasts, and photosynthesis (Weiland et al., 1975; Simpson and Robinson, 1984; Popelkova et al., 2003). Recent research has also indicated that Mn can be critical in maximizing N2 fixation activity of soybean, particularly under soil water-deficit conditions (Vadez et al., 2000). Soybean transports ureides as the products of N2 fixation to the plant shoot, and Mn is a cofactor required in the catabolism of the ureides in the leaves (Todd and Polacco, 2004). Therefore, low Mn can result in ureide accumulation in leaves (Vadez and Sinclair, 2001).
There are, however, only a few investigations with soybean over a range of Mn supply that give full documentation of plant response. Ohki et al. (1980) found that the soybean cultivar ‘Forrest’ responded differently from six other cultivars to varying Mn concentrations by showing apparent toxicity at comparatively low Mn concentrations. The growth of cultivar ‘Bragg’ was insensitive to a broad range of solution Mn concentrations from 3·6 to 91 μm resulting in leaf Mn concentrations of 11 µg g−1 to 100 µg g−1 or greater (Ohki, 1976). Concentrations less than this range resulted in visual deficiency symptoms and concentrations above this range resulted in toxicity symptoms. Leaf chlorophyll concentrations when Mn concentrations were less than the critical threshold were about 10 µg cm−2 and above this threshold they were in the range of 35–45 µg cm−2 (Adams et al., 2000). On the other hand, Heenan and Carter (1976) found the optimum Mn concentration of the nutrient solution for the growth of four soybean cultivars was 1·8 μm. Trials in pots with field soil, however, gave variable results with no clear response to Mn application (Heitholt et al., 2002). Differences among cultivars in the expression of visual Mn deficiency symptoms in the field were also identified by Graham et al. (1994), but the scoring of Mn deficiency did not correlate to yield.
The interpretation of plant responses to differing Mn concentrations is difficult, however, because of the close relationship between Mn and iron (Fe) at the cellular level (Moraghan, 1992; Korshunova et al., 1999). Deficient or toxic Mn concentrations in leaves are associated with toxic or deficient plant responses to Fe, respectively (Alam et al., 2001). This strong negative interaction between accumulated Mn and Fe was confirmed in fertility trials involving the application of Fe to soybean (Roomizadeh and Karimian, 1996). In legumes, not only does Fe actively participate in metabolic pathways involving Mn (Hell and Stephan, 2003) but Fe is an essential component of leghaemoglobin, which transports oxygen within the N2-fixing cells in the nodules of legumes (Abdelmajis and Chedly, 2003). Yet, little research has dealt with Fe and Mn interaction in soybean cultivars since most studies have used only one Fe concentration or one cultivar in their experimental design.
The situation is further complicated because there are indications of variability amongst soybean genotypes in response to Mn (Purcell et al., 2000) and Fe concentrations (Lin et al., 2000). Izaguirre-Mayoral and Sinclair (2005) examined the response of six soybean genotypes grown on nutrient solutions containing either 0·3 or 6·6 μm Mn, at a constant 30 μm Fe concentration. They found that one genotype group, which included genotype ‘PI227557’, had up to an order of magnitude greater Fe and Mn concentrations in the leaves in both Mn treatments than a second group of genotypes, which included ‘Biloxi’. Those genotypes that accumulated greater amounts of Mn had lower leaf ureide concentrations than those that had lesser amounts of accumulated leaf Mn.
The objectives of this investigation were: (a) to compare the growth, nodulation and ureide, chlorophyll and nutrient concentrations of genotypes ‘PI227557’ and ‘Biloxi’ subjected to a number of combinations of Mn and Fe concentrations in solution culture; and (b) to investigate the effect of Mn and Fe supply on the ultrastructure of leaf and nodule cells in both genotypes. The genotypes were selected based on their previous distinctly different response to solution Mn concentrations. Assessment of the extent of differences between these two genotypes has important consequences for future plant breeding to improve crop yields in soils characterized by a low Mn content, and for understanding of the genotypic response of soybean cultivars to Mn and Fe nutrition.
MATERIALS AND METHODS
Plant responses to a range of Mn concentrations and two Fe concentrations were tested by growing plants in hydroponic cultures in a greenhouse. The basic nutrient solution contained CaCl2 (3·3 mm), MgSO4 (2 mm), K2SO4 (1·3 mm), dibasic potassium phosphate buffer (0·4 mm; solution pH maintained at 6·0), H3BO3 (4 μm), ZnSO4 (1·6 μm), CuSO4 (1·6 μm) and NaMoO4 (0·1 μm). Manganese was supplied as MnSO4 at one of ten concentrations (0·3, 3, 6·6, 10, 20, 30, 40, 50, 70 and 90 μm) and Fe was provided at either 5 μm (low Fe) or 150 μm (high Fe) as FeEDTA.
Seeds of ‘PI227557’ and ‘Biloxi’ were inoculated with a bradyrhizobia mixture (Nitragin, Milwaukee, WI, USA) and placed in soil to germinate on 4 Oct. 2003. Five-day-old seedlings were transferred to rubber stoppers that were mounted on 1-L Erlenmeyer flasks, one seedling per flask. The flasks were wrapped in aluminium foil to prevent the roots in the flasks being exposed to light. The flasks were filled with the appropriate nutrient solution and continuously aerated with an air flow rate of approx. 2 L min−1 in each flask. Plants were grown in a greenhouse exposed to natural solar radiation with day/night temperature fixed at approx. 28/20 °C. Incandescent lamps were used to extend the day length to 16 h so as to maintain the plants in vegetative development.
During the first week only, 1 mm of urea was added to the solution of all flasks to facilitate early seedling growth. During the first 2 weeks, Fe concentration of all solutions was held at 30 μm and then changed to either low Fe or high Fe. There were six replicate plants for each combination of Mn and Fe treatments. The appropriate nutrient solution was added daily to each flask to replace transpirational losses, and every 4 d the solutions were completely replaced. Once the roots of the seedlings had lengthened, the amount of solution in the flasks was decreased to about 500 mL so that the upper root segments on which the nodules formed were above the solution.
Entire plants were individually harvested after growing in hydroponic cultures for a total of 30 d (i.e. 14 d for the initial growth and 16 d of exposure to the nutrient treatments). Chlorophyll concentration was determined in 1-cm2 discs removed from the central area of each of the three leaflets of the uppermost mature fully expanded leaf (Izaguirre-Mayoral et al., 1992). The plants were then separated into leaves (including petioles), stem, root and nodule mass and the components individually oven dried at 80 °C. After obtaining the dry weights of each tissue sample, the petioles and main vein were removed from the leaf sample. The leaf blade and nodule tissue samples were finely ground. Subsamples of the ground tissue were used to measure ureide concentration colorimetrically (Izaguirre-Mayoral et al., 1992). The concentrations of phosphorus (P), zinc (Zn), copper (Cu), Mn and Fe were determined using atomic absorption spectrophotometry after subsamples were ashed for 4 h at 500 °C and dissolved in hydrochloric and nitric acids.
Fresh leaf and nodules samples were also collected at harvest for examination with the electron microscope. An approx. 1-mm2 area adjacent to the midvein was collected from the topmost fully expanded leaf of each plant. Two nodules of approx. 4-mm diameter were collected from the main root of each plant. Only half of each nodule was retained by slicing the nodule to expose the red, central infected zone, which was the focus of subsequent electron microscopic examination. Tissues were fixed for 72 h with 2 % glutaraldehyde buffered at pH 7·3 with a 0·1 m sodium cacodylate solution; post-fixed in 1 % osmium tetroxide and dehydrated through a graded ethanol series. After a change to propylene oxide, all pieces were embedded in Medcast resin. Ultrathin sections of 0·1 µm thick were cut with a Sorvall ultramicrotome fitted with a diamond knife and stained with uranyl acetate followed by lead citrate. Ultrathin sections were observed in a CM10 Philips electron microscope. Six tissue samples of each tissue and each nutrient solution treatment were selected for observation.
RESULTS
Micronutrient analyses
For both genotypes, leaf Mn concentration increased as solution Mn concentration was increased (Fig. 1A). Higher Mn concentrations were detected in leaves from plants grown on low Fe as compared with those on high Fe at all solution Mn concentrations. In addition, leaf Mn concentrations of ‘PI227557’ were greater than values in ‘Biloxi’ for low Fe concentration when Mn concentration was greater than 0·3 μm and for high Fe concentration when Mn concentration was greater than about 10 μm.
Fig. 1.

Concentrations of (A) manganese, (B) iron and (C) phosphorus in leaves of soybean genotypes ‘Biloxi’ (open symbols) and ‘PI227557’ (closed symbols) plants growing at increasing solution Mn concentrations and either low (5 μm, inverted triangles) or high (150 μm, upright triangles) solution Fe concentrations. The standard error of the mean is shown for all data when the value is larger than the symbol.
Leaf Fe concentration response to nutrient solution treatments was more complicated that leaf Mn concentrations. At low solution Fe, there was essentially no change in leaf Fe concentration across all solution concentrations of Mn (Fig. 1B). At high solution Fe, ‘PI227557’ showed little change in leaf Fe until the Mn concentration in the nutrient solution reached 30 μm. Above 30 μm Mn and at high Fe, the concentration of leaf Fe in ‘PI227557’ decreased steadily. In contrast, the leaf Fe concentration of ‘Biloxi’ under these conditions had a maximum value at 6·6 μm Mn. Nevertheless, leaf Fe concentration was greater in ‘PI227557’ than ‘Biloxi’ with any combination of Mn and Fe treatments.
Leaf P concentrations tended to be stable across the mid-range of solution Mn concentrations (Fig. 1C). Except for ‘PI227557’ at low Fe, the other three treatments resulted in high leaf P concentrations at 0·3 μm Mn. ‘PI227557’ with low Fe had much greater leaf P concentrations than when with high Fe, and was also higher than in ‘Biloxi’ at all but the lowest Mn treatment. Leaf P increased with increasing solution Mn concentration up to 10 μm and then remained stable at higher Mn concentrations in the solution. For both genotypes, average Zn and Cu were 100 and 7 µg g−1 leaf d. wt, respectively, regardless of the Mn and Fe concentrations at which the plants were grown.
Ultrastructural analyses
In the mesophyll cells of leaves from ‘PI227557’ and ‘Biloxi’ grown at solution Mn concentrations of 6·6 μm and higher, chloroplasts showed normal configuration with an abundant and well-organized inner membrane system with usually two to four grains of starch (Figs 2A and 3A). Marked ultrastructural alterations occurred, however, in the mesophyll cells of both genotypes at 0·3 μm Mn concentration. In ‘PI227557’, there was a proliferation of Golgi apparatus and endoplasmic reticulum (Fig. 2B and C), and chloroplasts displayed drastic alterations in ultrastructure with a dismantling of thylakoids and enlargement of non-appressed (unstaked) lamellae (Fig. 2C). Chloroplasts were also found filled with osmiophilic lipid globuli, but were depleted of starch grains. Concomitantly, the plasma membrane seemed detached from the cell wall, the central vacuole was irregular in shape, and there was a proliferation of mitochondria that were swollen with a cristae system completely distorted (Fig. 2D). In turn, the outer membrane of the nuclei was disrupted, and the heterochromatin was found concentrated near the periphery while the euchromatin was located toward the centre of the nuclei (Fig. 2E).
Fig. 2.

Electron micrographs showing leaf cell structures of soybean genotype ‘PI227557’ grown in 150 μm solution Fe concentration at either (A) 6·6 μm or (B, C, D and E) 0·3 μm solution Mn concentrations. Abbreviations for all parts in alphabetical order: c, chloroplast; cr, heterochromatine; cw, cell wall; er, endoplasmic reticulum; f, ferritin-like crystals; ga, Golgi apparatus; gr, grana; m, mitochondria; mn, external membrane of nuclei; n, nuclei; og, osmiophilic globuli; s, starch grain; v, vacuole. Scale bars: A = 320 nm; B and C = 200 nm; D and E = 240 nm.
Fig. 3.

Electron micrographs showing leaf cell structures of soybean genotype ‘Biloxi’ grown in 150 μm solution Fe concentration at either (A) 6·6 μm or (B and C) 0·3 μm solution Mn concentrations. Abbreviations for all parts in alphabetical order: c, chloroplast; gr, grana; m, mitochondria; n, nuclei; nm, nuclear membrane; og, osmiophilic globuli; s, starch grain. Scale bars: A = 380 nm; B = 430 nm; C = 1·100 nm.
In ‘Biloxi’, solution Mn concentration of 0·3 μm resulted in elongation of chloroplasts with a tendency of internal membranes to be less defined, and for thylakoids to exhibit less stacking (Fig. 3B and C). Non-appressed lamellae were enlarged and the number of starch grains was decreased. As observed in ‘PI227557’, there was a proliferation of mitochondria which were swollen with a cristae system completely distorted
In both genotypes, the ultrastructure of leaf cells displayed at 0·3 or 6·6 μm Mn did not vary between plants growing at either low or high Fe (microphotograhs not shown). The only recorded ultrastructural change triggered by high solution Fe concentration was the appearance of ferritin-like crystals (Masuda et al., 2003a, and citations in that paper) in the lumen of chloroplasts of ‘PI227557’ plants subjected to solutions of 0·3 μm Mn (Fig. 2B) up to 40 μm Mn (not shown), a result not observed in ‘Biloxi’ plants growing at similar solution Fe and Mn concentrations.
The ultrastructure of the nodules of ‘PI227557’ was not influenced by solution Mn and Fe concentrations (Fig. 4A), except for the lowest (0·3 μm) solution Mn concentration (Fig. 4B). In this case, there was a proliferation of endoplasmic reticulum in the cytoplasm of symbiosome-containing cells and a disruption of the peribacteroid membrane. Symbiosomes were also characterized by decreased peribacteroidal space, an absence of poly-β-hydroxybutirate granules, and an apparent constrained cell division. Premature degradation of bacteroids was indicated by the presence of many vesicles and membrane-like structures in the cytoplasm of infected cells. ‘Biloxi’, in contrast, did not show disrupted nodule ultrastructure at any Mn treatment (not shown). Ferritin-like crystals were never observed in nodules from either ‘Biloxi’ or ‘PI227557’.
Fig. 4.

Electron micrographs showing ultrastructure of red, central infected region of nodules collected from soybean genotype ‘PI227557’ grown in 150 μm solution Fe concentration at either (A) 6·6 μm or (B) 0·3 μm solution Mn concentration. Abbreviations for all parts in alphabetical order: b, bacteroid; er, endoplasmic reticulum; pb, poly-β-hydroxybutirate granules; pm, peribacteroid membrane. Note in (B) the decreased peribacteroidal space, the absence of poly-β-hydroxybutirate granules, and the apparently constrained cell division, as well as the presence of many vesicles and membrane-like structures in cytoplasm of infected cells. Scale bars: A and B = 630 nm.
Plant growth and parameters associated with symbiotic nitrogen fixation
Nutrient-deficiency symptoms of intervenal chlorosis were only observed in leaves of both genotypes grown on 0·3 μm solution Mn. In this Mn treatment, chlorophyll concentrations were very low (8 ± 1 µg cm−2) in mature leaves of both genotypes, regardless of the solution Fe concentration. At higher solution Mn concentrations there was a marked increase in chlorophyll concentration with an average for both genotypes of 25 ± 2 and 18 ± 2 µg cm−2 for ‘Biloxi’ and ‘PI227557’, respectively. Differences in solution Fe concentration did not result in differences in chlorophyll concentration of any leaves and did not elicit Fe-deficiency or Fe-toxicity symptoms.
The growth of shoots, roots and nodules are graphically presented both as a function of solution Mn concentration (Fig. 5) and leaf Mn concentration (Fig. 6). Not surprisingly, the general pattern of response was very similar between the two presentations. The discussion of results will focus on the response to leaf Mn concentration in order to examine the possible existence of differences between genotypes in their physiological response to varying Mn concentrations within the plant and minimize the influence of possible differences in Mn uptake and accumulation.
Fig. 5.
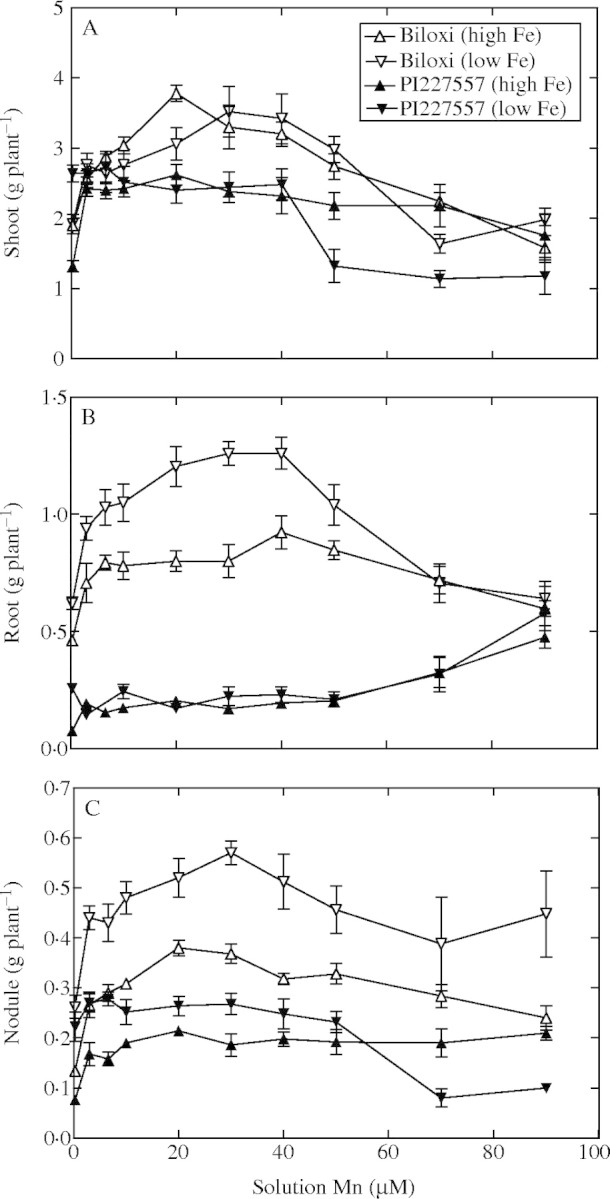
Dry mass of (A) shoots, (B) roots, and (C) nodules of soybean genotypes ‘Biloxi’ and ‘PI227557’ plotted against the solution Mn concentrations containing either low Fe (5 μm) or high Fe (150 μm) solution concentrations. The standard error of the mean is shown for all data when the value is larger than the symbol.
Fig. 6.

Dry mass of (A) shoots, (B) roots and (C) nodules of soybean genotypes ‘Biloxi’ and ‘PI227557’ plotted against leaf Mn concentration for plants subjected to nutrient solutions with differing Mn concentrations (0·3–90 μm), and either low Fe (5 μm) or high Fe (150 μm) solution concentrations. The standard error of the mean is shown for all data when the value is larger than the symbol.
Decreased shoot growth was detected in plants of both genotypes with leaf Mn concentrations equal to or lower than 7 µg g−1 d. wt, except for ‘PI227557’ with low solution Fe (Fig. 6A). Between the very lowest and highest leaf concentrations of Mn, there was virtually no change in the shoot growth of ‘PI227557’ (Fig. 6A), as well as between low and high solution Fe concentrations. On the other hand, ‘Biloxi’ tended have maximum growth over a limited range of leaf Mn concentrations. Maximum growth of ‘Biloxi’ with the high Fe solution was at a leaf Mn concentration of approx. 100 µg g−1 d. wt, while with the low Fe treatment it was in the range of 300–450 µg g−1 d. wt. Shoot growth was markedly decreased when leaf Mn exceeded 250 and 500 µg Mn g−1 d. wt at high and low solution Fe concentrations, respectively.
Differences between genotypes in accumulated root mass were quite large (Fig. 6B). The greater root mass was detected in ‘Biloxi’, especially in the range of leaf Mn of about 50–300 µg g−1 d. wt. At both extremes of leaf Mn and at both solution Fe concentrations, root mass in ‘Biloxi’ decreased. In contrast, ‘PI227557’ displayed very little variation in root mass with differing Mn concentrations, except for some increased root mass at the very highest leaf Mn concentrations. Low leaf Fe concentrations in ‘Biloxi’ were associated with increased root mass as compared with the high Fe concentrations. There was little difference in root mass in ‘PI227557’ between the low and high Fe treatments except at the very lowest and the highest leaf Mn concentrations.
Nodule mass in response to the varying solution Mn and Fe concentrations were much the same as with root growth (Fig. 6C). The nodule mass of ‘PI227557’ was insensitive to increasing leaf Mn concentrations over most of the range in leaf Mn concentration. For both genotypes, there was a greater nodule mass when the solution Fe concentration was low as compared with the high Fe concentration. Optimal leaf Mn concentration for maximum nodule mass in ‘Biloxi’ was nearly the same as for shoot and root mass in each of the Fe treatments.
The very lowest leaf Mn concentrations were associated with high leaf ureide concentrations (Fig. 7A). At leaf Mn concentrations greater than the lowest Mn values, leaf ureide concentrations were low and stable across all other situations, except ‘Biloxi’ grown on low Fe solution. Leaf ureide concentration of ‘Biloxi’ leaves from plants grown on low Fe solutions were substantially higher than the other treatments up to a leaf Mn concentration of about 500 µg g−1 d. wt. In contrast to the differences in leaf ureide, nodule ureide concentrations were less and more stable over virtually all conditions (Fig. 7B). Only with high Fe and the lowest leaf Mn concentration was there an increase in nodule ureide and this occurred in both genotypes. Therefore, these results demonstrate a high accumulation of ureide in both the leaves and nodules only when solution Fe concentration is high and leaf Mn concentration is low.
Fig. 7.

Ureide concentration of (A) leaves and (B) nodules of soybean genotypes ‘Biloxi’ and ‘PI227557’ plotted against leaf Mn concentrations for plants subjected to nutrient solutions with differing Mn concentrations (0·3–90 μm), and either low Fe (5 μm) or high Fe (150 μM) solution concentrations. The standard error of the mean is shown for all data when the value is larger than the symbol.
DISCUSSION
The previously described ability of ‘PI227557’ to accumulate greater leaf Mn and Fe concentrations on a nutrient solution of low Mn concentration than ‘Biloxi’ (Izaguirre-Mayoral and Sinclair, 2005) was confirmed over a wide range of Mn and Fe combinations in the nutrient solution. This difference between genotypes existed at both levels of solution Fe concentration tested, even though elevated solution Fe concentrations decreased Mn accumulation in both genotypes, pointing toward an apparent antagonism between Mn and Fe accumulation in both genotypes.
The general negative interaction between Mn and Fe accumulation (Moraghan, 1992; Korshunova et al., 1999) was confirmed in this experiment, but the results indicated that the interaction was more complicated than a simple antagonism between these two micro-elements. Increasing solution Mn concentration had only a small influence, if any, on Fe concentration in leaves when solution Fe was low. At high solution Fe concentration, there was decreasing Fe accumulation at high solution Mn concentration, although the threshold for the decline differed between the two genotypes. ‘PI227557’ was less sensitive than ‘Biloxi’ to the solution Mn concentration for the decline in Fe accumulation since the decrease was at greater than 30 μm Mn for ‘PI227557’ and at greater than about 10 μm Mn for ‘Biloxi’.
The interaction of Mn and Fe has been reported to be complicated because of synergistic interactions between these two elements and other cations such as Zn and Cu in strategy I plants like soybean (Heitholt et al., 2002; Romera et al., 2003) However, the absence of any detectable antagonism between Fe or Mn and Zn or Cu in this experiment ruled out those micronutrients as relevant for the Mn and Fe nutrition in soybean cultivars. Concomitantly, P concentration in leaves was also not affected by varying Mn or Fe in ‘Biloxi’, but was enhanced at low solution Fe in ‘PI227557’, pointing out another possible advantage of this cultivar when grown on soils poor in Fe availability. The higher P concentration in leaves of ‘Biloxi’ when grown on high Fe was an interesting point of contrast with the other conditions.
Results obtained in ‘Biloxi’ and ‘PI227557’ also indicated the range in leaf Mn concentrations for good growth extended up to approx. 500 µg Mn g−1, while maximum growth for the cultivar Bragg was reported to extend to a leaf Mn concentration of only 100 µg Mn g−1 (Ohki, 1976). In both genotypes in the present experiment, only the extreme solution Mn concentrations had a negative effect upon growth and nodule mass. Except for ‘PI227557’ treated with low Fe, leaf Mn concentrations equal to or lower than 7 µg g−1 d. wt hindered the shoot, root and nodule mass, regardless of the Fe concentration. The low leaf Mn concentration proved to be deficient for supporting plant growth and nodule development, and elicited the appearance of an intervenial chlorosis in all leaves of both genotypes at either low or high solution Fe. The reason that the low leaf Mn concentration with the low Fe treatment in ‘PI227557’ did not result in decreased growth yet visual deficiency symptoms were evident is not known.
Visual symptoms for leaves of low Mn concentrations were associated with pronounced modifications in the ultrastructure of chloroplasts and the low chlorophyll concentration in both genotypes brought about by this low solution Mn concentration. The negative effect of deficient Mn on the ultrastructure of cell organelles, however, differed between genotypes. In ‘PI227557’, leaf Mn concentrations equal to or lower than 7 µg g−1 d. wt induced severe ultrastructural disruptions in the chloroplast and mitochondria, as well as proliferation of Golgi apparatus and endoplasmic reticulum in the cytoplasm, both associated with an increased cell metabolic activities and tolerance to Mn stress (Ciamporova and Trginova, 1999; Wu et al., 2002). While in ‘Biloxi’, these leaf Mn concentrations caused only elongation of chloroplasts with less stacking of the thylakoids, and ultrastructural alterations in mitochondria.
The hampered growth of ‘Biloxi’ plants growing at solution Mn concentrations of 70 and 90 μm Mn was not associated with visual Mn toxicity symptoms since none of the plants displayed brown speckles, intervenial chlorosis and necrosis on mature leaves, as well as no physiological or cell ultrastructural alterations. Therefore, leaf Mn values as great as 250 or 800 µg g−1 d. wt could not be considered as visually toxic for ‘Biloxi’ or ‘PI227557’ plants, respectively. A possibility exits that these values of Mn in leaves affected the growth of ‘Biloxi’ via the impairment of other metabolic pathways not analysed in this investigation and/or of mechanisms related to Ca and Mg uptake (Marschner, 1995). In contrast, ‘PI227557’ tolerated up to at least 500 µg Mn g−1 d. wt in leaves without any hindering effect on plant growth.
Genotypic differences were further emphasized by the positive response of ‘Biloxi’ to low Fe across a wide range of Mn treatments in terms of higher shoot, root and nodule mass when compared with observations in ‘PI227557’. Furthermore, low solution Fe concentration in ‘Biloxi’ caused the deleterious effect resulting from increasing leaf Mn concentrations upon plant growth to be shifted to higher values, since shoot, root and nodule mass in ‘Biloxi’ started to decrease at about 200 and 450 µg Mn g−1 d. wt at high and low Fe concentrations, respectively. The two contrasting solution Fe concentrations, on the other hand, did not seem to have an impact on the growth of ‘PI227557’ at leaf Mn concentrations between 20 and at least 500 µg g−1 d. wt. Only nodule mass seemed to be enhanced at low Fe in this genotype at all leaf Mn concentrations over the wide range from above 7 to above 1000 µg g−1 d. wt.
For soybeans, average leaf Fe concentrations of 10 and 600 µg g−1 d. wt are considered as deficient and toxic, respectively (Marschner, 1995). In ‘Biloxi’, leaf Fe concentrations ranged between 50 µg g−1 at low Fe solution treatment and 400 µg g−1 at high Fe treatment. Whereas, in ‘PI227557’ leaf Fe concentrations greater than 700 µg g−1 d. wt were detected at high solution Fe over a wide range of leaf Mn concentrations without symptoms of Fe toxicity such as bronzing, chlorosis, ultrastructural alterations or abnormal ureide accumulation. The relatively lower Fe concentrations in leaves of ‘Biloxi’ grown at high solution Fe when compared with values in ‘PI227557’ under similar treatments could be a consequence of the accumulation of Fe in secondary roots of ‘Biloxi’ as a result of an effective Fe-chelating mechanism in endodermal cells (Izaguirre-Mayoral et al., 2002). In ‘PI227557’, the accumulation of Fe in leaves in the form of ferritin-like crystals might be the mechanism underlying the tolerance of this genotype to reported toxic Fe concentrations in the leaves (Becker et al., 1998). This is the first report on the induction of the ferritin-like crystals in ‘PI227557’, pointing towards the existence of possible genetic differences in the regulation of ferritin genes (Masuda et al., 2003b) or a functional diversity of ferritin genes among soybean genotypes (Strozycki et al., 2003).
The lack of an effect of solution Fe concentrations upon leaf and nodule ultrastructure of plants, as well as the apparent incapacity of the solution Fe concentrations to enhance or counteract the deleterious effect elicited by 0·3 μm Mn in the nutrient solution upon leaf and nodule ultrastructure, could be ascribed to the fact that seedlings were exposed to optimal Fe concentration (Izaguirre-Mayoral and Sinclair, 2005) during their early stages of growth. It might also be postulated that, at low solution Fe concentration, there was an increase in the Fe uptake rates leading to cellular Fe homeostasis, as reported for strategy I plants (Zaharieva and Romheld, 2000). However, homestatsis of leaf Fe concentration was not apparent because there were differences in leaf Fe concentrations between the low and high solution Fe treatments within each genotype.
Mn and Fe nutrition influenced variables associated with N2 fixation (i.e. nodule mass, leaf ureides) in both genotypes, although the effect and magnitude differed between genotypes. The difference in leaf ureide concentrations among treatments were to some extent similar to nodule mass; however, ‘Biloxi’ with low Fe had the greater leaf ureide concentrations across all Mn levels than ‘Biloxi’ with high Fe and ‘PI227557’ with both Fe treatments. A straightforward explanation for these differences is that the greater nodule mass resulted in greater ureide production and accumulation in the leaves. However, ureide accumulation was especially pronounced at low leaf Mn levels, which is likely to be a result of the requirement for Mn in the leaves as a cofactor for ureide catabolism in the leaves (Sinclair et al., 2003).
Interestingly, there was little variation in nodule ureide concentration across treatments except for the high concentrations of ureide at 0·3 μm Mn and high solution Fe concentrations. The high nodule ureide concentrations under these conditions occurred in ‘PI227557’ even though the ultrastructure of the nodules was altered by a proliferation of endoplasmic reticulum, disrupted peribacteroidal membranes, absence of poly-β-hydroxybutirate granules and hampered cell division. ‘Biloxi’, on the other hand, showed no disruption of the symbiosomes in nodules. Therefore, it seems likely that capacity for N2 fixation still existed in the ‘Biloxi’ nodules and that the high ureide accumulation in these nodules may be traced to an inability of ureides to be catabolized in the leaves when leaf Mn concentrations are low (Vadez and Sinclair, 2001).
Two main conclusions can be drawn from the results. First, major differences exist between soybean genotypes in their ability to accumulate Mn and Fe in their leaves. Leaves of ‘PI227557’ were able to accumulate greater concentrations of both Mn and Fe than ‘Biloxi’ for many of the nutrient treatments. In particular, ‘PI227557’ was able to accumulate much greater concentrations of Fe than ‘Biloxi’ in all nutrient treatments, indicating a possible advantage of this cultivar on soils that have low availability of either Mn or Fe. The ultrastructure studies identified ferritin-like crystals only in the leaves of ‘PI227557’, which may account for the ability of this genotype to accumulate high levels of Fe without exhibiting any visual toxicity symptoms. These observations on the accumulation of Fe and Mn in ‘PI227557’ also makes this genotype of special interest for further physiological study as an important genetic resource in developing cultivars for soil conditions with low Mn and Fe availability. Secondly, higher solution Fe concentration resulted in decreased leaf Mn concentrations in all treatments with solution Mn concentrations of 6·6 μm or greater. Consequently, these results indicated a potential for limited Mn uptake on soils high in available Fe. Again, ‘PI227557’ would be advantageous under these circumstances because of its greater accumulation of Mn at high solution Fe concentrations.
Acknowledgments
We are grateful to Mrs Mirtha Romano for help with the electron microscopy. This work was supported in part by grant #4213 from the United Soybean Board of the USA.
LITERATURE CITED
- Abdelmajid K, Chedly A. 2003. Importance of iron use-efficiency of nodules in common bean (Phaseolus vulgaris L.) for iron deficiency chlorosis resistance. Journal of Plant Nutrition and Soil Science 166: 525–528. [Google Scholar]
- Adams ML, Norvell WA, Philpot WD, Peverly JH. 2000. Spectral detection of micronutrient deficiency in ‘Bragg’ soybean. Agronomy Journal 92: 261–268. [Google Scholar]
- Alam S, Kamei S, Kawai S. 2001. Amelioration of manganese toxicity in barley with iron. Journal of Plant Nutrition 24: 1421–1433. [Google Scholar]
- Becker R, Manteuffel R, Neumann D, Scholz G. 1998. Excessive iron accumulation in the pea nutants dgl and brz: subcellular localization of iron and ferritin. Planta 207: 217–223. [Google Scholar]
- Ciamporova M, Trginova I. 1999. Modifications of plant cell ultrastructure accompanying metabolic responses to low temperature. Biologia 54: 349–360. [Google Scholar]
- Graham MJ, Nickell CD, Hoeft RG. 1994. Effect of manganese deficiency on seed yield of soybean cultivars. Journal of Plant Nutrition 17: 1333–1340. [Google Scholar]
- Heenan DP, Carter OG. 1976. Tolerance of soybean cultivars to manganese toxicity. Crop Science 16: 391–391. [Google Scholar]
- Heitholt JJ, Sloan JJ, MacKown CT. 2002. Copper, manganese, and zinc fertilization effects on growth of soybean on a calcareous soil. Journal of Plant Nutrition 25: 1727–1740. [Google Scholar]
- Hell R, Stephan UW. 2003. Iron uptake, trafficking and homeostasis in plants. Planta 216: 541–551. [DOI] [PubMed] [Google Scholar]
- Izaguirre-Mayoral ML, Sinclair TR. 2005. Variation in Mn and Fe accumulation among soybean genotypes growing on hydroponic solutions of differing Mn and nitrate concentrations. Journal of Plant Nutrition 28: 521–535. [Google Scholar]
- Izaguirre-Mayoral ML, Carballo O, Flores S, Mallorca M, Oropeza T. 1992. Quantitative analysis of the symbiotic N2 fixation, non-structural carbohydrates and chlorophyll content in sixteen native legume species collected in different savanna sites. Symbiosis 12: 293–312. [Google Scholar]
- Izaguirre-Mayoral ML, Flores S, Oropeza T. 2002. Aluminum tolerance in nodulated N2-fixing legume species native to two contrasting savanna sites. Plant and Soil 245: 163–168. [Google Scholar]
- Korshunova YO, Eide D, Clark WG, Guerinot ML, Pakrasi HB. 1999. The IRT1 protein from Arabidopsis thaliana is a metal transporter with a broad substrate range. Plant Molecular Biology 40: 37–44. [DOI] [PubMed] [Google Scholar]
- Lin SF, Grant D, Cianzio S, Shoemaker R. 2000. Molecular characterization of iron deficiency chlorosis in soybean. Journal of Plant Nutrition 23: 1929–1939. [Google Scholar]
- Marschner H. 1995.Mineral nutrition in higher plants, 2nd edn. San Diego: Academic Press. [Google Scholar]
- Masuda T, Goto F, Yoshihara T. 2003. A novel plant ferritin subunit from soybean that is related to a mechanism of iron release. Journal of Biological Chemistry 276: 19575–19579. [DOI] [PubMed] [Google Scholar]
- Masuda T, Mikami B, Goto F, Yoshihara T, Utsumi S. 2003. Crystallization and preliminary X-ray crystallographic analysis of plant ferritin from Glycine max Biochimica et Biophysica Acta 1645: 113–115. [DOI] [PubMed] [Google Scholar]
- Moraghan JT. 1992. Iron-manganese relationships in white lupin grown on a calciaquoll. Soil Science Society of America Journal 56: 471–475. [Google Scholar]
- Ohki K. 1976. Manganese deficiency and toxicity levels for ‘Bragg’ soybean. Agronomy Journal 68: 861–864. [Google Scholar]
- Ohki K, Wilson DO, Anderson OE. 1980. Manganese deficiency and toxicity sensitivities of soybean cultivars. Agronomy Journal 72: 713–716. [Google Scholar]
- Popelkova H, Wyman A, Yocum C. 2003. Amino acid sequences and solution structures of manganese stabilizing protein that affect reconstitution of photosynthesis II activity. Photosynthesis Research 77: 21–34. [DOI] [PubMed] [Google Scholar]
- Purcell LC, King CA, Ball RA. 2000. Soybean cultivar differences in ureides and the relationship to drought tolerant nitrogen fixation and manganese nutrition. Crop Science 40: 1062–1070. [Google Scholar]
- Romera FJ, Frejo VM, Alcantara E. 2003. Simultaneous Fe-Cu-deficiency synergically accelerates the induction of several Fe-deficiency stress responses in strategy I plants. Plant Physiology and Biochemistry 41: 821–827. [Google Scholar]
- Roomizadeh S, Karimian N. 1996. Manganese–iron relationship in soybean grown in calcareous soils. Journal of Plant Nutrition 19: 397–406. [Google Scholar]
- Simpson DJ, Robinson SP. 1984. Freeze-fracture ultrastructure of thylakoid membranes in chloroplasts from manganese-deficient plants. Plant Physiology 74: 735–741. [DOI] [PMC free article] [PubMed] [Google Scholar]
- Sinclair TR, Vadez V, Chenu K. 2003. Ureide accumulation in response to Mn nutrition by eight soybean genotypes with N2 fixation tolerance to soil drying. Crop Science 43: 592–597. [Google Scholar]
- Strozycki PM, Skapska A, Szczesniak K, Sobieszczuk E, Briat JF, Legocki AB. 2003. Differential expression and evolutionary analysis of the three ferritin genes in the legume plant Lupinus luteus. Physiologia Plantarum 118: 380–389. [Google Scholar]
- Todd CD, Polacco JC. 2004. Soybean cultivars ‘Williams 82’ and ‘Maple Arrow’ produce both urea and ammonia during ureide degradation. Journal of Experimental Botany 55: 867–877. [DOI] [PubMed] [Google Scholar]
- Vadez, V, Sinclair TR. 2001. Leaf ureide degradation and N2 fixation tolerance to water deficit in soybean. Journal of Experimental Botany 52: 153–159. [PubMed] [Google Scholar]
- Vadez V, Sinclair TR, Serraj R, Purcell LC. 2000. Manganese application alleviates the water deficit-induced decline of N2 fixation. Plant, Cell and Environment 23: 497–505. [Google Scholar]
- Weiland RT, Noble RD, Crang RE. 1975. Photosynthetic and chloroplast ultrastructural consequences of manganese deficiency in soybean. American Journal of Botany 62: 501–508. [Google Scholar]
- Wu ZY, Liang F, Hong BM, Young JC, Sussman MR, Harper JF, Sze H. 2002. An endoplasmicreticulum-bound Ca2+/Mn2+ pump, ECA1, supports plant growth and confers tolerance to Mn2+ stress. Plant Physiology 130: 128–137. [DOI] [PMC free article] [PubMed] [Google Scholar]
- Zaharieva T, Romheld V. 2000. Specific Fe2+ uptake system in strategy I plants induced under Fe deficiency. Journal of Plant Nutrition 23: 1733–1744. [Google Scholar]