

Abstract
• Background and Aims The Zhoushan archipelago is the largest archipelago in China. It separated from the mainland about 9000 years ago due to rising sea levels and climate change. Because of the long-term influences of human activities, the original forest vegetation on the large islands has been badly damaged and its plant diversity reduced.
• Methods Levels and patterns of genetic diversity in 114 individuals from six natural populations and four cultivated populations of the insular endangered plant Neolitsea sericea (Lauraceae) on the Zhoushan archipelago were assessed using random amplified polymorphic DNA (RAPD) markers.
• Key Results A total of 99 discernible loci were obtained for all populations using ten primers, 50·5 % of which were polymorphic [percentage of polymorphic bands (PPB) = 50·5 %]. Despite being a woody, long-lived, perennial, outcrossing and insect-pollinated plant, N. sericea exhibited low levels of genetic variation. The cultivated populations (PPB = 18·9 %, HE = 0·060, S = 0·092) were genetically less diverse than the natural populations (PPB = 23·1 %, HE = 0·082, S = 0·123). Based on analysis of molecular variance, a high degree of among-population differentiation was revealed for both natural (0·387) and cultivated populations (0·598).
• Conclusions Removal of plants from the wild for horticulture purposes has eroded the level of genetic variation of N. sericea. Low levels of genetic diversity and a high degree of population differentiation indicate that management strategies should include conservation of natural habitats occupied by all six wild populations, and sampling of germplasm resources from multiple seed sources.
Keywords: Conservation management, endangered plant, genetic structure, Neolitsea sericea, RAPD, Zhoushan archipelago
INTRODUCTION
Oceanic island ecosystems have offered great opportunities for the study of evolution owing to their discrete geographical nature and diversity of species and habitats (Adsersen, 1995; Crawford and Stuessy, 1997; Emerson, 2002). Due to their limited geographical range, habitat specificity and small population size, island species have even been considered as models for studying evolution, and have fascinated many evolutionary biologists since the era of Darwin and Wallace (Baldwin et al., 1998; Grant, 1998; Stuessy and Ono, 1998). Recently, a vast number of studies focusing on population genetic variation and structure, colonization and extinction, adaptive radiation and speciation, have become available for island plant groups (Emerson, 2002). Most of these studies aim to understand the processes that led to species richness within island ecosystems and also to provide suggestions for biodiversity conservation (Frankham, 1997; Crawford and Stuessy, 1997; Francisco-Ortega et al., 2000; Emerson, 2002).
Human activity is considered as one of the major causes of genetic erosion and extinction of species on islands through over-exploitation, habitat destruction and degradation, and exotic species introduction (Olson, 1989; Francisco-Ortega et al., 2000; Kingston and Waldren, 2003). The consequences of reduction of genetic diversity, often exacerbated in island ecosystems due to their geographical isolation, have received intense attention among conservation biologists (Frankham, 1997). The maintenance of sufficient genetic diversity, both within and among populations, is one of the main goals in conservation planning as genetic diversity provides the template for adaptation and evolution of populations and/or species (Grant, 1998; Stuessy and Ono, 1998). Many studies have been devoted to the maintenance of genetic diversity of endemic or endangered island species (Rieseberg and Swensen, 1996; Francisco-Ortega et al., 2000). However, few reports are available to compare the genetic structure of natural and cultivated populations of endangered island species (Francisco-Ortega et al., 2000).
The Zhoushan archipelago was originally an extended part of the Tiantai Mountains in Zhejiang Province and is the largest archipelago in China. These islands were separated from the mainland during the late Pleistocene due to rising sea levels and climate change (Wang and Wang, 1980). The archipelago comprises 1339 islands with a total land area of 1371 km2. Zhoushan Island is the largest with an area of 467·8 km2, and only 58 islands are larger than 1 km2. Human activity began on the Zhoushan archipelago some 5000 years ago (Wang and Wang, 1980), and currently about 20 large islands are inhabited by humans. The Putuoshan Island is the most well-known island because it is an important Buddhism centre of China, and it attracts many tourists every year.
During the long history of human activity on the Zhoushan archipelago, the original old-growth broad-leaved forests on the islands have been mostly destroyed. Currently the islands are dominated by cultivated forests of Pinus thunbergii and P. massoniana, and there are only relicts of secondary evergreen broad-leaved forests in remote ravines of Putuoshan, Taohua, Zhujiajian, Damao and Luojiashan islands (Jin et al., 1991). A total of 21 endangered plants on the Zhoushan archipelago are listed in the latest edition of the Chinese Plant Red Book (Fu, 1992).
Neolitsea sericea (Lauraceae) is distributed on a few islands of the Zhoushan archipelago. It is well known for its young leaves densely covered with silky, yellow-brown hairs which appear golden in the sunshine. The species has historically been associated with Buddhism and is locally honoured as the ‘Buddhism tree’. Because of its graceful shape and religious connotation, N. sericea is commonly used as an ornamental tree in public gardens and streets of Zhoushan City, in Zhejiang Province. The rapid degradation and destruction of N. sericea original habitats have resulted in a continuous decline of natural populations. There are currently only five individuals older than 100 years and 80 individuals that are over 30 years old and these individuals are restricted to the Putuoshan, Damao and Taohua islands in the Zhoushan archipelago. Neolitsea sericea is currently listed as an endangered plant in China (Fu, 1992).
The purpose of the present study was to investigate the genetic diversity and genetic structure of natural and cultivated populations of N. sericea on the Zhoushan archipelago, using random amplified polymorphic DNA (RAPD) markers. The main objectives of the study were to (a) assess levels of genetic diversity of natural and cultivated populations, (b) evaluate the degree of differentiation among populations and analyse the effect of island geographical isolation on population differentiation, (c) determine whether there is a difference in genetic variability between natural and cultivated populations, and (d) provide baseline information for establishing management practices to preserve this endangered species.
MATERIALS AND METHODS
Study species
Neolitsea sericea (Bl.) Koidz. is an evergreen, broad-leaved, insular, woody species. It is distributed mainly on the Zhoushan archipelago in eastern China, as well as on Honshu, Shikoku, Kyushu and Ryukyu islands in Japan, and in a few localities in the southern coastal area of the Korean Peninsula (Fu, 1992; Chung et al., 2000). Neolitsea sericea usually occurs on well-drained, rocky and humus soils on slopes. The scented flowers of N. sericea are dioecious, and are pollinated by insects in September and October (Yumoto, 1987; Chung et al., 2000), with individual female plants typically producing hundreds of fruits in late autumn of the next year. Ripe fruit is red, ellipsoid, 12–15 mm long, and is usually dispersed by birds (Chung et al., 2000).
Sample collections
After an extensive survey of N. sericea in the Zhoushan archipelago, only six natural populations were found. These populations were distributed on the Damao, Taohua and Putuoshan islands. Four cultivated populations from these islands were also selected (Fig. 1). Fresh leaves were sampled randomly throughout larger populations, but in smaller populations all accessible individual leaves were collected. The total number of samples studied was 114. Details of sampling are provided in Table 1. Leaf specimens were placed in sealed plastic bags and transferred on ice to the laboratory, where they were stored at −80°C until DNA was extracted. A single voucher specimen representative of each population was made and deposited in the herbarium of the Nanjing University, China.
Fig. 1.

Geographical distribution of N. sericea surveyed in the Zhoushan archipelago.
Table 1.
Distribution, sampling location and size of N. sericea populations in the Zhoushan archipelago
| Island |
Sampling site |
Type of population |
No. of adult trees |
Sampling size |
Estimated age (years) |
Sampling voucher |
|---|---|---|---|---|---|---|
| Damao (D) | Chengkeng (D-CK1) | Natural | 35 | 19 | 15–100 | Z.-S. Wang et al. |
| Changkeng (D-CK2) | Natural | 30 | 20 | 15–35 | Z.-S. Wang et al. | |
| Lengkeng (D-LK1) | Natural | 10 | 8 | 15–85 | Z.-S. Wang et al. | |
| Lengkeng (D-LK2) | Cultivated | 14 | 15–35 | Z.-S. Wang et al. | ||
| Taohua (T) | Dafuyan (T-DF) | Natural | 25 | 9 | 15–35 | Z.-S. Wang et al. |
| Chashanao (T-CS) | Natural | 30 | 13 | 15–35 | Z.-S. Wang et al. | |
| Putuoshan (P) | Fudingshan (P-FD) | Natural | 10 | 7 | 15–100 | Z.-S. Wang et al. |
| Fuyushi (P-FY) | Cultivated | 7 | 15–25 | Z.-S. Wang et al. | ||
| Zhujiajian (Z) | Dongfushan (Z-DS) | Cultivated | 10 | 15–40 | Z.-S. Wang et al. | |
| Jiangjunshan (Z-JS) | Cultivated | 7 | 15–35 | Z.-S. Wang et al. |
DNA extraction and PCR amplification
Genomic DNA was isolated from 1·0 to 1·5 g of fresh material according to the CTAB protocol for total DNA isolation (Doyle, 1991). Because leaf tissue of N. sericea contains many kinds of secondary compounds, a mixture of phenol–chloroform–isoamyl alcohol (25 : 24 : 1, v/v/v) was used to purify the extracted substances repeatedly. DNA samples with clear and discernible bands through electrophoresis were then selected.
PCRs were performed in a GeneAmp 9700 DNA thermal Cycler (Perkin-Elmer, California, USA), with a 25 μL reaction mixture consisting of 1× thermostable PCR buffer [Tris–HCl (20 mmol L−1 pH 8·55), (NH4)2SO4 (50 mmol L−1), EDTA (0·1 mmol L−1), Thesit (50 %)], glycerol, MgCl2 (2·5 mm), 0·2 mmol L−1 each of dATP, dCTP, dGTP and dTTP, 1 unit of Taq DNA polymerase (Promega, Madison, WI, USA), 0·5 mmol L−1 random 10-base primer and 30 ng genomic DNA. The PCR was run for 45 cycles at 94 °C for 1 min (denaturation step), 35 °C for 45 s (annealing step) and 72 °C for 90 s (elongation step) in a thermal cycler, preceded by an initial melting step of 3 min at 94 °C, and followed by a final extension step of 7 min at 72 °C.
One hundred RAPD primers (OPERON Technology, Alameda, CA, USA) were screened for amplification. The ten selected primers (OPA11, OPA12, OPB08, OPB11, OPB12, OPB17, OPC01, OPC02, OPC04 and OPC11) that exhibited high polymorphisms and reproducibility were used for PCR amplification. Negative control PCR reactions containing all the PCR components except DNA were also included.
Amplification products were separated by means of electrophoresis on 1·5 % agarose gels run in Tris-borate EDTA buffer (1×), stained with ethidium bromide (0·5 µg mL−1), and photographed under UV light. The size of the amplification products was estimated by comparisons with a standard molecular weight marker (GeneRuler100-bp ladder; MBI, Vilnius, Lith). Amplified fragments were scored according to presence (1) or absence (0) of homologous bands, and were then transformed into a binary matrix. However, to avoid biased parameter estimates in the loci studied, bands with a frequency of <3/N (where N is the sample size, 114 individuals) were removed from analyses following recommendations by Lynch and Milligan (1994).
Data analysis
The binary matrix of the RAPD phenotypes was analysed with POPGENE version 1·31 (Yeh et al., 1997) based on two assumptions: (1) each marker band represented the phenotype at a single biallelic, distinct locus (Williams et al., 1990); and (2) that populations are in Hardy–Weinberg equilibrium. The following genetic parameters were estimated: percentage of polymorphic bands (PPB); effective number of alleles per locus (Ae); observed number of alleles per locus (Ao); expected heterozygosity (HE). At the species level, genetic diversity measures (HT, total genetic diversity; GST, the coefficient of genetic differentiation) were measured using Nei's gene diversity statistics (Nei, 1973). Nei's unbiased genetic identity (I) between populations was also computed using Nei's procedures (Nei, 1972).
Shannon's index of diversity (S) was also used to examine genetic diversity partitioned within and among populations. This index was relatively insensitive to the inability of RAPD to detect heterozygous loci (Lynch and Milligan, 1994): S = −∑Pi log2 (Pi), where Pi is the frequency of a given RAPD band. S was calculated at two levels: the average diversity within populations (Spop), and the total diversity of the species (Ssp). Then the proportion of genetic diversity among populations was estimated as (Ssp − Spop)/Ssp. Differences between natural and cultivated populations in PPB, Ao, Ae, HE and S were further examined with non-parametric Mann-Whitney U tests using statistical package SPSS 10·0 (SPSS, Chicago).
Analysis of molecular variance (AMOVA; Excoffier et al., 1992) was also used to partition the total phenotypic variance among populations. AMOVA input files were created using AMOVA-PREP 1·01 (a program for the preparation of AMOVA input files from dominant-markers raw data; distributed by its author, M. P. Miller, Department of Biological Sciences, Northern Arizona University, e-mail: mpm2@nauvax.ucc.nau.edu) using the Euclidean distance matrix of Excoffier et al. (1992). All analyses were carried out using WINAMOVA version 1·55, provided by Laurent Excoffier (Genetics and Biometry Laboratory, University of Geneva, Switzerland) unless indicated otherwise. To examine the genetic relationships within and among populations, a dendrogram was also constructed by an unweighted paired group method of cluster analysis using arithmetic averages (UPGMA) of NTSYS-pc version 2·02c (Rohlf, 1997).
RESULTS
RAPD profiles
Ten of the 100 RAPD primers screened produced 99 repeatable bands ranging in size from 300 to 3000 bp and the average number of bands was 9·9 per primer. Of these scorable bands, 49 bands (49·5 %) were present in all the individuals and 50 bands (50·5 %) were polymorphic.
The average percentage of polymorphic bands (PPB) for all ten populations of N. sericea was 21·4 % (Table 2). The natural populations had higher mean PPBs than cultivated ones (23·1 % vs. 18·9 %). However, this difference was not statistically significant (Z = −1·287, P = 0·198).
Table 2.
Genetic variability within populations of N. sericea detected by RAPD analysis
| Population |
N |
Ao |
Ae |
HE |
S |
PPB (%) |
||||||
|---|---|---|---|---|---|---|---|---|---|---|---|---|
| Natural | ||||||||||||
| D-CK1 | 19 | 1·323 (0·470) | 1·212 (0·344) | 0·123 (0·189) | 0·181 (0·274) | 32·3 | ||||||
| D-CK2 | 20 | 1·263 (0·442) | 1·134 (0·272) | 0·083 (0·154) | 0·126 (0·224) | 26·3 | ||||||
| D-LK1 | 8 | 1·161 (0·370) | 1·095 (0·246) | 0·057 (0·138) | 0·085 (0·202) | 16·1 | ||||||
| T-DF | 9 | 1·212 (0·410) | 1·147 (0·311) | 0·082 (0·169) | 0·122 (0·244) | 21·2 | ||||||
| T-CS | 13 | 1·192 (0·396) | 1·120 (0·277) | 0·070 (0·154) | 0·105 (0·224) | 19·2 | ||||||
| P-FD | 7 | 1·232 (0·425) | 1·134 (0·288) | 0·079 (0·159) | 0·119 (0·231) | 23·2 | ||||||
| Average | 12·6 | 1·231 (0·016) | 1·140 (0·022) | 0·082 (0·035) | 0·123 (0·020) | 23·1 | ||||||
| Cultivated | ||||||||||||
| D-LK2 | 14 | 1·212 (0·410) | 1·113 (0·255) | 0·069 (0·147) | 0·104 (0·216) | 21·2 | ||||||
| P-FY | 7 | 1·192 (0·396) | 1·116 (0·278) | 0·067 (0·151) | 0·101 (0·219) | 19·2 | ||||||
| Z-DS | 10 | 1·182 (0·388) | 1·062 (0·157) | 0·044 (0·103) | 0·072 (0·163) | 18·2 | ||||||
| Z-JS | 7 | 1·172 (0·379) | 1·098 (0·247) | 0·059 (0·139) | 0·089 (0·205) | 17·2 | ||||||
| Average | 9·5 | 1·190 (0·031) | 1·097 (0·039) | 0·060 (0·014) | 0·092 (0·019) | 18·9 | ||||||
| Average | 11·4 | 1·214 (0·017) | 1·123 (0·015) | 0·073 (0·009) | 0·110 (0·021) | 21·4 | ||||||
| Species | 114 | 1·505 (0·502) | 1·281 (0·372) | 0·170 (0·199) | 0·257 (0·285) | 50·5 | ||||||
N, number of plants sampled; Ao, observed number of alleles per locus; Ae, the effective number of alleles per locus; HE, expected heterozygosity; S, Shannon's index; PPB, percentage of polymorphic loci.
Genetic diversity estimates
The mean expected heterozygosity (HE) and the Shannon's index of diversity (Spop) over ten populations was different from the species level estimates (HT and Ssp; Table 2). Wild populations had higher mean expected heterozygosity (HE) and higher levels of the Shannon's index of diversity (Spop) than cultivated ones (0·082 vs. 0·060 and 0·123 vs. 0·092, respectively). These differences were marginally significant statistically (Z = −1·919, P = 0·055 for both estimates).
Genetic differentiation among populations
The coefficients of genetic differentiation among populations (GST) were 0·496 and 0·609 for natural and cultivated populations respectively. Analysis of the Shannon's diversity index (S) partitioned 0·487 of total variation among natural populations, and 0·602 of total variation among cultivated populations, which was in agreement with the results of genetic differentiation analysis (GST).
AMOVA revealed that there was highly significant (P < 0·001) genetic differentiation among populations with 0·387 of the total variation occurring among natural populations, while 0·598 of total variation existed among cultivated ones (Table 3). Therefore, AMOVA also supported the results based on the analysis of genetic differentiation (GST) and Shannon's diversity index (S).
Table 3.
Analysis of molecular variance (AMOVA) within/among N. sericea populations
| Source of variation |
d.f. |
SSD |
MSD |
Variance component |
Total variance (%) |
P-value |
|---|---|---|---|---|---|---|
| Among natural populations | 5 | 221·74 | 44·35 | 3·21 | 38·66 | <0·001 |
| Within natural populations | 70 | 356·24 | 5·09 | 5·09 | 61·34 | <0·001 |
| Among cultivated populations | 3 | 133·72 | 44·57 | 5·76 | 59·82 | <0·001 |
| Within cultivated populations | 28 | 108·37 | 3·87 | 3·87 | 40·18 | <0·001 |
d.f., degrees of freedom; SSD, sum of squared deviation; MSD, mean squared deviation; P-value, probability of having a more extreme variance component than the observed values by chance alone.
Genetic similarity indices
Genetic similarity was estimated within and among populations using genetic identity (I). Individuals within a population showed considerable similarity to each other. Plants from the cultivated population Z-DS shared the highest similarity (I = 0·931). By contrast, the natural population D-CK1 had the lowest similarity value (I = 0·866). I varied from 0·866 to 0·926 with a mean of 0·902 ± 0·011 within natural populations. It varied from 0·913 to 0·931 with an average of 0·921 ± 0·025 within cultivated populations.
For interpopulation comparisons, I varied from 0·862 to 0·970 with a mean of 0·894 ± 0·015 among six natural populations. D-CK1 and D-CK2 populations were most similar to each other (I = 0·970). In addition, a close relationship was found between the T-DF and T-CS populations (I = 0·964). Among the four cultivated populations, I showed slightly lower values, and varied from 0·829 to 0·895 with a mean of 0·869 ± 0·017.
When comparing genetic identity between natural and cultivated populations, the cultivated D-LK2 population exhibited a higher degree of similarity to the natural D-LK1 population (I = 0·972) than to other populations. A close relationship also occurred between the cultivated P-FY population and the natural P-FD population (I = 0·965). The cultivated Z-DS population showed relatively high genetic similarity with the natural D-CK1 and P-FD populations (I = 0·887 and 0·886, respectively), while the Z-JS population showed a close relationship with the natural T-CS and P-FD populations (I = 0·889 and 0·880, respectively).
A UPGMA dendrogram was constructed based on Nei's genetic distance (Fig. 2). As expected, the groupings of populations were largely in accordance with their geographical localities, and populations sampled from the same island generally formed distinct groups (Fig. 2). The only exception included populations from Damao Island, which formed two distinct clusters (Fig. 2). Plants of the D-LK1 (natural) and D-LK2 (cultivated) populations from Damao Island formed one cluster (Fig. 2) while individuals of the natural D-CK1 and D-CK2 populations sampled from the neighbouring sites of Changkeng on the Damao Island formed another group. Only one of the D-CK1 individuals was grouped with the Taohua cluster.
Fig. 2.
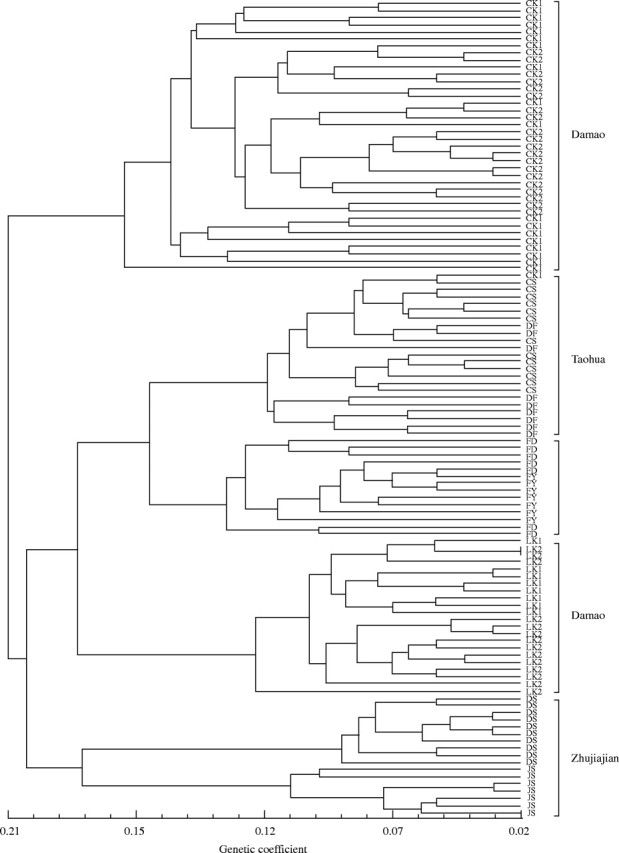
UPGMA cluster analysis of all sampled individuals of N. sericea.
DISCUSSION
Genetic variation in N. sericea
The Damao Island has been relatively unaffected by human disturbance due to inconvenient conditions for traffic and habitation and it harbours the majority of adult individuals of N. sericea. Plants sampled from the Damao Island exhibited the highest levels of genetic variation. Damao Island is much closer to the mainland, was separated at a later time, and has a lower degree of submergence than other islands. These factors may alleviate the founder effect and/or genetic bottlenecks during the early stages of the formation of the Zhoushan archipelago (Baldwin et al., 1998; Grant, 1998; Emerson, 2002). Despite having a few old trees (>100 years), Putuoshan Island, which has suffered from rapid development of tourism during the past two decades, contains no more than ten natural adult individuals. Taohua Island also has a similar level of disturbance. Size and density of natural N. sericea populations on these two islands were largely reduced, while age structures of these populations were skewed toward older individuals due to their limited regeneration. Consistent with this, natural populations (e.g. T-DF, T-CS and P-FD) from Taohua and Putuoshan Islands showed a lower level of genetic diversity than those (except for D-LKI) from Damao Island.
In general, natural populations of N. sericea are genetically more diverse than cultivated ones. Individuals of N. sericea with certain desirable characters were selected and transplanted from the wild for horticultural purposes. As a result, diversity of morphological and physiological traits of cultivated plants is limited. This is also reflected in the present genetic identity analysis in which individuals within cultivated populations showed a high level of similarity. It is possible that some genetic diversity, including alleles that correspond to unfavourable characters, have been lost during selective horticultural transplantation processes (Doebley, 1989; Ledig, 1992; Montalvo et al., 1997; Iqbal et al., 2001). Only one case in which the natural population (D-LK1) harboured lower amounts of variation than the cultivated population (D-LK2) was observed. Only eight adult individuals could be sampled from the D-LK1 population, while more individuals were found in garden settings, all of which were transplanted from the wild. Reduction in population size in natural populations may have directly reduced genetic diversity, and also subjected the remaining populations to genetic drift (Barrett and Kohn, 1991; Nunney and Elam, 1994).
Being a woody, perennial, long-lived, outcrossing and insect-pollinated plant, the average within-population genetic diversity (HE = 0·073) of N. sericea is much lower than the reported mean (HE = 0·26) in outcrossing plants using RAPD markers (Nybom and Bartish, 2000). When compared with other insular plants based on the analysis of RAPD markers (Caraway et al., 2001; Oiki et al., 2001; Loeffler and Morden, 2003), N. sericea also showed a low level of genetic variation. The isolated distribution pattern of N. sericea among several islands is relatively recent (<9000 years). Shared common ancestry and similar selective regimes before the archipelago was separated from the mainland may account for the low level of genetic diversity seen in N. sericea (Schaal et al., 1998). It is also likely that the current level of genetic diversity is only a partial reflection of the ancestral polymorphisms of N. sericea. Alternatively, a proportion of the genetic variability observed may represent new mutations that have arisen within populations following their initial isolation and dispersal (Crawford and Stuessy, 1997; Kwon and Morden, 2002; Emerson, 2002). Another possible explanation for the low genetic diversity of N. sericea is the influence of human activity. The long history of human disturbance, especially the recent rapid development of tourism and urbanization has led to low population densities and restricted distribution of N. sericea, which would result in loss and reduction of genetic diversity (Barrett and Kohn, 1991; Frankham, 1997; Fischer and Matties, 1998).
Genetic structure of natural populations
In general, population differentiation is expected to be very restricted in long-lived woody, dioecious, outcrossing and insect-pollinated species (Hamrick and Loveless, 1989; Hamrick and Godt, 1990; Nybom and Bartish, 2000). However, in the present study, 0·387 (AMOVA) of the total variability was found among natural populations of N. sericea, which was much higher than the mean (0·23) in outcrossing plants using RAPD markers (Nybom and Bartish, 2000). Several factors, including the species' shifts in distribution, habitat fragmentation, breeding system, genetic drift or genetic isolation of populations, mutation and selection, have traditionally been emphasized as the factors which determine genetic structure (Slatkin, 1987; Schaal et al., 1998). In the case of N. sericea, although the isolated distribution pattern of populations is recent, effects of isolation on population differentiation may have been reinforced by continuous reduction of population size and limited pollen and seed dispersal in fragmented habitats. When populations become smaller and isolated from one another, genetic drift may increase differentiation among populations due to stochastic fluctuations of gene frequencies (Slatkin, 1987; Barrett and Kohn, 1991; Nunney and Elam, 1994). Neolitsea sericea is reported to be pollinated by insects with a very short flight distance (Yumoto, 1987; Chung et al., 2000). Pollen movement among populations may be highly restricted to within islands given that distances between islands with N. sericea are large (>4000 m). The other important vector of gene flow, seed dispersal among islands, is also limited. Birds that disperse seeds of N. sericea eat the fruits and drop the seeds in the immediate vicinity of the mother plants, within a distance of less than 480–680 m (Chung et al., 2000). Moreover, large species of crows and other birds have become extinct on these large islands due to the intensive disturbance by humans. Indeed, seed migration among islands by birds appears to be very rare since N. sericea was not found on other islands during the extensive survey by members of the Zhoushan Forestry Institute of Zhejiang from 1990–2000 (Ding and Zhang, 2001). Ocean currents may play a role in the dispersal of N. sericea since its ripe seeds can float on seawater, but seeds could not germinate after being in salt water for a long period of time (Ding and Zhang, 2001). Representations of genetic relatedness among individuals obtained with cluster analysis (Fig. 2) also indicated a low level of gene flow among populations from the different islands since most populations from the same island clustered together. Isolation of islands is undoubtedly an important abiotic factor limiting gene exchange across the species range, and provides the initial means for populations to diverge.
Genetic structure of cultivated populations
According to the present survey, plants of cultivated populations of N. sericea were composed of individuals from a relatively small, nearby area on the same island except for individuals on Zhujiajian Island, which may have been transplanted from Putuoshan, Damao and Taohua Islands. Genetic identity (I) and the cluster analyses also showed a close genetic similarity between cultivated and natural populations from the same island. However, among-population differentiation was much greater for cultivated populations than for natural populations and the mean genetic identity among cultivated populations was less similar than that found among natural populations.
Many studies have compared population genetic diversity and genetic structure of cultivars and wild relatives, especially for important crops (Doebley, 1989). Intensive selection for agronomic and/or ornamental traits, e.g. graceful shape, insect and pathogen resistance, and stress tolerance, may have led to a narrow gene pool of cultivars, and most genotypic heterogeneity is reduced during the domestication process (Harlan, 1975; Doebley, 1989; Desplanque et al., 1999). Cultivars domesticated for similar purposes were always characterized either by a lack of significant among-population differentiation due to genetic homogeneity, or by strong divergence because of the selective elimination of genotypes by humans (Doebley, 1989; Ledig, 1992; Montalvo et al., 1997). In terms of N. sericea, cultivated populations were a subset of natural populations of the same island. The natural populations, as a genetic source, did not present abundant genetic diversity, but diverged apparently from each other as discussed above. Thus, it is not surprising to see that cultivars exhibited a lower within-population genetic diversity and a higher interpopulational differentiation than wild populations.
Cultivars on Damao Island were generally selected for their tender leaves covered with silver yellow or grey hairs, but on Putuoshan and Zhujiajian Islands the favourite ecotype was selected for its golden hairs for its religious significance (Ding and Zhang, 2001). Such different selective pressures exerted by human may have also contributed to the high level of differentiation among cultivated populations of N. sericea, in addition to drift.
Conservation implications
In conclusion, this study indicated that N. sericea sampled from the Zhoushan archipelago did not harbour a high genetic variability at the species or population level, and that cultivated populations were genetically less diverse compared with wild populations. Transplanting from wild populations for horticultural purposes has eroded the level of genetic variation of this species. Conservation management should focus on reversing the declining trend of adults, juveniles and seed banks of this species in the wild.
The best in situ conservation strategy for N. sericea of the Zhoushan archipelago is to preserve natural habitats. Approximately 0·9 million people inhabit the archipelago, with a yearly influx of ∼5 million visitors. Additionally, there has been increased tourism, road building and urban activities. The genetically most diverse populations (namely from Damao Island) should be protected with large areas free from those disturbances. This measure would conserve a substantial amount of the species' genetic variation. Nevertheless, a large proportion of the genetic diversity resides among populations. Therefore, as many populations as possible should be conserved to prevent further substantial loss of genetic diversity.
With the knowledge of genetic structure, an appropriate strategy for sampling may be formulated when ex situ conservation is required. For the purpose of capturing most of the genetic variability, germplasm resources should be established with seeds from multiple sources (Knapp and Dryer, 1997; Montalvo et al., 1997). It might be possible to preserve the majority of local genotypes by collecting seeds from representative ecotypes. However, it is possible that some rare alleles could still potentially be lost with this practice, and this may ultimately affect the long-term survival of this species.
Acknowledgments
The authors thank Prof. Javier Francisco-Ortega and Mr James Watling for their comments on an early draft of the paper, and Prof. R. Frankham for his valuable advice and encouragement. Drs Ying-Xiong Qiu and Xiao-Dong Li are acknowledged for their assistance in analysis. Thanks are also due to Prof. Fang-Ming Ding and Prof. Ci-Ying Yu for their help in the field. This work was supported by projects of the Natural Science Foundation of China (Nos 30070134 and 30300022).
LITERATURE CITED
- Adsersen H. 1995. Research on islands: classic, recent and prospective approaches. In: Vitousek PM, Loope LL, Adsersen H, eds. Islands: biological diversity and ecosystem function. Berlin: Springer-Verlag, 7–21. [Google Scholar]
- Baldwin BG, Crawford DJ, Francisco-Ortega J, Kim SC, Sang T, Stuessy TF. 1998. Molecular phylogenetic insights on the origin and evolution of oceanic island plants. In: Soltis PS, Soltis DE, Doyle JJ, eds. Molecular systematics of plants. Vol. II. DNA sequencing. New York: Kluwer Academic Publishers, 410–441. [Google Scholar]
- Barrett SCH, Kohn JR. 1991. Genetics and evolutionary consequences of small population size in plants: implications for conservation. In: Falk DA, Holsinger KE, eds. Genetics and conservation of rare plants. Oxford: Oxford University Press, 3–30. [Google Scholar]
- Caraway C, Carr GD, Morden CW. 2001. Assessment of hybridization and introgression in lava-colonizing Hawaiian Dubautia (Asteraceae: Madiinae) using RAPD markers. American Journal of Botany 88: 1688–1694. [PubMed] [Google Scholar]
- Chung MG, Chung MY, Soo Oh G, Epperson BK. 2000. Spatial genetic structure in a Neolitsea sericea population (Lauraceae). Heredity 85: 490–497. [DOI] [PubMed] [Google Scholar]
- Crawford DJ, Stuessy TF. 1997. Plant speciation on oceanic islands. In: Iwatsuki K, Raven PH, eds. Evolution and diversification in land plants. Tokyo: Springer-Verlag, 249–267. [Google Scholar]
- Desplanque B, Boudry P, Broomberg K, Saumitou-Laprade P, Cuguen J, Van Dijk H. 1999. Genetic diversity and gene flow between wild, cultivated and weedy forms of Beta vulgaris (Chenopodiaceae), assessed by RFLP and microsatellite markers. Theoretical and Applied Genetics 98: 1194–1201. [Google Scholar]
- Ding FM, Zhang CB. 2001. Investigation report on Neolitsea sericea resources in Zhoushan. Journal of Zhejiang Forestry Science and Technology 21: 52–54 [in Chinese with English abstract]. [Google Scholar]
- Doebley J. 1989. Isozymic evidence and the evolution of crop plants. In: Soltis DE, Soltis PS, eds. Isozymes in plant biology. Portland: Dioscorides Press, 46–72. [Google Scholar]
- Doyle JJ. 1991. DNA protocols for plants – CTAB total DNA isolation. In: Hewitt GM, Johnston A, eds. Molecular techniques in taxonomy. Berlin: Springer-Verlag, 283–293. [Google Scholar]
- Emerson BC. 2002. Evolution on oceanic islands: molecular phylogenetic approaches to understanding pattern and process. Molecular Ecology 11: 951–966. [DOI] [PubMed] [Google Scholar]
- Excoffier L, Smouse PE, Quattro JM. 1992. Analysis of molecular variance inferred from metric distances among DNA haplotypes: applications to human mitochondrial DNA restriction data. Genetics 131: 479–491. [DOI] [PMC free article] [PubMed] [Google Scholar]
- Fischer M, Matties D. 1998. RAPD variation in relation to population size and plant fitness in the rare Gentianella germanica (Gentianaceae). American Journal of Botany 85: 811–819. [PubMed] [Google Scholar]
- Francisco-Ortega J, Santos-Guerra A, Kim SC, Crawford J. 2000. Plant genetic diversity in the Canary Islands: a conservation perspective. American Journal of Botany 87: 909–919. [PubMed] [Google Scholar]
- Frankham R. 1997. Do island populations have less genetic variation than mainland populations? Heredity 78: 311–327. [DOI] [PubMed] [Google Scholar]
- Fu LG. 1992.Chinese plant red book. Beijing: Science Press. [Google Scholar]
- Grant PR. 1998.Evolution on islands. Oxford: Oxford University Press. [Google Scholar]
- Hamrick JL, Godt MJW. 1990. Allozyme diversity in plant species. In: Brown AHD, Clegg MT, Kahler AL, Weir BS, eds. Plant population genetics, breeding, and germplasm resources. Sunderland: Sinauer, 43–63. [Google Scholar]
- Hamrick JL, Loveless MD. 1989. The genetic structure of tropical tree populations: associations with reproductive biology. In: Bock JH, Linhart YB, eds. The evolutionary ecology of plants. Boulder: Westview Press, 129–146. [Google Scholar]
- Harlan JR. 1975. Our vanishing genetic resources. Science 188: 618–621. [DOI] [PubMed] [Google Scholar]
- Iqbal MJ, Reddy OUK, El-Zak KM, Pepper AE. 2001. A genetic bottleneck in the ‘evolution under domestication’ of upland cotton Gossypium hirsutum L. examined using fingerprinting. Theoretical and Applied Genetics 103: 547–554. [Google Scholar]
- Jin PY, Chen QH, Zhang XH, Li GY, Zhang RH. 1991. Research on the regional botanical system in Zhoushan Islands. Journal of Zhejiang Forest and Technology 11: 1–30 [in Chinese with English abstract]. [Google Scholar]
- Kingston N, Waldren S. 2003. The plant communities and environmental gradients of Pitcairn Island: the significance of invasive species and the need for conservation management. Annals of Botany 92: 31–40. [DOI] [PMC free article] [PubMed] [Google Scholar]
- Knapp EE, Dryer AR. 1997. When do genetic considerations require special approaches to ecological restoration? In: Giedler P, Kareiva P, eds. Conservation biology for the coming decade. New York: Chapman & Hall, 345–363. [Google Scholar]
- Kwon JA, Morden CW. 2002. Population genetic structure of two rare tree species (Colubrina oppositifolia and Alphitonia ponderosa, Rhamnaceae) from Hawaiian dry and mesic forests using random amplified polymorphic DNA markers. Molecular Ecology 11: 991–1001. [DOI] [PubMed] [Google Scholar]
- Ledig FT. 1992. Human impacts on genetic diversity in forest ecosystems. Oikos 63: 87–108 [Google Scholar]
- Loeffler WF, Morden CW. 2003. Genetic diversity and biogeography of the Hawaiian cordage plant, olonā (Touchardia latifolia Urticaceae), based on RAPD markers. Biochemical Systematics and Ecology 31: 1323–1335. [Google Scholar]
- Lynch M, Milligan BG. 1994. Analysis of population genetic structure with RAPD markers. Molecular Ecology 3: 91–99. [DOI] [PubMed] [Google Scholar]
- Montalvo AM, Williams SL, Rice KJ, Buchamann CC, Handel SN, Nabhan GP, Primack R, Robichaux RH. 1997. Restoration biology: a population biology perspective. Restoration Ecology 5: 277–290. [Google Scholar]
- Nei M. 1972. Genetic distance between populations. American Naturalist 106: 283–292. [Google Scholar]
- Nei M. 1973. Analysis of gene diversity in subdivided populations. Proceeding of the National Academy of Science of the USA 70: 3321–3323. [DOI] [PMC free article] [PubMed] [Google Scholar]
- Nunney L, Elam DR. 1994. Estimating the effective population size of conserved populations. Conservation Biology 8: 175–184. [Google Scholar]
- Nybom H, Bartish IV. 2000. Effects of life history traits and sampling strategies on genetic diversity estimates obtained with RAPD markers in plants. Perspectives in Plant Ecology, Evolution and Systematics 3: 93–114. [Google Scholar]
- Oiki S, Kawahara T, Ioue K, Ohara M, Maki M. 2001. Random amplified polymorphic DNA (RAPD) variation among populations of the insular endemic plant Campanula microdonta (Campanulaceae). Annals of Botany 87: 661–667. [Google Scholar]
- Olson SL. 1989. Extinction on islands. In: Western D, Pearl M, eds. Conservation for the twenty-first century. Oxford: Oxford University Press, 50–53. [Google Scholar]
- Rieseberg LM, Swensen SM. 1996. Conservation genetics of endangered island plants. In: Avise JC, Hamrick JL, eds. Conservation genetics: cases histories from nature. New York: Chapman & Hall, 305–334. [Google Scholar]
- Rohlf FJ. 1997.NTSYS-pc: numerical taxonomy and multivariate analysis system, version 2·02. Exeter Ltd, Setauket, NY, USA. [Google Scholar]
- Schaal BA, Hayworth DA, Olsen KM, Rauscher JT, Smith WA. 1998. Phylogeographic studies in plants: problems and prospects. Molecular Ecology 7: 465–474. [Google Scholar]
- Slatkin M. 1987. Gene flow and the geographic structure of populations. Science 236: 787–792. [DOI] [PubMed] [Google Scholar]
- Stuessy TF, Ono M. 1998.Evolution and speciation of island plants. Cambridge: Cambridge University Press. [Google Scholar]
- Wang JT, Wang PX. 1980. The relationship between sea level rising and climate change on east of China. Chinese Journal of Geographical Science 35: 299–313 [in Chinese with English abstract]. [Google Scholar]
- Williams JGK, Kubelik AR, Livak KJ, Rafalski JA, Tingey SV, 1990. DNA polymorphisms amplified by arbitrary primers are useful as genetic markers. Nucleic Acids Research 18: 6531–6535. [DOI] [PMC free article] [PubMed] [Google Scholar]
- Yumoto T. 1987. Pollination systems of a warm temperature evergreen broad-leaved forest in Yakushima Islands. Ecological Research 2: 133–145. [Google Scholar]
- Yeh FC, Yang RC, Boyle T, Ye ZH, Mao JX. 1997.POPGENE, the user friendly shareware for population genetic analysis. Molecular Biology and Biotechnology Center, University of Alberta, Edmonton, Canada. [Google Scholar]