

Abstract
• Background and Aims High night temperatures are more harmful to grain weight in rice than high day temperatures. Grain growth rate and growth duration were investigated to determine which was the cause of the decrease in final grain weight under high night temperatures. Endosperm cell number and cell sizes were also examined to determine which might cause the decrease in final grain weight.
• Methods Rice plants were grown outdoors in plastic pots and moved at heading time to three temperature-controlled glasshouses under high night temperature (HNT; 22/34 °C), high day temperature (HDT; 34/22 °C) and control conditions (CONT; 22/22 °C). Grains were sampled periodically, and the time-course of grain growth was divided into rate and duration by logistic regression analysis. Endosperm cell numbers and cell sizes were analysed by digitalized hand-tracing images of endosperm cross-sections.
• Key Results The duration of grain growth was reduced by high temperature both day and night. However, the rate of grain growth was lower in HNT than in HDT. The number of cells in endosperm cross-sections in HNT was similar to that in HDT, and higher than that in CONT. The average cell area was smaller in HNT than in either CONT or HDT. The differences in average cell areas between HNT and HDT were greater at distances 60–80 % from the central point of endosperm towards the endosperm surface.
• Conclusions The results show that HNT compared with HDT reduced the final grain weight by a reduction in grain growth rate in the early or middle stages of grain filling, and also reduced cell size midway between the central point and the surface of endosperm.
Keywords: Cell size, cell number, digitalized image analysis, endosperm, grain growth duration, grain growth rate, grain weight, high night temperature, logistic regression, Oryza sativa L., rice, vascular bundle
INTRODUCTION
The average grain weight diminishes under high temperature during the grain ripening period in many cereals (Nagato and Ebata, 1960; Hunter et al., 1977; Chowdhury and Wardlaw, 1978; Tashiro and Wardlaw, 1991; Savin et al., 1996). High night temperatures (22/34 °C, day/night) are more harmful to grain weight in rice than high day temperatures (34/22 °C) and control conditions (22/22 °C) at optimum temperature (Morita et al., 2002). The main factor causing the decrease in average grain weight under high night temperatures was not thought to be the deficit of carbohydrates in the leaves and culms due to increased respiration loss, since exposing the vegetative parts to high night temperatures failed to induce a reduction in average grain weight (Morita et al., 2004). Thus the physiological basis of this phenomenon, i.e. that night temperatures have a greater effect on grain development than day temperatures, has remained unknown.
Final grain weight is determined as the product of the rate and the duration of grain growth. High temperatures increase the grain growth rate in the early ripening period, but reduce the duration of grain growth and ultimately result in a decrease in final grain weight. It has been considered that the increase in the rate of grain growth does not compensate for the reduction in the grain growth duration under high temperatures (Chowdhury and Wardlaw, 1978; Tashiro and Wardlaw, 1989; Wilhelm et al., 1999). However, no comparison has been made of the rate and duration of grain growth between high night and high day temperatures.
The rate of grain growth and the final grain weight have been reported to be closely associated with the endosperm cell numbers in experiments using different cultivars and grain removal (Brocklehurst, 1977), water deficit (Brocklehurst et al., 1978; Nicolas et al., 1984), shading (Wardlaw, 1970; Brocklehurst et al., 1978) and high temperature (Nicolas et al., 1984; Jones et al., 1985; Commuri and Jones, 1999). These observations support the idea (Bingham, 1969) that the capacity of endosperm to accumulate dry matter is determined by endosperm cell numbers. However, Hoshikawa (1962) reported that endosperm cell sizes in wheat were reduced by a higher temperature (30 °C compared to 20 °C) throughout grain growth. Wardlaw (1970) also reported that the final endosperm cell numbers of wheat remained unchanged by high temperatures (27/22 °C compared to 15/10 °C) during the first 5 d following anthesis.
In this study, a logistic model was used to investigate whether the main cause of the decrease in final grain weight under high night temperatures was a decrease in the grain growth rate or a decrease in the grain growth duration. A second objective was to determine whether the endosperm cell numbers and/or cell sizes decrease in rice under high night temperatures. Singh and Jenner (1982) developed a method to determine endosperm cell numbers by counting the suspension nuclei using cellulase and alpha-amylase, which macerate the cell wall and starch granules, respectively. However, their method did not allow for an analysis of the cell size as it relates to cell sites in the endosperm. To enable such an analysis, we developed a method of counting cells and determining cell areas using digitalized hand-tracing of images of endosperm cross-sections.
MATERIALS AND METHODS
Experiment 1
Plant material and growth conditions. Experiments were performed at Fukuyama (34°30′N, 133°23′E), Japan. Two-week-old rice seedlings (Oryza sativa L. ‘Kinuhikari’) were transplanted into plastic pots (diameter 16 cm, length 20 cm) containing black volcanic ash soil on 21 June ,1996. Ten plants per pot were prepared, and tillers were removed periodically to restrict each plant to its main culm. Plants were given a basal dressing of 5 g per pot (commercial fertilizer, N : P : K = 14 : 14 : 14) at sowing, and a top-dressing of 1·2 g per pot (commercial fertilizer, N : P : K = 17 : 0 : 17) on 25 July (16 d before heading). Pots were placed in a concrete-covered water bath outdoors until the flowering stage. The water level was continuously maintained at about 3–5 cm above the soil.
Treatments and sampling. Plants with 13 emerging leaves and with a heading date of 10 August were selected for sampling. Eight grains per panicle (4th and 5th grains from the top on the 4th to 7th rachis-branch in each panicle with a flowering date of 11 August) were sampled periodically, at 6, 10, 14, 18, 22, 26, 31 and 42 d after flowering (DAF). Between six and fourteen panicles (nine on average) per treatment were used for replicates at each sampling time. Plants were subjected to temperature variations from 13 August to 22 September (maturing stage). The temperature variations were conducted in three temperature-controlled glasshouses (natural irradiance) under a high night temperature (22/34 °C: day/night, HNT), a high day temperature (34/22 °C, HDT) and control conditions (22/22 °C, CONT) as an optimum temperature. Days and nights ranged between 0800 h–1800 h and 2000 h–0600 h, respectively. Temperature changes in the day were provided linearly at a rate of 6 °C h−1. Plants were supplied with tapwater three times a day (morning, early afternoon and evening) to ensure that water stress did not occur. Photosynthetically active radiation from 1000 h to 1400 h in the glasshouses was 825 µmol m−2 s−1 on average (1575 µmol m−2 s−1 on a clear day) during the 30 d after treatments began, and the relative humidity was 80 ± 15 %.
Measurements and statistical analysis. Samples were dehulled with forceps, dried at 130 °C for 20 h in a ventilated oven, and weighed in 0·1 mg units.
The data for grain dry weight were fitted to a logistic regression curve as
 |
where A is the estimated maximum grain weight, G the average grain weight, κ the relative grain growth rate, t the day after flowering, and λ a constant. These parameter values and the contribution of the regression equation were estimated by minimizing the residual sum of squares (least-squares method), using the curve-fit procedure of Delta Graph Pro 4·0·4 (Delta Point Inc., USA). The t at which G was 0·95A was considered as the indicator of the duration of grain growth (days after flowering to maturity).
The time-courses of the grain growth rate were estimated by differentiating eqn (1):
 |
where R is the grain growth rate, and A, κ, λ and t are the same as in eqn (1).
These methods were similar to those described by Darroch and Baker (1990).
Experiment 2
To investigate the effect of high temperature on endosperm cell numbers and cell areas in grain cross-sections, rice plants were grown and temperature treatments were applied in 1997. Plant material and growth conditions were the same as those in experiment 1, except that the transplanting date was 11 July.
Treatments and sampling. Plants with 13 emerging leaves and a heading date of 27 August were selected for sampling. They were given the same temperature treatments as in experiment 1 from 31 August to 8 October (maturing stage). Four grains per panicle (4th and 5th grains from the top on the 5th and 6th rachis-branch in each panicle) were sampled periodically, at 15, 18, 21, 24, 27, 30 and 40 DAF, for grain dimension measurements of 3–5 panicles at each sampling time. Photosynthetically active radiation from 1000 h to 1400 h in the glasshouses was 713 µmol m−2 s−1 on average (1430 µmol m−2 s−1 on a clear day) during the 30 d after treatments began, and the relative humidity was 80 ± 15 %.
Endosperm cell numbers and cell areas in grain cross-sections. Samples were dehulled with forceps and 3-dimensional measurements (length, width, thickness) were taken of grains, which were then fixed and stored in FAA (formalin/acetic acid/70 % ethanol, 5 : 5 : 90) for more than 1 month. The samples taken at 24 DAF in HNT and HDT, and 30 DAF in CONT were used for endosperm cell analysis. After rinsing with water, cross-sections about 20 µm thick were sliced from the central region of the grain with a Microslicer (DTK-1000, D. S. K., Japan) and stained with toluidine blue. The cross-sections were photographed through a microscope at 40× magnification with a 35-mm camera. The images of endosperm without an aleurone layer were prepared by tracing cell contours on a transparent sheet from the microphotograph, and were digitized by a scanner and transformed into a binary image. After the central point (Hoshikawa, 1967a) of radial cell arrangement was determined by observation, an image analysis was performed to measure each cell area with rθ polar barycentric co-ordinates (r indicates the distance [%] from the central point in the endosperm cross section, and θ denotes the angles of direction toward the vascular bundle; Fig. 1). θ angles were within 0–180° (i.e. numbers and areas of the cells of 90° were the averages of those of 270° and 90°), since the back and front of a cross-section showed no distinction from one another. The cell wall was included in each cell area, so that the sum of all cell areas was equal to the area of the endosperm cross-section. The distance from the central point to the endosperm surface of 0° and the 90° and 180° directions were measured as radii of the dorsal, lateral and ventral sides, respectively. These features were calculated using a program designed by one of the authors (J. Yonemaru).
Fig. 1.

Polar co-ordinates of each cell in an endosperm cross-section. The arrow indicates the barycentre of a cell (shaded grey). r denotes the distance from the central point of the endosperm to the barycentre of the cell. θ is the angle between the line from the vascular bundle on the dorsal side (D) to the central point and from that central point to the barycentre of the cell.
RESULTS
Time course of grain dry weight increases
The grain dry weight at maturity (42 DAF) of HNT was 21·2 mg per grain, which was significantly (9–10 %) lower than that of both HDT and CONT (Fig. 2A). The time-course of grain growth, with a contribution rate above 99·4 %, was fitted to a logistic curve as described in eqn (1). The duration of grain growth calculated by t at 95 % of the estimated maximum grain weight of HNT was 22·2 d, which was similar to that of HDT (21·5 d), and shorter than that of CONT (27·0 d) (Fig. 2B). The maximum rate of grain growth under HNT was 1·57 mg grain−1 d−1, which was lower than that of HDT (1·73 mg grain−1 d−1), but higher than that of CONT (1·40 mg grain−1 d−1) (Fig. 2B). The DAF needed to bring the grain growth rate to its maximum in HNT was 12 DAF, which was similar to that in HDT, but earlier than that in CONT (15 DAF) (Fig. 2B). There was a slight difference between HNT and HDT in their grain growth rate from the early ripening stage (6–10 DAF), with that difference reaching its maximum at 11 DAF (Fig. 2B).
Fig. 2.
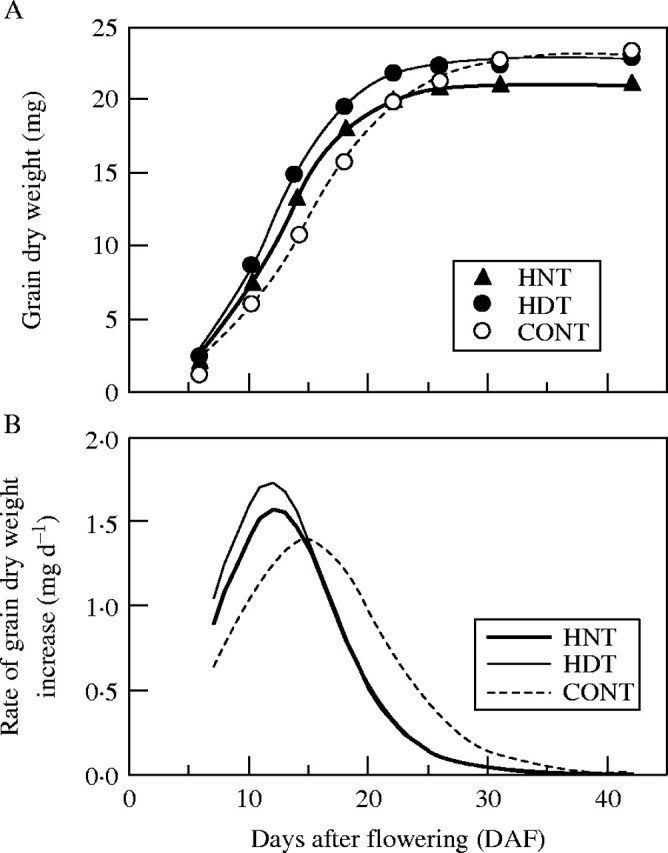
(A) Time-course of grain dry weight and (B) the rate of grain dry weight increase under three temperature treatments: high night (HNT, 22/34 °C), high day (HDT, 34/22 °C) and control (CONT, 22/22 °C). Values are means ± s.e., n = 6–14 in (A). In (A) the regression lines are: HNT, G = 21·08/[1 + exp(3·65 − 0·30 × DAF)], R2 = 0·997; HDT, G = 22·79/[1 + exp(3·61 − 0·30 × DAF)], R2 = 0·996; and CONT, G = 23·17/[1 + exp(3·57 − 0·24 × DAF)], R2 = 0·994. In (B) each line was plotted by differentiating the regression lines in (A).
Grain dimensions
Grain length, width and thickness peaked at 24 DAF in both HNT and HDT, and at 30 DAF in CONT. Table 1 shows the three dimensions of the grain. Grain lengths did not differ between the three treatments, and grain widths were smaller in HNT than in CONT. Although the dorsal radius was smaller in HNT (1·51 mg) than in control (1·80 mg), the ventral radius did not differ between the three treatments. Grain thicknesses were smaller in HNT than in HDT.
Table 1.
Effects of day and night temperatures on grain dimensions
| Treatment |
Day/night temperature (°C) |
Grain length (mm) |
Grain width (mm) |
Grain thickness (mm) |
|---|---|---|---|---|
| HNT | 22/34 | 5·54 ± 0·02a | 3·00 ± 0·03b | 2·07 ± 0·01b |
| HDT | 34/22 | 5·48 ± 0·04a | 3·05 ± 0·03b | 2·21 ± 0·02a |
| CONT | 22/22 | 5·47 ± 0·03a | 3·12 ± 0·02a | 2·12 ± 0·01b |
Values are means ± s.e. Grains were sampled at 24 DAF (n = 12) in high night (HNT) and high day (HDT) temperatures, and 30 DAF (n = 16) in controls (CONT). Values within a column followed by the same letter are not significantly different at P < 0·05 (Tukey–Kramer's multiple range test).
Endosperm cell numbers and cell sizes on grain cross-sections
The areas of endosperm cross-sections in HNT were significantly smaller than those in both the control and HDT (Table 2). The number of cells in endosperm cross-sections in HNT was similar to that in HDT, and both were significantly higher than that in the control. In contrast, the average cell area was smaller in HNT than in both the control and HDT. The average cell area in the control was largest among the three temperature treatments (Table 2). The largest average cell areas appeared at distances 50–60 % from the central point of endosperm towards the endosperm surface in all treatments (Fig. 3B). Furthermore, the cell areas were smaller near the centre point and surface of the endosperm. The differences in average cell areas between HNT and HDT were greater at distances of 30–80 %, and were significant (P < 0·05) at distances of 60–80 %. In the control, the average cell areas were significantly greater than both HDT and HNT at most distances. As shown in Fig. 4B, the change of difference in cell areas due to the angle of direction towards the vascular bundle from the central point was not as great as that due to the distance from the central point. However, the cell areas were larger in the direction near the vascular bundle (0–30°) compared with other directions in the control. In contrast, in HNT and HDT, the cell areas were smaller in that direction (0°). Thus, the differences in cell areas between the control and both HDT and HNT were greater in that direction. The differences in cell areas between HNT and HDT were static for all directions but slightly greater near the vascular bundle, and significantly so at 0–60° and 180° (P < 0·05).
Table 2.
Effects of day and night temperatures on areas of cross-sections, numbers of endosperm cells and average cell areas
| Treatment |
Day/night temperature (°C) |
Area of endosperm cross-sections (mm2 per grain) |
Number of cells in endosperm cross-sections |
Avearge cell area (×10 µm2 per cell) |
|---|---|---|---|---|
| HNT | 22/34 | 4·84 ± 0·09b | 915 ± 20a | 530 ± 13c |
| HDT | 34/22 | 5·42 ± 0·09a | 888 ± 26a | 614 ± 19b |
| CONT | 22/22 | 5·32 ± 0·13a | 748 ± 30b | 717 ± 38a |
Values are means ± s.e., n = 10 in high night temperatures (HNT, 22/34 °C) and high day temperatures (HDT, 34/22 °C), and n = 5 in controls (CONT, 22/22 °C). Values within a column followed by the same letter are not significantly different at P < 0·05 (Tukey–Kramer's multiple range test).
Fig. 3.
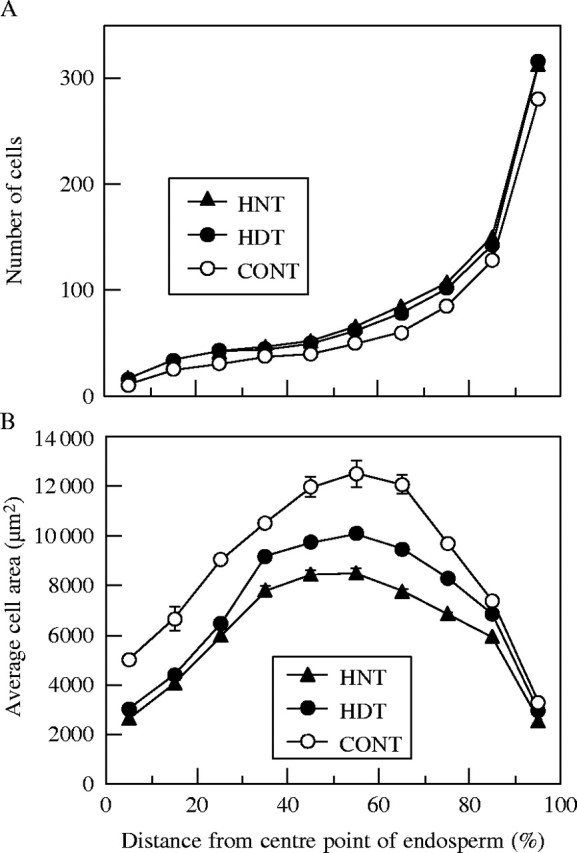
(A) Number of cells and (B) average cell area of endosperm cross-sections under three temperature treatments, high night (HNT, 22/34 °C), high day (HDT, 34/22 °C) and control (CONT, 22/22 °C), as they relate to the distance (in %) from the central point of the endosperm. For example, the data for 15 % (horizontal axis) indicate number (A) and average area (B) of cells between 10 % and 20 %. Error bars represent s.e., where errors exceed the size of the data symbols.
Fig. 4.
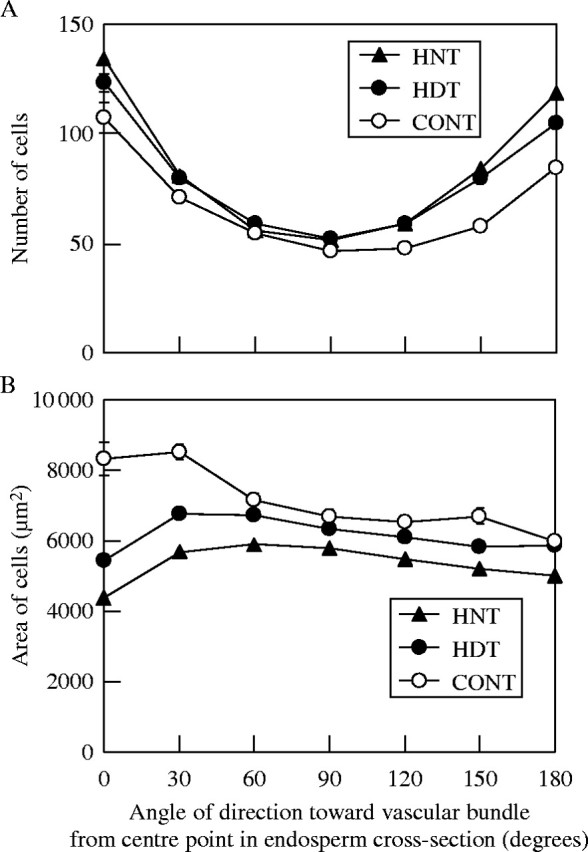
(A) Number of cells and (B) average cell area of endosperm cross-sections under three temperatures treatments, high night (HNT, 22/34 °C), high day (HDT, 34/22 °C), and control (CONT, 22/22 °C), in relation to the angle of direction toward a vascular bundle from a central point in the endosperm. Error bar represents s.e., where errors exceed the size of the data symbols.
Cell numbers were lowest around the central point of the endosperm, and increased with an increase in the distance from the central point in all treatments (Fig. 3A). In particular, the region near the surface of endosperm had many extra cells. Irrespective of the distance from the central point, controls had fewer cells than both HNT and HDT. There were no significant differences at any distance between HNT and HDT. Regarding the direction toward the central point, cell numbers were lowest at 90° from the vascular bundle (i.e. the direction of the lateral radius), and higher close to the vascular bundle or 180° away from it (i.e. the direction of the ventral radius) in all treatments (Fig. 4A). Moreover, the highest cell numbers appeared in the direction towards the vascular bundle. Cell numbers at the direction 120–180° from the vascular bundle were lower in controls than in HNT and/or HDT. There were no significant differences at any angle between HNT and HDT.
DISCUSSION
Smaller rates and similar durations of grain filling under high night temperatures vs. high day temperatures
The experimental conditions for HNT (22/34 °C), in which the night temperature was 12 °C higher than the day temperature, is unnatural. However, it is meaningful as a model experiment condition to compare the effect of high night temperature with high daytime temperature (34/22 °C) since those treatments yield the same average temperature (28 °C).
The grain dry weight under high night temperature decreased, with a reduction in the rate but not in the duration of grain growth (Fig. 2) compared with those under high day temperatures. In both HNT and HDT, the duration of grain growth was shorter than in the control. Previous work has revealed that an increase in grain growth rate is induced by high temperature, but this fails to compensate for the reduction in the duration of grain growth, so that grain dry weight ultimately decreases (Chowdhury and Wardlaw, 1978; Tashiro and Wardlaw, 1989; Wilhelm et al., 1999). The results in this study suggest that the duration of grain growth decreases with an increase in the daily average temperature regardless of the period (day or night) of high temperature.
The determination of the grain growth duration has been considered to be related to senescence of source and/or sink organs i.e. reduced leaf area duration (Spiertz et al., 1971), photosynthetic decline (Chowdhury and Wardlaw, 1978) and the duration of enzyme activity in the endosperm (Chevalier and Lingle, 1983). It is necessary, therefore, to ascertain whether such events related to senescence can be accelerated in rice under high temperature regardless of its timing.
Smaller average cell areas and similar cell numbers of the endosperm under high night temperatures vs. high day temperatures
The production of lower grain dry weights under high night temperatures than under high day temperatures was based not on a difference in grain length, but on differences in grain width and thickness (Table 1), and also endosperm cross-sectional area (Table 2). The area of the endosperm cross-sections is the product of endosperm cell numbers and average cell areas. The number of wheat endosperm cells was recognized as determining the potential grain size (Brocklehurst, 1977). In maize (Jones et al., 1985; Commuri and Jones, 1999; Engelen-Eigles et al., 2000) and wheat (Nicolas et al., 1984), grain dry weight loss was highly correlated with the number of endosperm cells being reduced by high temperature and/or drought. In contrast, Hoshikawa (1962) reported that cell numbers of wheat endosperm were similar when high temperatures persisted throughout the period of endosperm cell development. Hoshikawa (1962) also reported that endosperm cell sizes in wheat were reduced under high temperatures. However, no equivalent data have been reported for rice in previous studies.
In this study, the number of endosperm cells in rice increased by around 20 % during both high night and high day temperatures compared with controls (Table 2). The reduction in the average cell area under high day temperature offset the increase in cell numbers. However, the reduced cell area under high night temperatures exceeded the gain in cell numbers. This result revealed that neither the lower rate of grain growth nor the lower final grain weight in rice under high night temperatures was caused by reduced cell division.
The region within the endosperm influencing cell area reduction under high night temperatures
Endosperm cells between the 2nd and 11th cell layers from their central point to their surface enlarged rapidly between 5 DAF and 12 (ventral side) to 15 DAF (dorsal side and lateral side; Hoshikawa, 1967a, b, c). In this study, no progress of cell enlargement was observed. However, the above observations suggest some relationship between the region of inferior cell enlargement in the endosperm under high night temperatures compared with that under high day temperatures (Figs 3B and 4B) and the DAF by which the difference in grain growth rate between the two temperatures was recognized (Fig. 2). Thus, the high night (rather than high day) temperatures should affect the grain growth rate in the early or middle stages of grain filling through a reduction in cell enlargement in the region at which the cells enlarge at those stages.
Furthermore, cell sizes on the dorsal side (0–60° around the vascular bundle) were affected by both high night and high day temperatures in experiment 2 (Fig. 4B). These regions are considered to enlarge at the end of grain filling, since the endosperm is generally formed in the order of longitudinal, ventral, dorsal and lateral radius. Moreover, Hoshikawa (1968) concluded that the transport pathway of photoassimilates into the endosperm is finally limited to a direction from the vascular bundle as grain-filling progress. Thus, the regions (i.e. those around the vascular bundle) in which the cell size was reduced under both high day and high night temperatures were responsible for the reduction in the grain growth rate at the later stages of grain filling, as well as for the shortness of grain growth duration compared with the control.
The reduction of the enzyme activity involved in starch metabolism in the endosperm has been considered a factor in the decrease in both the grain growth rate and final grain weight in some cereals under high temperatures (Hawker and Jenner, 1993; Jenner et al., 1993; Keeling et al., 1993; Wilhelm et al., 1999). However, no studies to date have examined whether the reduction of enzyme activity in endosperm is greater at high night- than at high day-temperatures. Further research into enzyme activity under high night temperature will be required.
In addition, lower assimilate supply may have caused the lower rate of grain growth and final grain weight under high night temperatures. We do not consider a 22 °C temperature to be more harmful for photosynthesis than a 34 °C temperature (Vong and Murata, 1977). We do not know, however, whether a 22 °C day temperature after a 34 °C night temperature is harmful or not. Further investigation of this will be required.
Kobata and Uemuki (2004) have recently suggested that the potential rate of increase of grain dry matter in rice is not reduced under high temperature, and that any grain yield reduction under such conditions is likely to be due to a failure of the assimilate supply to meet the requirements of the accelerated rate of increase of grain dry matter. It is speculated that high night temperatures produce a condition in which the potential rate of increase of grain dry matter is accelerated and the assimilate supply to the grain is insufficient, since photosynthesis is dormant during the night. Therefore, such a situation may induce a reduction in endosperm cell enlargement and final grain weight under high night temperatures.
CONCLUSIONS
The results presented in experiment 1 indicate that, although the duration of grain growth in rice is reduced by high temperatures both day and night, the rate of grain growth is lower under high night than under high day temperatures; however, both high temperature conditions induce a higher growth rate than in controls. Consequently, only high night temperatures reduce the final grain weight, which becomes similar to that in controls under high day temperatures. In experiment 2, the image analyses of cell sizes and numbers in the cross-sections of endosperm suggest that high night, compared with high day, temperatures affect the grain growth rate in the early or middle stages of grain filling, and also affect the cell enlargement midway between the central point and the surface of the endosperm, where the cells ordinarily enlarge at those stages. It was also suggested that the reductions in cell sizes on the dorsal side around the vascular bundle under both high night and high day temperatures were closely related to the reduction in the grain growth rate in the later stages of grain filling, as well as for the short duration of grain growth compared with the control. Such an image analysis of endosperm cells should be useful in determining the grain filling process under any environmental stress or genetic variation.
Supplementary Material
Acknowledgments
We wish to thank Ms Maki Katsumata for her help in the endosperm cell analysis, and Dr Yukio Yaji for encouraging this study at the National Agricultural Research Center for Tohoku Region, Japan.
LITERATURE CITED
- Bingham J. 1969. The physiological determinants of grain yield in cereals. Agricultural Progress 44: 30–42. [Google Scholar]
- Brocklehurst PA. 1977. Factors controlling grain weight in wheat. Nature 266: 348–349. [Google Scholar]
- Brocklehurst PA, Moss JP, Williams W. 1978. Effects of irradiance and water supply on grain development in wheat. Annals of Applied Biology 90: 265–276. [Google Scholar]
- Chevalier P, Lingle SE. 1983. Sugar metabolism in developing kernels of wheat and barley. Crop Science 23: 272–277. [Google Scholar]
- Chowdhury SI, Wardlaw IF. 1978. The effect of temperature on kernel development in cereals. Australian Journal of Agricultural Research 29: 205–223. [Google Scholar]
- Commuri PD, Jones RJ. 1999. Ultrastructural characterization of maize (Zea mays L.) kernels exposed to high temperature during endosperm cell division. Plant, Cell and Environment 22: 375–385. [Google Scholar]
- Darroch BA, Baker RJ. 1990. Grain filling in three spring wheat genotypes: statistical analysis. Crop Science 30: 525–529. [Google Scholar]
- Engelen-Eigles G, Jones RJ, Phillips RL. 2000. DNA endoreduplication in maize endosperm cells: the effect of exposure to short-term high temperature. Plant, Cell and Environment 23: 657–663. [Google Scholar]
- Hawker JS, Jenner CF. 1993. High temperature affects the activity of enzymes in the committed pathway of starch synthesis in developing wheat endosperm. Australian Journal of Plant Physiology 20: 197–209. [Google Scholar]
- Hoshikawa K. 1962. Studies on the ripening of wheat grain. 4. Influence of temperature upon the development of the endosperm. Proceedings of the Crop Science Society of Japan 30: 228–231 [in Japanese with English summary]. [Google Scholar]
- Hoshikawa K. 1967a. Studies on the development of endosperm in rice. 1. Process of endosperm tissue formation. Proceedings of the Crop Science Society of Japan 36: 151–161 [in Japanese with English summary]. [Google Scholar]
- Hoshikawa K. 1967b. Studies on the development of endosperm in rice. 2. Process of endosperm tissue formation with special reference to the enlargement of cells. Proceedings of the Crop Science Society of Japan 36: 203–209 [in Japanese with English summary]. [Google Scholar]
- Hoshikawa K. 1967c. Studies on the development of endosperm in rice. 3. Observations on the cell division. Proceedings of the Crop Science Society of Japan 36: 210–215 [in Japanese with English summary]. [Google Scholar]
- Hoshikawa K. 1968. Studies on the development of endosperm in rice. 11. Development of starch granules in endosperm tissue. Proceedings of the Crop Science Society of Japan 37: 207–216 [in Japanese with English summary]. [Google Scholar]
- Hunter RB, Tollenaar M, Breuer CM. 1977. Effect of photoperiod and temperature on vegetative and reproductive growth of a (Zea mays) hybrid. Canadian Journal of Plant Science 57: 1127–1133. [Google Scholar]
- Jenner CF, Siwek K, Hawker JS. 1993. The synthesis of [14C] sucrose in isolated wheat grains is dependent upon the activity of soluble starch synthase. Australian Journal of Plant Physiology 20: 329–335. [Google Scholar]
- Jones RJ, Roessler J, Ouattar S. 1985. Thermal environment during endosperm cell division in maize: effects on number of endosperm cells and starch granules. Crop Science 25: 830–834. [Google Scholar]
- Keeling PL, Bacon PJ, Holt DC. 1993. Elevated temperature reduces starch deposition in wheat endosperm by reducing the activity of soluble starch synthase. Planta 191: 342–348. [Google Scholar]
- Kobata T, Uemuki N. 2004. High temperatures during the grain-filling period do not reduce the potential grain dry matter increase of rice. Agronomy Journal 96: 406–414. [Google Scholar]
- Morita S, Shiratsuchi H, Takanashi J, Fujita K. 2002. Effect of high temperature on ripening in rice plants—Comparison of the effects of high night temperatures and high day temperatures. Japanese Journal of Crop Science 71: 102–109 [in Japanese with English summary]. [Google Scholar]
- Morita S, Shiratsuchi H, Takanashi J, Fujita K. 2004. Effect of high temperature on ripening in rice plant—Analysis of the effects of high night and high day temperatures applied to the panicle and other parts of the plant. Japanese Journal of Crop Science 73: 77–83 [in Japanese with English summary]. [Google Scholar]
- Nagato K, Ebata M. 1960. Effects of temperature in the ripening periods upon the development and qualities of lowland rice kernels. Proceedings of the Crop Science Society of Japan 28: 275–278 [in Japanese with English summary]. [Google Scholar]
- Nicolas ME, Gleadow RM, Dalling MJ. 1984. Effects of drought and high temperature on grain growth in wheat. Australian Journal of Plant Physiology 11: 553–566. [Google Scholar]
- Savin R, Stone PJ, Nicolas ME. 1996. Responses of grain growth and malting quality of barley to short periods of high temperature in field studies using portable chambers. Australian Journal of Agricultural Research 47: 465–477. [Google Scholar]
- Singh BK, Jenner CF. 1982. A modified method for the determination of cell number in wheat endosperm. Plant Science Letters 26: 273–278. [Google Scholar]
- Spiertz JHJ, ten Hag BA, Kupers LTP. 1971. Relation between green area duration and grain yield in some varieties of spring wheat. Netherland Journal of Agricultural Science 19: 211–222. [Google Scholar]
- Tashiro T, Wardlaw IF. 1989. A comparison of the effect of high temperature on grain development in wheat and rice. Annals of Botany 64: 59–65. [Google Scholar]
- Tashiro T, Wardlaw IF. 1991. The effect of high temperature on the accumulation of dry matter, carbon and nitrogen in the kernel of rice. Australian Journal of Plant Physiology 18: 259–265. [Google Scholar]
- Vong NQ, Murata Y. 1977. Studies on the physiological characteristics of C3 and C4 crop species. 1. The effects of air temperature on the apparent photosynthesis, dark respiration, and nutrient absorption of some crops. Japanese Journal of Crop Science 46: 45–52. [Google Scholar]
- Wilhelm EP, Mullen RE, Keeling PL, Singletary GW. 1999. Heat stress during grain filling in maize: effects on kernel growth and metabolism. Crop Science 39: 1733–1741. [Google Scholar]
- Wardlaw IF. 1970. The early stages of grain development in wheat: response to light and temperature in a single variety. Australian Journal of Biological Science 23: 765–774. [Google Scholar]
Associated Data
This section collects any data citations, data availability statements, or supplementary materials included in this article.