

Abstract
• Background and Aims Oilseed rape (Brassica napus) has often been used as a catch crop to deal with the issue of N leaching, but for this to be effective, prediction of the crop's N uptake capability and N partitioning is required. The aim of this work was to build a compartmental model of N dynamics in oilseed rape, based on the kinetic description of N uptake, partitioning and mobilization in each organ.
• Model In this study, logistic and exponential equations were fitted to the N relations of each compartment, especially the leaf at each node. Data previously obtained from an 15N-labelling field experiment was used to quantify the partitioning of total N content, the allocation of N taken up and subsequent changes in the sink/source status for endogenous N in each tissue throughout the growth cycle.
• Key Results and Conclusions This modelling approach provides a unique tool for the quantitative estimation of cycling of endogenous N in relation to changes in N uptake at the whole-plant level. Furthermore, as oilseed rape is known to release large amounts of N to the soil during spring through leaf loss, this model was used to identify potential methods for improving the N harvest index of the crop. Simulations showed that N content or yield could be improved by 15 % by optimizing N transfer from vegetative to reproductive tissues and by reducing the residual %N (DW) in abscised leaves.
Keywords: Brassica napus L., field conditions, 15N labelling, N uptake, N dynamics, mobilization, cycling N pool, modelling
INTRODUCTION
The winter oilseed rape (Brassica napus) crop is characterized by an unbalanced environmental N budget, which may be partly explained by both a low N use efficiency (Schjoerring et al., 1995; Hocking et al., 1997) and a relatively low N harvest index (NHI), of approximately 70 % (Schjoerring et al., 1995). This is mainly due to the considerable leaf abscission occurring during winter and spring, which returns a significant amount of N to the soil. Thus, up to 100 kg N ha−1 can be released during winter (Dejoux et al., 2000), compared with 20–60 kg N ha−1 during spring, depending on the fertilizer level (Hocking et al., 1997; Gabrielle et al., 1998; Gosse et al., 1999). Whereas nitrogen released to the soil in leaf litter during winter is partially recovered as mineral N during stem extension (52 kg N ha−1 taken up by the crop; Dejoux et al., 2000), the N returned to the soil during spring by the loss of senescing leaves is not taken up again by the crop.
The N content of lost dead leaves of winter oilseed rape can reach 1·2–4·5 % of dry weight (DW) in winter (Dejoux, 1999), and 2–2·5 % of DW in spring (Wright et al., 1988; Hocking et al., 1997). A recent study has pointed out a complex pattern of leaf loss, characterized by a decreasing N content (ranging from 2·5 to 1 %) concomitant with pod development (Malagoli et al., 2005). N content (% of DW) values are higher than in the dead leaves of other crops (1 %), which are presumed to correspond to structural N. Very few studies have been undertaken to explain the high levels of N in abscised leaves of rape. During plant development, N compounds are translocated from senescing tissues to other plant components (i.e. sink tissues) either for storage or for new growth. Leaf senescence in higher plants may be induced prematurely by environmental factors (shading, temperature, water or nutrient deficiency) as reported by several authors (Smart et al., 1994; Gan and Amasino, 1997; Buchanan-Wollaston et al., 2003). In winter oilseed rape, for example, senescence of the lower leaves in the canopy may be triggered by shading. It is well known that N distribution, based on the N content per unit leaf area (g N m−2) parallels the profile of light penetration into the canopy (Charles-Edwards et al., 1987), resulting in the optimization of photosynthetic activity at the whole-plant level (Grindlay, 1997). N mobilization from the shaded leaves toward leaves in the light is mainly the result of protein (mainly Rubisco) hydrolysis, chlorophyll degradation, and a subsequent decrease of photosynthesis that triggers an increase in leaf senescence under natural conditions (Okada et al., 1992; Jiang et al., 1993; Matile et al., 1996; Ono and Watanabe, 1997).
At the molecular level, the expression of specific senescence-associated genes (SAGs) can be regulated by sugar concentrations in the leaves. For example, it has been shown, in Arabidopsis thaliana, that expression of dark-inducible genes associated with leaf senescence can be induced by sugar starvation (Fujiki et al., 2001). Although some of the individual genes encoding enzymes involved in the mobilization of nitrogen during leaf senescence have been well characterized at the biochemical and molecular levels (Feller and Fisher, 1994; Buchanan-Wollaston et al., 2003), there have been few integrated studies of nitrogen mobilization at the whole-plant level during the growth cycle.
The N harvest index in winter oilseed rape could be increased by increasing the allocation of N to the pods, and limiting the supply of N fertilizer to reduce N release to the environment. Because of the complex processes involved (large number of leaves with potentially different source/sink dynamics), a simulation model appears to be a useful tool to capture and integrate the dynamics of N flows within the plant, and to identify targets that could increase the NHI in oilseed rape. Most existing models predict crop yield in response to variation in environmental factors such as N availability, water stress or disease levels (DAISY, Petersen et al., 1995; CERES-N, Gabrielle et al., 1998). In spite of the use of the N dilution curve for rapeseed (Colnenne et al., 1998) in CERES-N to define the potential N demand by each organ, no single parameter was able to characterize N dynamics within the plant and the subsequent sink/source relationships. There are no dynamic models for N partitioning and translocation, although comparable models for photoassimilate partitioning have been documented. Minchin et al. (1993) developed a model based on mass flow theory, in which the source/sink relationships are assumed to be governed by differences in the concentration of C assimilates between the source and sink organs, and by sink activity. A supply–demand model of carbon and nitrogen partitioning applied to defoliated grass (MecaNiCal: Tabourel-Tayot and Gastal, 1998) was developed, in which assimilate partitioning was based on the acquisition and utilization of the C and N in each compartment. No transport processes were included and N partitioning was deduced from C partitioning through C/N ratios. Despite this mechanistic approach, the N dynamics were not directly modelled and could not be estimated by kinetic parameters characterizing N allocation and N mobilization in the different organs.
The aim of the present study was to use an empirical model of internal N dynamics to investigate the consequences of varying parameters affecting NUE, including leaf duration and N mobilization efficiency determined by highest and residual N content, using experimental data obtained under field conditions from stem extension to harvest (Malagoli et al., 2005). Patterns of exogenous and endogenous N dynamics of all plant components, including the leaves at different nodes, were established by 15N labelling and were then used to determine parameters that might play a key role in uptake of N by the pods in oilseed rape. The compartmental analysis allowed the dynamic quantification of a circulating pool of endogenous N at the whole-plant level, which cannot usually be analysed accurately (by determination of the qualitative composition of the phloem sap, for example), and evaluation of the putative role of this pool in the long-distance regulation of N uptake. Finally, the model was used to identify potential methods to increase the NHI of winter oilseed rape.
MATERIAL AND METHODS
Experiment design
A field experiment was conducted to study the dynamics of N allocation and mobilization within winter oilseed rape plants (Brassica napus L., ‘Capitol’) from stem extension to harvest. Details of the experiment can be found in Malagoli et al. (2005). In brief, labelled K15NO3 (1 mM, 15N excess = 10 %, volume per plant = 750 mL) was applied randomly and weekly around individual plants (12 replicates) at the same developmental stage under field conditions. Seven days later, the plant were harvested and separated into the following components: taproot and roots, stem, green leaves, dead leaves, inflorescences and pods. The green leaves were numbered and then sampled individually as a function of their insertion, measured by counting leaf scars. At each harvest, the plant fractions were weighed, lyophilized, weighed again for dry matter determination and then ground to a fine powder for isotopic analysis. The total N and 15N in the plant samples were determined with a continuous flow isotope mass spectrometer (Twenty-twenty, PDZ Europa Scientific Ltd, Crewe, UK) linked to a C/N analyser (Roboprep C/N, PDZ Europa Scientific Ltd, Crewe, UK). This process allowed the calculation of N flows derived from N uptake or from N mobilization in the different organs.
MODEL DESCRIPTION
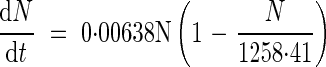
Data from the field experiment were used to develop a thermal time (degree-days, °Cd > 4 °C) step model that is able to simulate the dynamics of N allocation and mobilization at the whole-plant level on the basis of the relative contributions of exogenous N taken up (15N labelled) and the endogenous N mobilized from the vegetative parts in Brassica napus. Briefly, the data used for this modelling approach at a given thermal time were: total N content, N content derived from uptake during 7 d of labelling, and unlabelled N content that was derived from either previous N uptake or internal N cycling. The labelling method used under field conditions allowed an accurate assessment of the relative allocation of 15N within the plant (i.e. 15N amount in a given tissue/15N amount in plant). However, because the  can be variably diluted in the soil N, N uptake could not be estimated directly. Total N in the plant, resulting from N accumulation in all the tissues, was fitted to a logistic equation (n = 18; r2 = 0·92):
 |
This allowed the total N taken up at weekly intervals to be calculated. The allocation of N derived from uptake to a given tissue was then calculated as the product of the allocation of 15N uptake to this given tissue and total N taken up at the whole-plant level between two harvests. Finally, the mobilization of N from or to a given tissue could be calculated as the difference between changes in total N content and the amount of N allocated from uptake.
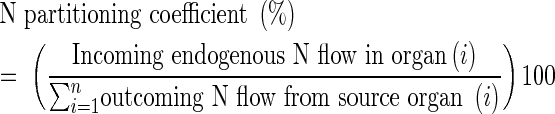
Modelling total N in each tissue (Fig. 1)
Fig. 1.

N dynamics in each organ during source/sink transition in terms of parameters characterizing N allocation and N mobilization. tNmax and tNmin, time when organ reaches Nmax and Nmin, respectively (°Cd); Nmax and Nmin, highest and lowest total N content value (mg plant−1); kTNin and kTNout, slope of equations characterizing N allocation and N mobilization (°Cd−1); k1, k2 and k3, slope of equations characterizing 15N allocation, endogenous N allocation and mobilization, respectively; N1, highest N content derived from N uptake; N2, highest N content derived from mobilization; tmob, time when endogenous N mobilization starts.
Experimental data collected under field conditions enabled the total N relations of each organ to be described as a succession of two phases: accumulation, when the organ was a sink, and mobilization of total N, when the organ became a source (Fig. 1). The logistic equation:
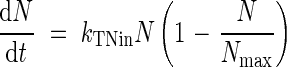 |
where kTNin and Nmax are the allocation rate constant (°Cd−1) and the highest total N amount (mg per plant), respectively, was fitted to experimental data during the increase of N content in a tissue (Fig. 1), until it reached Nmax. When the N content decreased progressively (Fig. 1) (in tissues such as leaves, taproots, stems and flowers, that, at a given time, act as a source), the data were fitted to an exponential equation:
 |
where kTNout is the mobilization rate constant (°Cd−1). This decrease of N, in leaves for example, represents the N mobilization (i.e. the allocation of N from uptake or from mobilization of N from other tissues, minus the mobilization of N to other tissues). N accumulation started when the organ appeared and stopped when the total N content reached the highest N value (tNmax,°Cd). Mobilization of total N started from tNmax and stopped when the organ disappeared (tNmin,°Cd; leaf abscission or final harvest; Fig. 1).
Allocation of N derived from uptake (Fig. 1)
Experimental data for dry weight and N content of each tissue were subjected to polynomial regression to minimize variation between each harvest date. N uptake was then estimated from the difference in plant N content between two harvest times. The 15N labelling enabled the partitioning of the N taken up between the different organs to be determined. Consequently, the accumulated N flow from uptake in each organ could be fitted with a logistic equation:
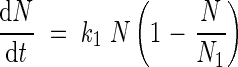 |
where k1 is the allocation rate constant of N taken up (°Cd−1) and N1 is the highest N taken up allocated to each organ (mg N per plant) (Fig. 1).
Allocation of N flow derived from endogenous mobilization (Fig. 1)
The endogenous N flow was calculated as the difference between the N from the total N flow and the N from 15N labelling. The transition of each organ from sink to source was determined as the start of endogenous N mobilization (tmob,°Cd) (Fig. 2).
Fig. 2.

Timing of changes in source–sink relationships in different tissues in Brassica napus during its growth cycle and balance of associated N flows.
The cumulative incoming endogenous N flows were fitted with a logistic equation:
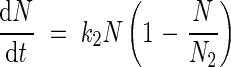 |
where k2 is the allocation rate constant (°Cd−1) for incoming endogenous N flows and N2 is the highest N content derived from mobilization allocated to each organ (mg N per plant). Endogenous N mobilization started at tmob (°Cd). As cumulative outgoing endogenous N flows reached negative values, a mathematical transformation was made: from tmob outgoing endogenous N flows were accumulated positively and added to the N2 value. Then, a logistic equation was fitted:
 |
where k3 is a mobilization rate constant (°Cd−1) for the outgoing endogenous N flows.
When the organ (i) in Fig. 3 had source status, the outgoing endogenous N flow (i) supplied an endogenous N pool circulating at the whole-plant level. The size of this pool could be evaluated dynamically from simple calculations of the N derived from mobilization, and could be considered to be the N compounds transported through phloem vessels. However, some N taken up may be reduced in the roots, and the resulting N compounds may be loaded into the xylem vessels. As xylem–phloem exchange of N compounds can occur, the total amount of amino acids cycling in the plant was also calculated on the basis of either 20 or 40 % of N taken up being reduced in the roots. This provided two extra hypotheses that could be tested for inhibition of nitrate uptake by cycling amino-acids.
Fig. 3.
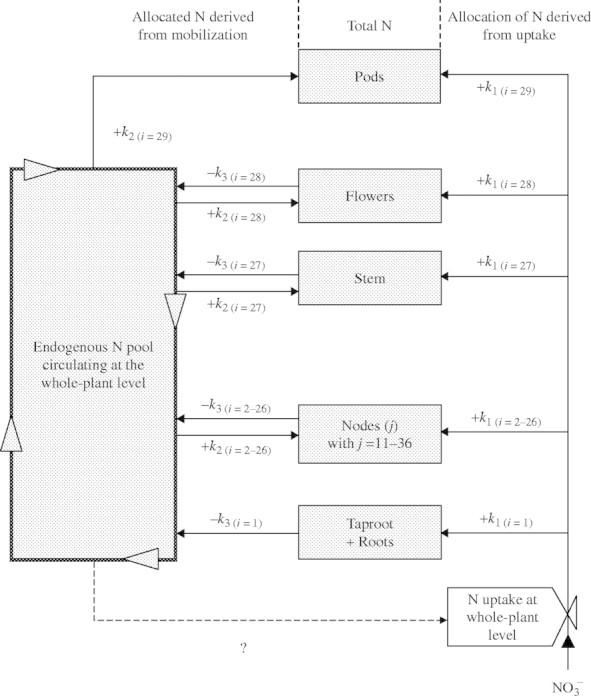
Conceptual overview of the proposed compartmental model used for dynamic calculation of N flows during the growth cycle in Brassica napus. Model is made up of i organs (ranging from 1 to 29) and j leaves at different nodes (numbered from 11 to 36).
This pool of circulating N compounds was partitioned between the sink organs as a function of the partitioning coefficient defined as:
 |
For example, net import of N into the stem at 1067 °Cd was calculated as follows:
 |
Assumptions of the model
The model is based on the net transfer of N into and between each organ of the plant. Consequently, it was assumed that each organ acts as a compartment that is able to store and mobilize N, and therefore to act successively as a source and as a sink (except for the pods, which have a permanent sink status). N accumulation in the sink organs was controlled by both N uptake and endogenous N coming from the source tissues (Fig. 2). The amount of mobilized endogenous N was calculated as the difference between the allocated N taken up and the total N (Fig. 1). Since the amount of mobilized endogenous N was controlled by crop morphology (biomass) and N status (N %), total N dynamics were defined by parameters characterizing either organ size and N status (Nmax, Nmin) or ability of the source to mobilize N (kTNout).
No transport process was taken into account in this model, following the conclusion of Bancal and Soltani (2002) that assimilate partitioning may be modelled without taking hydraulic resistances into account. The model was built using Model Maker software (Cherwell Scientific, Wallingford, UK).
Description of simulations
Different parameter values were used to alter N recycling within the plant, to investigate pathways for increasing N use efficiency and, subsequently, to increase the amount of N allocated to the pods. In particular, the key parameters Nmin and tNmin, which are important in determining the extent of N mobilization from source tissues and/or N accumulation in sink tissues, have been examined in order to identify key physiological processes that could be improved genetically or optimized by agronomic practices. For a given simulation, the compartmental analysis of N flows provides the quantitative consequences for each tissue, according to its current source or sink status. Leaves at the bottom of the canopy (nodes 11–21) were characterized by high values of total N content (mean 2·5–3 %) at leaf loss and a short duration of N mobilization. Simulations were therefore elaborated to reduce N loss by leaf abscission and tested with the model. The three reported simulations correspond to:
Simulation 0 (S0): model output obtained from field data.
Simulation 1 (S1): the parameter Nmin in nodes 11–21 was integrated in the model so that the final N content was equal to 1 % of DW at leaf abscission, corresponding to the value in most cultivated crop species.
Simulation 2 (S2): the duration of N mobilization in these leaves was increased such that all leaves were lost simultaneously (i.e. at 1604 °Cd; Malagoli et al., 2005). In this case, the value of Nmin was modified as in S1.
Simulation 3 (S3): Nmin values for all leaves at different nodes were set at 1 % of DW with a leaf loss at 1064 °Cd, while the Nmin value for stem was set at 0·7 % of DW.
N uptake was considered to be unchanged from stem extension to harvest in these different simulations. Consequently, only the dynamics of endogenous N were investigated. Several authors have suggested that N transfer to the pods can be improved by increasing endogenous N allocation in the transient storage tissues (i.e. nodes 22–36, stem and flowers) and by a better synchronization between the period of source N mobilization and uptake of N by the pods. The Nmax values of the source tissues were therefore increased for the different simulations, according to the balance of N for each tissue.
RESULTS
Kinetic parameters variation of total N and N derived from uptake or mobilization
The results for the total N dynamics in all compartments (Fig. 4) support the fitting of a logistic regression up to Nmax and of a negative exponential curve from Nmax to Nmin (except for pods and taproot, which behaved as a source tissue for total N during the experiment), as proposed in Fig. 1. Kinetic parameters that describe N flows in all compartments are given in Table 1 for total N. N flows derived from N uptake and presented in Fig. 4 support a logistic regression fit, while those describing endogenous N accumulation in tissues with a sink status (stem, leaf node 26 and pods) and mobilization when tissue switches to source status (taproot, stem, leaves at nodes 20 and 26) support the fitting of a logistic regression for the duration of each status. The values of these parameters are given in Table 2.
Fig. 4.
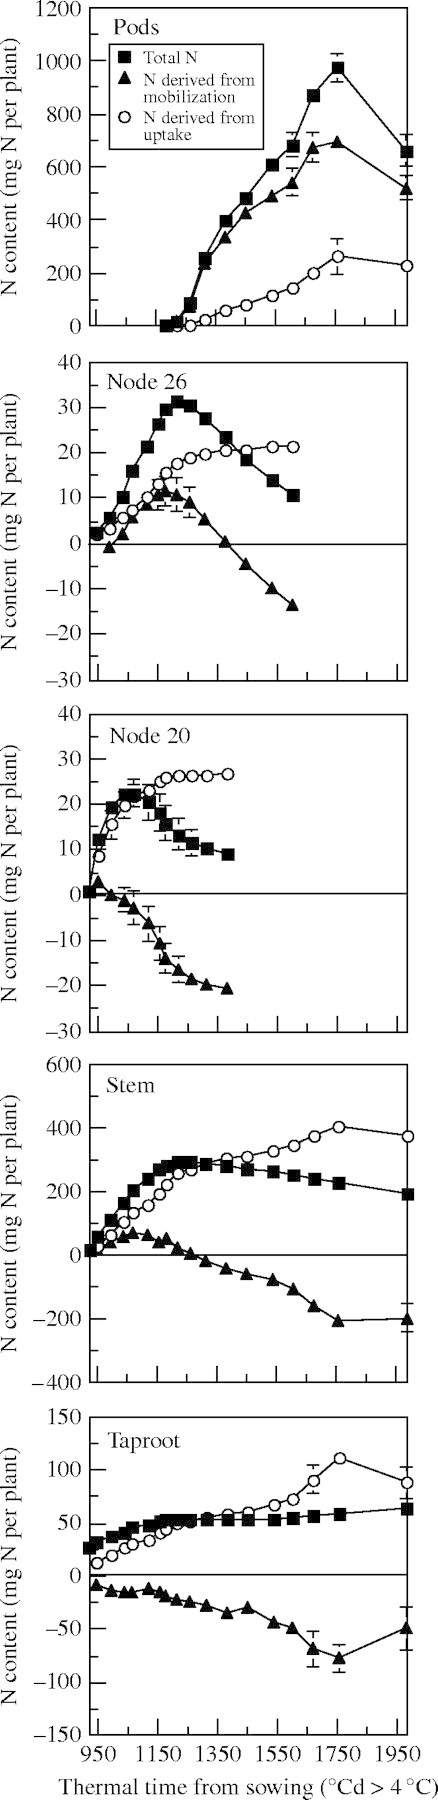
Cumulated total N contents in different tissues of Brassica napus (pods, leaves at node 20 and node 26, stem and taproot), and N content derived from uptake or from mobilization. Vertical bars indicate ± s.e. for n = 3, when larger than the symbol.
Table 1.
Mathematical description of total N flows in different organs. kTNin and kTNout, slope of equations characterizing N allocation and N apparent mobilization, respectively, in the different organs (×10−3 °Cd−1); Nmax and Nmin, highest and lowest total N content value, respectively (mg plant−1); tNmax and tNmin, time when organ reaches Nmax and Nmin, respectively (°Cd)
|
kTNin |
Nmax |
kTNout |
Nmin |
tNmax |
tNmin |
|
|---|---|---|---|---|---|---|
| Pods | 1425 (1) | 970·45 | – | – | – | – |
| Flowers | 24·09 (1) | 147·24 | 11·17 (2) | 10·8 | 1217·3 | 1382 |
| Stem | 27·88 (1) | 292·7 | 0·57 (2) | 193·31 | 1260·1 | 1982·6 |
| Taproot | 9·26 (1) | 53·72 | – | – | 1982·6 | – |
| Node 36 | 20·05 (1) | 1·67 | 4·42 (2) | 0·46 | 1312·4 | 1604·3 |
| Node 35 | 20·66 (1) | 1·8 | 1·87 (2) | 1·04 | 1312·4 | 1604·3 |
| Node 34 | 18·69 (1) | 3·36 | 1·77 (2) | 2 | 1312·4 | 1604·3 |
| Node 33 | 19·41 (1) | 4·34 | 2·51 (2) | 2·08 | 1312·4 | 1604·3 |
| Node 32 | 19·87 (1) | 8·55 | 2·74 (2) | 3·84 | 1312·4 | 1604·3 |
| Node 31 | 20·68 (1) | 10·88 | 2·23 (2) | 5·04 | 1260·1 | 1604·3 |
| Node 30 | 18·03 (1) | 14·82 | 2·10 (2) | 7·19 | 1260·1 | 1604·3 |
| Node 29 | 19·50 (1) | 22·27 | 2·43 (2) | 9·63 | 1260·1 | 1604·3 |
| Node 28 | 19·49 (1) | 28·63 | 2·81 (2) | 10·85 | 1260·1 | 1604·3 |
| Node 27 | 20·31 (1) | 30·88 | 2·81 (2) | 10·4 | 1217·3 | 1604·3 |
| Node 26 | 20·52 (1) | 31·37 | 2·80 (2) | 10·6 | 1217·3 | 1604·3 |
| Node 25 | 20·83 (1) | 30·69 | 2·96 (2) | 9·74 | 1217·3 | 1604·3 |
| Node 24 | 25·77 (1) | 26·73 | 2·67 (2) | 8·04 | 1155·9 | 1604·3 |
| Node 23 | 22·86 (1) | 21·44 | 2·63 (2) | 6·57 | 1155·9 | 1604·3 |
| Node 22 | 26·98 (1) | 19·47 | 2·26 (2) | 5·82 | 1119·5 | 1604·3 |
| Node 21 | 20·68 (1) | 20·08 | 2·26 (2) | 9·85 | 1067·1 | 1382 |
| Node 20 | 22·86 (1) | 22·2 | 2·82 (2) | 9·13 | 1067·1 | 1382 |
| Node 19 | 28·60 (1) | 18·98 | 3·29 (2) | 7·92 | 995·1 | 1217·3 |
| Node 18 | 31·18 (1) | 24·32 | 6·45 (2) | 12·36 | 1037 | 1217·3 |
| Node 17 | 42·15 (1) | 21·72 | 7·06 (2) | 5·97 | 995·1 | 1178 |
| Node 16 | 42·99 (1) | 24·52 | 5·42 (2) | 10·26 | 995·1 | 1155·9 |
| Node 15 | 43·49 (1) | 23·08 | 8·97 (2) | 6·05 | 995·1 | 1119·5 |
| Node 14 | 43·53 (1) | 21·23 | 7·26 (2) | 12·59 | 995·1 | 1067·1 |
| Node 13 | 78·58 (1) | 23·61 | 16·59 (2) | 7·15 | 948·9 | 1067·1 |
| Node 12 | 78·50 (1) | 24·3 | 19·66 (2) | 10·66 | 948·9 | 1037 |
| Node 11 | 43·53 (1) | 9·79 | 7·40 (2) | 7·18 | 995·1 | 1037 |
Numbers in brackets correspond to the following equations: (1) dN/dt = kTNinN (1 − N/Nmax); (2) dN/dt = −kTNoutN.
Table 2.
Mathematical description of N flows from uptake and mobilization in different organs. k1, k2and k3, slope of equations characterizing 15N allocation, endogenous N allocation and mobilization in the different organs, respectively (×10−3 °Cd−1); N1, highest N content derived from N uptake (mg per plant); N2, highest N content derived from mobilization in each organ (mg per plant)
| N derived from uptake |
N derived from mobilization |
|||||||
|---|---|---|---|---|---|---|---|---|
|
k1 |
N1 |
k2 |
N2 |
K3 |
||||
| Pods | 12·45 (3) | 259·3 | 7·53 (4) | 694·69 | – | |||
| Flowers | 19·31 (3) | 62·3 | 10·13 (4) | 93·99 | 3·82 (5) | |||
| Stem | 9·12 (3) | 375·09 | 22·35 (4) | 72·35 | 15·56 (5) | |||
| Taproot | 7·70 (3) | 87·66 | – | – | 0·89 (5) | |||
| Node 36 | 18·37 (3) | 0·53 | 10·33 (4) | 0·91 | 16·44 (5) | |||
| Node 35 | 19·14 (3) | 0·806 | 25·09 (4) | 1·11 | 16·59 (5) | |||
| Node 34 | 12·25 (3) | 1·29 | 23·22 (4) | 1·57 | 16·65 (5) | |||
| Node 33 | 12·41 (3) | 2·09 | 24·17 (4) | 1·98 | 10·56 (5) | |||
| Node 32 | 13·09 (3) | 4·34 | 24·17 (4) | 3·50 | 18·02 (5) | |||
| Node 31 | 13·48 (3) | 6·25 | 25·14 (4) | 4·63 | 9·75 (5) | |||
| Node 30 | 13·97 (3) | 9·3 | 24·07 (4) | 2·17 | 16·47 (5) | |||
| Node 29 | 14·32 (3) | 13·05 | 25·91 (4) | 8·08 | 11·57 (5) | |||
| Node 28 | 14·50 (3) | 16·26 | 26·01 (4) | 13·12 | 12·41 (5) | |||
| Node 27 | 14·96 (3) | 21·06 | 27·34 (4) | 14·14 | 7·19 (5) | |||
| Node 26 | 15·17 (3) | 21·42 | 27·15 (4) | 12·26 | 10·81 (5) | |||
| Node 25 | 15·07 (3) | 21·82 | 27·36 (4) | 9·31 | 12·43 (5) | |||
| Node 24 | 15·80 (3) | 22·49 | 28·66 (4) | 8·46 | 13·04 (5) | |||
| Node 23 | 15·70 (3) | 18·84 | 26·05 (4) | 1·87 | 15·39 (5) | |||
| Node 22 | 16·44 (3) | 25·11 | 29·62 (4) | 2·68 | 8·7 (5) | |||
| Node 21 | 17·46 (3) | 26·8 | 29·81 (4) | 2·32 | 21·16 (5) | |||
| Node 20 | 17·44 (3) | 26·48 | – | – | 21·32 (5) | |||
| Node 19 | 22·08 (3) | 22·81 | – | – | 23·04 (5) | |||
| Node 18 | 26·83 (3) | 26·36 | – | – | 22·66 (5) | |||
| Node 17 | 16·62 (3) | 21·51 | – | – | 22·79 (5) | |||
| Node 16 | 23·08 (3) | 21·43 | – | – | 22·99 (5) | |||
| Node 15 | 22·20 (3) | 21·32 | – | – | 23·02 (5) | |||
| Node 14 | 34·85 (3) | 13·35 | – | – | 21·58 (5) | |||
| Node 13 | 23·32 (3) | 12·74 | – | – | 23·78 (5) | |||
| Node 12 | 26·76 (3) | 13·68 | – | – | 28·09 (5) | |||
| Node 11 | 17·42 (3) | 3·03 | – | – | 26·90 (5) | |||
Numbers in brackets correspond to the following equations: (3) dN/dt = k1N (1 − N/N1); (4) dN/dt = k2N (1 − N/N2); (5) dN/dt = k3N[1 − N/(N2 + Cumulative net N export)].
The slope of total N allocation in each leaf (kTNin, Table 1) decreased with increasing node number, being in the range of 42·2–78·6 × 10−3 °Cd−1 for nodes 11–17, and then following a nearly linear decline from node 18 (31·2 × 10−3 °Cd−1) to node 36 (20·1 × 10−3 °Cd−1). In the meantime, the Nmax values, corresponding to the highest N content per leaf expressed in mg plant−1, were more variable, and this was due mainly to differences in leaf size. However, when the N content was calculated per cm2, two main groups of leaves were found to behave differently. Leaves at nodes 13–22 contained about 0·45 mg N cm−2, whereas those at nodes 23–31 reached only 0·25 mg N cm−2. The slope of N mobilization (kTNout, Table 1) decreased with increasing leaf node number. The lowest N content in leaves, corresponding to the N remaining in the leaves when they were lost, was also highly variable and depended both on leaf size and the ability of the leaf to mobilize nitrogen. When expressed per cm2, or per g DW, it was again apparent that two main groups of leaves behaved differently. The lowest leaf N content was approximately 2·5 % of DW for nodes 11–21, but only 1·8 % for nodes 22–36 (Malagoli et al., 2005).
The values of the slope of the logistic curve describing the allocation of exogenous N (k1; Table 2) are high in the leaf nodes 11–21, in which N accumulation (1) occurs when N uptake at the whole-plant level is high (Fig. 5), and (2) is mainly achieved by N taken up (for example see leaf node 20; Fig. 4). In the upper leaf nodes (from leaf node 21), k1 decreased with increasing node number (Table 2). This decrease was concomitant with (1) a decrease of the N uptake at the whole-plant level (Fig. 5), (2) the appearance of new sink tissues for N taken up, such as stem and pods (Fig. 4), and (3) the contribution of endogenous N to N-accumulating leaf nodes (for example see leaf node 26; Fig. 4).
Fig. 5.

Simulated changes of mineral N uptake by Brassica napus during the growth cycle and of the cycling N compounds pool at the whole-plant level, estimated strictly from mobilization of endogenous N, or by considering that either 20 % or 40 % of N taken up is reduced in the roots, and the resulting amino acids increasing the pool of N compounds.
In spite of relatively low N mobilization ability, as shown in a companion paper (Malagoli et al., 2005), lower leaf nodes (nodes 11–21) were characterized by high values of the slope describing the endogenous N mobilization (k3; Table 2), which may be related to the short duration of the N mobilization period (Table 1). From leaf node 21, the mean k3 value decreased and remained relatively constant between 29·8 to 25·1 × 10−3 °Cd−1 at nodes 21 and 35, respectively. As shown in Fig. 4, no slope describing the endogenous N allocation (k2; Table 2) in leaf nodes 11–20 was calculated because N accumulation was mainly of exogenous N (for example, see leaf node 20; Fig. 4). From leaf node 21, the k2 values decreased linearly with increasing node number (Table 2). The decrease paralleled an increase of the duration of the N accumulation period (Table 1) and of the competition for endogenous N with newly appearing sink tissues, such as pods (Fig. 4).
Endogenous pool of N compounds circulating at the whole-plant level and relationships with current N uptake
One of the main outputs of the compartmental analysis of N flows was an estimate of the pool of cycling N compounds derived from mobilization (Fig. 5). Because of the reduction of mineral N in the roots, this pool can receive N compounds that are synthesized in the roots and transported to the shoots via the xylem. The modification of the circulating pool of N compounds (assuming an increase of nitrate reduction as described in the Material and Methods section), together with changes in root mineral N uptake, is shown in Fig. 5. The highest amounts of N compounds recycled in the plant were found around 1325 °Cd (after flowering). Although N uptake at this time was at its lowest level, no clear relationship was found between the amount of cycling N compounds and the amount of N uptake. However, during vegetative growth (before 1100 °Cd), root N uptake remained at a relatively high level, but N mobilization was very low, although cycling of N compounds could be increased by increasing the root contribution to the synthesis and transport of N compounds. From stem extension to flowering, N uptake decreased from 2·7 to 0·5 mg N °Cd−1 per plant, whereas endogenous N flow remobilized from vegetative tissues increased slightly (from 0·4 to 0·6 mg N °Cd−1 per plant). The start of uptake of N by the pods was marked by an increased mobilization from the source tissues, followed by a decrease up to harvest. An increase in N uptake occurred only from pod mid-filling onwards. No correlation was found between N uptake and the size of the cycling endogenous N pool at the whole-plant level, indicating the operation of other regulatory processes.
Which processes to alter in order to increase the N content of pods?
Different values for input parameters were used to simulate their effects on N recycling within the plant by increasing the amount of N allocated to pods while reducing the amount of N left in senescent leaves. Values of potential key parameters (Nmin and tNmin), which were likely to increase N mobilization from source tissues and/or N accumulation in sink tissues, were modified. Leaves at the bottom of the canopy (nodes 11–21) were characterized by high N concentrations (mean 2·5–3 % of DW) when lost, and a short duration of N mobilization (Malagoli et al., 2005). The dynamics of endogenous N only were investigated but, given that the amount of N at tNmax may change, the value of kTNout was recalculated simultaneously for each simulation in each compartment to reach the same fixed Nmin values.
All N flows from endogenous mobilization, calculated from the model for the three different simulations, are presented in Fig. 6. Reducing the remaining N % in leaves at the lower nodes (11–21) leads to an increased mobilization of 36 mg N per plant from these leaves, and a reduction of 30 % in the amount of N that may be released to the soil by leaf loss (32·5 kg N ha−1 for S1 instead of 45 kg N ha−1 for S0). This would also increase the amount of endogenous N allocated to leaves at nodes 22–36, to the stem and to flowers, and subsequently its storage or metabolic use and its later mobilization. Based on a grain yield for this experiment in the range of 3·6 t ha−1 (estimated from the entire plot) to 8·2 t ha−1 (estimated from individual plant harvests, leading to an overestimation of yield), this would, for the same DW yield, increase grain N content from 3·18 % (S0, Table 3) to 3·49 and 3·34 % of DW, respectively. On the other hand, if grain N % contents were kept constant at 3·18 %, then the grain yield would increase by 9·7 % and 5 %, respectively (S1, Table 3). In the second simulation (S2, Fig. 6), which consisted of increasing the leaf life span at nodes 11–21, the mobilization potential was increased (+36 mg N per plant) but to a lesser extent compared with S1 (Table 3), with finally a small increase in N content for constant yield, or a slightly higher yield if grains kept the same N content (Table 3).
Fig. 6.
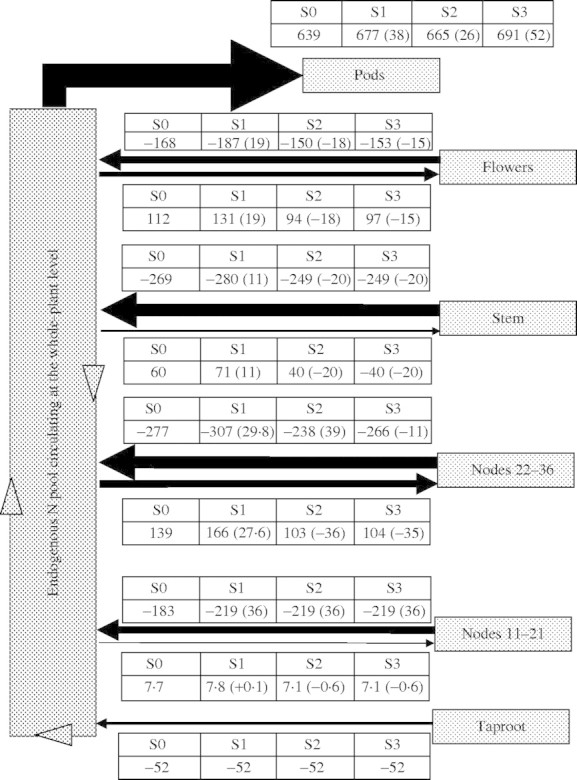
Simulated flows of mobilized N from and to each tissue, calculated from the compartmental model, and for the different simulations tested [S0 (control), S1, S2 and S3, as explained in legends of Tables]. Numbers in brackets indicate the amount of endogenous allocated, or mobilized, N as compared with S0.
Table 3.
Simulated N contents (% of DW) in seeds and yield (t ha−1) with the tested scenarios. S0, control; S1, total N content of nodes 11–21 equal to 1 % at leaf abscission; S2, delayed abscission of nodes 11–21 (at 1604 °Cd) with a total N content equal to 1 %; S3, delayed abscission of nodes 11–21 (at 1604 °Cd) with a total N content equal to 1 % in all leaves
| N contents (% of DW) with a constant yield of |
Yields (t ha-1) with a constant N content of |
|||||
|---|---|---|---|---|---|---|
| 3·6 t ha−1 |
8·2 t ha−1 |
3·18 % |
3·18 % |
|||
| S0 | 3·18 | 3·18 | 3·6 | 8·7 | ||
| S1 | 3·49 | 3·34 | 3·95 | 9·17 | ||
| S2 | 3·37 | 3·28 | 3·82 | 9·03 | ||
| S3 | 3·64 | 3·40 | 4·12 | 9·34 | ||
The final simulation (S3, Fig. 6), which combined elements of the former two (i.e. longer life span for leaves at nodes 11–21 with a minimal N content of 1 % of DW for all leaves) gave more surprising results. Although the mobilization of N from leaves at nodes 11–21 increased by 36 mg per plant (Fig. 6), this had a negative effect on leaves at nodes 22–36 as they mobilized less N, mostly because they received less N from nodes 11–21, which was directly allocated to pods (effect of longer leaf lifespan and delayed mobilization with direct allocation to the pods). In this simulation, the yields or N % DW of the seeds were increased as compared with simulation S0 (Table 3).
DISCUSSION
The aim of this study was to develop a compartmental model of N partitioning based on an 15N labelling experiment conducted under field conditions (Malagoli et al., 2005). Harvests were conducted weekly by separating all leaves, leading to a 25-compartment system. By combining the weekly mineral N uptake (calculated from logistic fitting of N accumulation in the whole plant, with the relative allocation rate of 15N taken up weekly) the N flows from and into each compartment, derived either from uptake or from mobilization, could be quantified precisely. Then the model was used to determine the conditions that would maximize the allocation of N to pods by decreasing N loss to the soil and improving N mobilization within the plant.
Endogenous N pool circulating at the whole-plant level
The dynamic modelling of N flows enables the pool of cycling N compounds to be quantified throughout the growth cycle. This evaluation of the mobile pool, which is difficult to assess quantitatively by classical methods, offered an opportunity to test the conceptual model of Imsande and Touraine (1994) that increased leaf senescence during the vegetative/reproductive transition, coupled with a reduced protein synthesis in leaves is responsible for higher amino acid cycling through the phloem, which might inhibit root N uptake. Figure 5 shows that the size of this pool increased significantly during and after flowering, while N uptake was maintained at a low level, but there was no obvious correlation between N uptake and the size of the pool when the entire growth cycle was considered. This could be explained by recent molecular studies showing that mineral N transporters in the roots can be subject to complex regulation at the transcriptional level, through inhibition by certain amino acids and stimulation by products of carbon metabolism (Lejay et al., 2003). Nevertheless, the different simulations tested in the models show that this cycling N pool could not be increased to such an extent that it would necessarily reduce root N uptake (S0, S1, S2 or S3, data not shown). This suggests that genotypes with a higher level of N mobilization might maintain a relatively similar constant N uptake rate.
Agronomic implications
It seems that higher N harvest index (NHI) and N use efficiency (NUE) may be achieved by improving N mobilization from the source tissues (especially leaves), although Yau and Thurling (1987) have demonstrated that NUE is not a heritable trait in oilseed rape. Model outputs have demonstrated that the amount of endogenous N mobilized from leaf nodes located at the bottom of the canopy, and the timing of N mobilization, are important variables influencing the allocation of N to pods. When the final N content in the leaves located at the bottom of the canopy was reduced to 1 % (S1), model outputs showed a lower N release to the soil (−13 kg N ha−1) and a higher N accumulation in pods (Table 3). Dejoux (1999) and Dejoux et al. (2000) have shown that freezing during the autumn–winter period can lead to high losses of leaf nitrogen, amounting to 100 kg N ha−1. Nevertheless, 28 and 24 % of N lost by leaf drop were reabsorbed by rapeseed at flowering and at harvest, respectively, thereby limiting N losses. Trinsoutrot et al. (2000) and Thomsen and Christensen (1998) found that N in residues, such as stem, pod wall and taproot, was relatively unavailable during the spring and summer. Thus, during spring, N losses from leaf abscission cannot be reabsorbed by a rapeseed crop because of the immobilization of N. Consequently, reducing N release to the soil by improving N mobilization in the leaves could provide a valuable means of limiting N pollution of groundwater, as demonstrated by the model output. Given that N mobilization at leaf nodes at the bottom of the canopy started before flowering and uptake of N by the pods, the improved N accumulation was due to the ability of the buffer compartments (stem, flowers, leaves at nodes 22–36) to transfer additional endogenous N from nodes 11–21 to pods. In this simulation, effective transfer was the result of higher N allocation to, and subsequently higher Nmax values in, the flowers, stem and leaves at nodes 22–36. Nevertheless, despite the similar positive variations in the endogenous N allocated (averaging +15–20 %) and Nmax values (ranging between 5–10 %) at nodes 22–36, additional endogenous N allocated to the leaves was mainly driven toward nodes 24–29. This can be explained by the fact that endogenous N contributed up to 50 % of N accumulation at nodes 24–29.
On the other hand, increasing the duration of N mobilization in the leaves at the bottom of the canopy (S2) led to a decrease in kTNout (data not shown) and a slightly higher N accumulation in the pods (Table 3). Model outputs demonstrated that this higher transfer of endogenous N resulted from direct transfer from nodes 11–21 to the pods. Consequently the buffer compartments received less endogenous N. A better synchronization between source N mobilization and uptake of N by the pods may therefore increase NUE, which is consistent with the conclusion of Rossato et al. (2001). Moreover, Rood et al. (1984) suggested that the near-cessation of N uptake from flowering onwards, observed in oilseed rape under controlled conditions, was responsible for the start of N mobilization and subsequent leaf senescence. They therefore proposed that maintaining N uptake might delay leaf senescence and lead to a higher yield. A better source/sink relationship for N could also be obtained with early flowering varieties. Habekotté (1997) showed, by simulation studies, that yield would be improved by using early flowering cultivars because of better photoassimilate transfer.
Combining the first two simulations and adding both positive effects (S3) resulted in the greatest improvement of N accumulation in the pods. It is interesting to note that the highest endogenous N increase was observed when leaf nodes located at the bottom of the canopy had the same kinetic characteristics as the leaves located at the middle and top of the canopy, i.e. Nmin at 1 % of DW and kTNout.
Conclusions
The present modelling approach suggests that the values of key parameters (Nmin and kTNout) could be optimized to improve N allocation to pods, through better N mobilization. Nanda et al. (1995) showed, by studying the pattern of leaf appearance in Brassica species, that the number of leaves and the leaf area at higher nodes within the canopy were positively correlated with days from sowing to floral initiation. Previously cited studies proposed that a better N transfer toward the pods could be achieved by early flowering. It would therefore be of interest to select an early planting date in order to maximize the leaf area of the top nodes and hence the level of N in these leaves. Moreover, Mickelson et al. (2003) found that the confidence interval of a QTL related to nitrogen mobilization from the flag leaf in barley (Hordeum vulgare) overlapped with the QTL for heading date and leaf size. In particular, they found a negative correlation between leaf N concentration at maturity and leaf size (i.e. lines with large leaves were more efficient at N mobilization).
This work was done with a single genotype under a given range of environmental conditions (temperature and light intensity, for example). It will be of interest to see how these factors and the different morphological characteristics of different genotypes (different trophic network and indirectly modified leaf environment) affect N dynamics in leaves.
APPENDIX
Description, dimensions and equations for the parameters used in the model
| Parameter |
Description |
Dimension |
|---|---|---|
| kTNin [eqn (1)] | Allocation rate constant of total N | °Cd−1 |
| kTNout [eqn (2)] | Mobilization rate constant of total N | °Cd−1 |
| k1 [eqn (3)] | Allocation rate constant of N taken up | °Cd−1 |
| k2 [eqn (4)] | Allocation rate constant of incoming endogenous N flows | °Cd−1 |
| k3 [eqn (5)] | Mobilization rate constant of outgoing endogenous N flows | °Cd−1 |
| Nmax [eqn (1)] | Highest total N content in each organ | mg N per plant |
| N min | Lowest total N content in each organ | mg N per plant |
| N1 [eqn (3)] | Highest N taken up allocated to each organ | mg N per plant |
| N2 [eqns (4), (5)] | Highest N content derived from mobilization allocated to each organ | mg N per plant |
| t Nmax | Time when organ reaches Nmax value | °Cd |
| t Nmin | Time when organ reaches Nmin value | °Cd |
| t mob | Start of endogenous N mobilization | °Cd |
Acknowledgments
We would like to thank Patrick Beauclair for his technical assistance in 15N labelling and harvesting under field and laboratory conditions, and Marie-Paule Henry for her helpful assistance in sample analysis by mass spectrometry, as well as in laboratory harvesting and measurement of leaf area.
LITERATURE CITED
- Bancal P, Soltani F. 2002. Source–sink partitioning. Do we need Münch? Journal of Experimental Botany 53: 1919–1928. [DOI] [PubMed] [Google Scholar]
- Buchanan-Wollaston V, Earl S, Harisson E, Mathas E, Navabpour S, Page T, Pink D. 2003. The molecular analysis of leaf senescence—a genomics approach. Plant Biotechnology Journal 1: 3–22. [DOI] [PubMed] [Google Scholar]
- Charles-Edwards DA, Stutzel H, Ferraris R, Beech DF. 1987. An analysis of spatial variation in the nitrogen content of leaves from different horizons within the canopy. Annals of Botany 60: 421–426. [Google Scholar]
- Colnenne C, Meynard JM, Reau R, Justes E, Merrien A. 1998. Determination of a critical nitrogen dilution curve for winter oilseed rape. Annals of Botany 81: 311–317. [Google Scholar]
- Dejoux JF. 1999.Evaluation d'itinéraires techniques du colza d'hiver en semis très précoces. Analyse agronomique, conséquences environnementales et économiques. Ph.D. thesis, Institut National Agronomique, Paris–Grignon, France. [Google Scholar]
- Dejoux JF, Recous S, Meynard JM, Trinsoutrot I, Leterme P. 2000. The fate of nitrogen from winter-frozen rapeseed leaves: mineralization, fluxes to the environment and uptake by rapeseed crop in spring. Plant and Soil 218: 257–272. [Google Scholar]
- Feller U, Fisher A. 1994. Nitrogen metabolism in senescing leaves. Critical Reviews in Plant Science 13: 241–273. [Google Scholar]
- Fujiki Y, Yoshikawa Y, Sayo T, Inada N, Ito M, Nishida I, Watanabe A. 2001. Dark-inducible genes from Arabidopsis thaliana are associated with leaf senescence and repressed by sugars. Physiologia Plantarum 111: 345–352. [DOI] [PubMed] [Google Scholar]
- Gabrielle B, Denoroy P, Gosse G, Justes E, Andersen MN. 1998. Development and evaluation of a CERES-type model for winter oilseed rape. Field Crops Research 57: 95–111. [Google Scholar]
- Gan S, Amasino R. 1997. Making sense of senescence, molecular genetic regulation and manipulation of leaf senescence. Plant Physiology 113: 313–319. [DOI] [PMC free article] [PubMed] [Google Scholar]
- Gosse G, Cellier P, Denoroy P, Gabrielle B, Laville P, Leviel B, Justes E, Nicolardot B, Mary B, Recous S, Germon JC, Hénault C, Leech PK. 1999. Water, carbon and nitrogen cycling in a rendzina soil cropped with winter rape: the Châlons oilseed rape database. Agronomie 19: 119–124. [Google Scholar]
- Grindlay DJC. 1997. Toward an explanation of crop nitrogen demand based on the optimization of leaf nitrogen per unit leaf area. Journal of Agricultural Science 128: 377–396. [Google Scholar]
- Habekotté B. 1997. Evaluation of seed yield determining factors of winter oilseed rape (Brassica napus L.) by means of crop growth modelling. Field Crops Research 54: 137–151. [Google Scholar]
- Hocking PJ, Randall PJ, DeMarco D. 1997. The response of dryland canola to nitrogen fertilizer: partitioning and mobilization of dry matter and nitrogen, and nitrogen effects on yield components. Field Crops Research 54: 201–220. [Google Scholar]
- Imsande J, Touraine B. 1994. N demand and the regulation of nitrate uptake. Plant Physiology 105: 3–7. [DOI] [PMC free article] [PubMed] [Google Scholar]
- Jiang C-Z, Rodermel SR, Shibes RM. 1993. Photosynthesis, Rubisco activity and amount, and their regulation by transcription in senescing soybean leaves. Plant Physiology 101: 105–112. [DOI] [PMC free article] [PubMed] [Google Scholar]
- Lejay L, Gansel X, Cerezo M, Tillard P, Müller C, Krapp A, von Wirén N, Daniel-Vedele F, Gojon A. 2003. Regulation of root ion transporters by photosynthesis: functional importance and relation with hexokinase. The Plant Cell 15: 2218–2232. [DOI] [PMC free article] [PubMed] [Google Scholar]
- Malagoli P, Lainé P, Rossato L, Ourry A. 2005. Dynamics of nitrogen uptake and mobilization in field-grown winter oilseed rape from stem elongation to harvest. I. Dynamics of nitrogen uptake and mobilization in field-grown winter oilseed rape from stem elongation to harvest. Annals of Botany 95: 853–861. [DOI] [PMC free article] [PubMed] [Google Scholar]
- Matile P, Hörtensteiner S, Thomas H, Krautler B. 1996. Chlorophyll breakdown in senescent leaves. Plant Physiology 112: 1403–1409. [DOI] [PMC free article] [PubMed] [Google Scholar]
- Mickelson S, See D, Fletcher DM, Garner JP, Foster CR, Blake TK, Fischer AM. 2003. Mapping of QTL associated with nitrogen storage and remobilization in barley (Hordeum vulgare L.) leaves. Journal of Experimental Botany 54: 801–812. [DOI] [PubMed] [Google Scholar]
- Minchin PHH, Thorpe MR, Farrar JF. 1993. A simple mechanistic model of phloem transport which explains sink priority. Journal of Experimental Botany 44: 947–955. [Google Scholar]
- Nanda R, Barghava SC, Rawson HM. 1995. Effect of sowing date on rates of leaf appearance, final leaf numbers and areas in Brassica campestris, B. juncea, B napus and B. carinata Field Crops Research 42: 125–134. [Google Scholar]
- Okada K, Inoue Y, Satoh K, Katho S. 1992. Effects of light on degradation of chlorophyll and proteins during senescence of detached rice leaves. Plant Cell Physiology 33: 1183–1191. [Google Scholar]
- Ono K, Watanabe A. 1997. Levels of endogenous sugars, transcripts of rbcS and rbcL, and of RuBisCo protein in senescing sunflower leaves. Plant Cell Physiology 38: 1032–1038. [Google Scholar]
- Petersen CT, Jøgensen U, Svendsen H, Hansen S, Jensen HE, Nielsen NE. 1995. Parameter assessment for simulation of biomass production and nitrogen uptake in winter rape. European Journal of Agronomy 4: 77–89. [Google Scholar]
- Rood SB, Major DJ, Charnetski WA. 1984. Seasonal changes in 14CO2 assimilation and 14C translocation in oilseed rape. Field Crops Research 8: 341–348. [Google Scholar]
- Rossato L, Lainé P, Ourry A. 2001. Nitrogen storage and remobilization in Brassica napus L. during the growth cycle : nitrogen fluxes within the plant and changes in soluble protein patterns. Journal of Experimental Botany 52: 1655–1663. [PubMed] [Google Scholar]
- Schjoerring JK, Bock JGH, Gammelvind L, Jensen CR, Mogensen VO. 1995. Nitrogen incorporation and remobilization in different shoot components of field-grown winter oilseed rape (Brassica napus L.) as affected by rate of nitrogen application and irrigation. Plant and Soil 177: 255–264. [Google Scholar]
- Smart C, Monéger F, Leaver CJ. 1994. Cell-specific regulation of gene expression in mitochondria during anther development in sunflower. The Plant Cell 6: 811–825. [DOI] [PMC free article] [PubMed] [Google Scholar]
- Tabourel-Tayot F, Gastal F. 1998. MecaNiCAL, a supply-demand model of carbon and nitrogen partitioning applied to defoliated grass I. Model description and analysis. European Journal of Agronomy 9: 223–241. [Google Scholar]
- Thomsen IK, Christensen BT. 1998. Cropping system and residue management effects on nitrate leaching and crop yields. Agricultural, Ecosystems and Environment 68: 73–84. [Google Scholar]
- Trinsoutrot I, Nicolardot B, Justes ES. 2000. Decomposition in the field of residues of oilseed rape grown at two levels of N fertilisation: effects on the dynamics of soil mineral N between successive crops. Nutrient Cycling in Agroecosystems 56: 125–137. [Google Scholar]
- Wright GC, Smith CJ, Woodroofe MR. 1988. The effect of irrigation and nitrogen fertilizer on rapeseed (Brassica napus) production in south-eastern Australia. I. Growth and seed yield. Irrigation Science 9: 1–13. [Google Scholar]
- Yau SK, Thurling N. 1987. Variation in nitrogen response among spring rape (Brassica napus) cultivars and its relationship to nitrogen uptake and utilization. Field Crops Research 45: 29–229. [Google Scholar]