

Abstract
• Background and Aims DNA microarrays allow comprehensive estimation of total cellular mRNA levels but are also amenable to studies of other mRNA populations, such as mRNAs in translation complexes (polysomes). The aim of this study was to evaluate the role of translational regulation in response to oxygen deprivation (hypoxia).
• Methods Alterations in total cellular and large polysome (≥ five ribosomes per mRNA) mRNA levels were monitored in response to 12 h of hypoxia stress in seedlings of Arabidopsis thaliana with a full-genome oligonucleotide microarray.
• Key Results Comparison of two mRNA populations revealed considerable modulation of mRNA accumulation and diversity in translation in response to hypoxia. Consistent with the global decrease in protein synthesis, hypoxia reduced the average proportion of individual mRNA species in large polysome complexes from 56·1 % to 32·1 %. A significant decrease in the association with translational complexes was observed for 77 % of the mRNAs, including a subset of known hypoxia-induced gene transcripts. The examination of mRNA levels of nine genes in polysomes fractionated through sucrose density gradients corroborated the microarray data. Gene cluster analysis was used to identify mRNAs that displayed co-ordinated regulation. Fewer than half of the highly induced mRNAs circumvented the global depression of translation. Moreover, a large number of mRNAs displayed a significant decrease in polysome association without a concomitant decrease in steady-state accumulation. The abundant mRNAs that encode the ribosomal proteins behaved in this manner. By contrast, a small group of abiotic and biotic stress-induced mRNAs showed a significant increase in polysome association, without a change in abundance. Evaluation of quantitative features of mRNA sequences demonstrated that a low GC nucleotide content of the 5′-untranslated region provides a selective advantage for translation under hypoxia.
• Conclusions Alterations in transcript abundance and translation contribute to the differential regulation of gene expression in response to oxygen deprivation.
Keywords: Hypoxia, DNA microarray, polysome, translational control, mRNA sequence features, Arabidopsis thaliana
INTRODUCTION
Plant cells experience a deficit in cellular oxygen as a consequence of soil compaction, flooding and waterlogging, aerobic soil microbe blooms, high rates of cellular metabolism or low levels of oxygen diffusion to internal tissues (Drew, 1997; Geigenberger, 2003). A reduction in oxygen availability limits the production of ATP through mitochondrial respiration and cells predominantly produce ATP and regenerate NAD+ through the glycolytic and fermentative pathways (Geigenberger, 2003; Fukao and Bailey-Serres, 2004). The response of plant cells can include adjustment in energy-consumption (Koch et al., 2000; Geigenberger, 2003; Fukao and Bailey-Serres, 2004) as well as intricate regulation of gene expression (Fennoy and Bailey-Serres, 1995; Dolferus et al., 2003). The regulation of gene expression in response to oxygen deprivation has been elucidated in model plants such as maize (Zea mays) and Arabidopsis thaliana at the levels of transcript synthesis and accumulation (Fennoy and Bailey-Serres, 1995; Fennoy et al., 1998; Klok et al., 2002), intron splicing (Köhler et al., 1996) and protein synthesis and activity (Sachs et al., 1980; Bailey-Serres and Freeling, 1990; Chang et al., 2000; Millar et al., 2004). These studies have demonstrated that gene regulation in response to oxygen deprivation is mediated at both transcriptional and post-transcriptional levels. In addition, studies have identified a number of the anaerobic polypeptides (ANPs) known to be synthesized during low-oxygen stress and involved in the adaptive responses (Sachs et al., 1980, 1996; Chang et al., 2000). The ANPs include enzymes required for sucrose breakdown, glycolysis and fermentation, enzymes involved in aerenchyma formation (Sachs et al., 1996), and plant class 1 haemoglobins (Hunt et al., 2002; Dordas et al., 2003). The implementation of high throughput DNA microarray technology to obtain a more global understanding of the response of arabidopsis to low oxygen-stress consistently identified significant increases in the level of transcripts that encode a number of ANPs (Klok et al., 2002; Paul et al., 2004; Liu et al., 2005; Loreti et al., 2005). Further evaluation of such mRNA profiling studies may provide additional insight into the metabolic and signal transduction pathways that operate under low oxygen conditions of varying severity and duration, in specific organs or developmental stages and when other environmental factors are varied (i.e. availability of carbohydrates and light).
Here, when designing an mRNA profiling experiment to evaluate the oxygen deprivation response in arabidopsis, it was taken into account that that this stress dramatically limits protein synthesis (Lin and Key, 1967; Bailey-Serres and Freeling, 1990; Butler et al., 1990) and can constrain the translation of constitutively transcribed mRNAs (Fennoy and Bailey-Serres, 1995; Fennoy et al., 1997). Protein synthesis is an extremely energy consuming step in the gene expression pathway. ATP is hydrolysed during the scanning by the 43 S–pre-initiation complex of the 5′-untranslated region (UTR) and GTP is hydrolysed in the completion of the initiation process, charging of tRNAs and translocation of the ribosome from codon to codon (Browne and Proud, 2002; Preiss and Hentze, 2003; Gebauer and Hentze, 2004). The process of protein synthesis is regulated primarily during the initiation phase. There is evidence that a subset of cellular mRNAs can circumvent the global repression of translational initiation during environmental stress conditions such as hypoxia and anoxia (reviewed by Bailey-Serres, 1999; Kawaguchi and Bailey-Serres, 2002). The mechanisms that underlie differential initiation of mRNA translation are not well understood, but are likely to involve mRNA sequence features as well as changes in the quantity or phosphorylation status of translation factors. For example, the maintenance of translation of a uidA (GUS) gene under hypoxia (5 % oxygen) was conferred by sequences of the 5′-UTR and first 18 codons of the open reading frame (ORF) and 3′-UTR of alcohol dehydrogenase 1 (Adh1) mRNA in maize protoplasts (Bailey-Serres and Dawe, 1996). In addition, a number of post-translational modifications of the translational machinery were observed in response to oxygen deprivation in seedling roots of maize (Szick-Miranda et al., 2003). Based on this knowledge it was reasoned that a more accurate indicator of altered gene expression in response to low oxygen stress would be the observed changes in mRNA association with large polysomes, although altered regulation of protein turnover might also be a control mechanism in the low oxygen response.
DNA microarray analyses of the water deficit response in arabidopsis (Kawaguchi et al., 2004), the heat shock response, recovery from cell-cycle arrest and response to the mating pheromone in yeast (Saccharomyces cerevisiae) (Preiss et al., 2003; Serikawa et al., 2003; MacKay et al., 2004) and the hypoxia response of human HeLa cells (Blais et al., 2004) have verified the importance of translational control as an adaptive mechanism. These analyses examined the correlation between steady-state and polyribosome (polysome)-bound mRNA accumulation or compared mRNA levels in non-polysomal and polysomal complexes. Each of these reports provides evidence of variation in the regulation of the translation of individual mRNAs. Together, these DNA microarray studies have shown that (a) mRNAs differ in their level of association with translational complexes under distinct physiological conditions, (b) a sub-set of stress-induced mRNAs maintain association with polysomes despite global reduction in protein synthesis, and (c) alteration of gene expression may occur as a result of translational regulation in the absence of an adjustment in mRNA abundance.
The aim of the present study was to evaluate the contribution of translational control to gene regulation in the oxygen deprivation response of arabidopsis. Stress treatments were performed on 7-d-old seedlings under low light conditions, shown to activate an RHO of plants (ROP) GTPase signal transduction cascade that leads to an elevation in hydrogen peroxide, concomitant with the induction of ADH1 (Baxter-Burrell et al., 2002). The stress treatment was performed in a 0·002 % oxygen environment. Due to photosynthesis in aerial tissues during the treatment, the condition may be more accurately described as hypoxia than anoxia. Following 12 h hypoxia stress (HS) and mock (non-stress, NS) treatments, RNA was isolated from large polysome complexes (≥ five ribosomes per mRNA) as well as from the total cellular extract and hybridized to a DNA microarray platform representing approx. 22 000 arabidopsis genes. Genomic resources were used to identify genes with similar translational regulation. The identification of mRNAs regulated in a similar manner provided an opportunity to investigate whether intrinsic features of transcripts (5′-UTR length, nucleotide content and potential hairpin formation, as well as the ORF and 3′-UTR length) contribute to the mechanism of differential translation.
MATERIALS AND METHODS
Plant material, growth conditions and stress treatment
Seeds of Arabidopsis thaliana, ecotype Landsberg erecta, were surface sterilized [5 min 95 % (v/v) ethanol followed by 10 min in 20 % (v/v) bleach with 0·1 % (v/v) Tween-20], rinsed and allowed to imbibe at 4 °C. After 3 d, seeds were transferred to plates with solid MS media [0·43 % (w/v) MS salts (Sigma, St Louis, MO, USA), 0·4 % (w/v) Phytagel (Sigma), 1 % (w/v) sucrose, pH 5·7], and placed in a growth room at 2100 h in vertical orientation under long-day conditions [16 h light (approx. 45 µm m−2 s−1)/8 h dark] at 20 °C. For stress treatments, after 7 d of growth, plates were placed vertically in sealed Lucite chambers where 99·998 % (v/v) argon gas was pumped in and allowed to escape under positive pressure, as described in Baxter-Burrell et al. (2003). Oxygen deprivation (hypoxia stress, HS) was carried out under dim light (0·22 µm s−1 m−2) at room temperature (23–26 °C). Plates used for NS treatments were maintained under the same light and temperature conditions, but in chambers that were open to air. Stress treatments were commenced after 16 h of photosynthesis. After 12 h, seedlings were carefully removed from the plates and placed in liquid N2, pulverized, and stored at −80 °C.
Isolation of total and polysomal RNA
Approximately 30 g of HS-treated and 15 g of NS-treated tissue (corresponding to 30 and 15 Petri dishes containing approx. 100 seedlings, respectively) was hydrated at 4 °C in two volumes of polysome extraction buffer (PEB) [200 mM TRIS–HCl (pH 9·0), 200 mm KCl, 25 mm EGTA, 35 mm MgCl2, 1 % (w/v) Brij-35, 1 % (v/v) Triton X-100, 1 % (v/v) Tween-20, 1 % (v/v) Igepal CA – 630, 1 % (w/v) deoxycholic acid, 2 % (v/v) polyethylene-10-tridecyl ether, 0·5 mg mL−1 heparin, 5 mm dithiothreitol (DTT), 50 µg mL−1 cycloheximide, 50 µg mL−1 chloramphenicol] (Kawaguchi et al., 2004) homogenized and cleared by centrifugation (7740 g, 4 °C, 20 min). The supernatant was layered over a 1·75 m sucrose cushion [400 mm TRIS–HCl (pH 9·0), 200 mM KCl, 30 mM MgCl2, 1·75 m sucrose, 5 mm DTT, 50 µg mL−1 chloramphenicol, 50 µg mL−1 cycloheximide], and centrifuged at 257 000 g, at 4 °C for 3 h (modified from Fennoy and Bailey-Serres, 1995). The ribosome pellet (257 000 g) was washed with sterile water and resuspended in 700 µL PEB lacking heparin and detergents. The sample was layered onto a 20–60 % (w/v) sucrose density gradient, centrifuged (304 000 g, 90 min at 4 °C) and fractionated exactly as described previously (Kawaguchi et al., 2003, 2004). Thirteen fractions of approx. 400 µL were obtained by using a gradient fractionator connected to a UA-5 detector (ISCO, Lincoln, NE, USA). RNA was precipitated from individual or combined fractions [i.e. fractions 10–13 containing large polysomes (≥ five ribosomes per mRNA), large polysome RNA sample], by addition of 2·5 vol of 8 m guanidine chloride and 3·5 vol of 99 % (v/v) ethanol, recovered by centrifugation (Kawaguchi et al., 2004), re-precipitated with ethanol, and resuspended in RNase-free water. Total RNA was extracted from 100 mg of tissue by use of Qiagen Plant RNeasy mini kit (Qiagen, Valencia, CA, USA) according to the manufacturer's protocol (for DNA microarray samples), or by extraction in PEB and precipitation by addition of 2·5 vol of 8 m guanidine chloride and 3·5 vol of 99 % (v/v) ethanol. RNA quality and quantity were evaluated as described previously (Kawaguchi et al., 2004).
Reverse transcriptase polymerase chain reaction (RT–PCR)
Total, large polysome and sucrose gradient-fractionated polysomal and non-polysomal RNA samples were isolated from three biological replicate samples for analysis by semi-quantitative RT–PCR. cDNA synthesis was performed by use of standard procedures with Superscript™ II Reverse Transcriptase (Invitrogen Life Technologies, Carlsbad, CA, USA) in a 20-µL reaction (Kawaguchi et al., 2004) with 2 µg of total or large polysome RNA, or an equal proportion sample from each gradient fraction. Semi-quantitative PCR was performed with 1 µL of cDNA sample and gene-specific oligonucleotides primer pairs at 1 µm final concentration. The number of cycles and annealing temperature used for each primer pair is indicated in Table 1.
Table 1.
Oligonucleotide primer pair and conditions used for RT–PCR
| AGI ID |
Gene name |
Primer sequence (5′ to 3′) |
Ta (°C) |
No. of cycles* |
Amplicon size (bp) |
||
|---|---|---|---|---|---|---|---|
| At1g77120 | Alcohol dehydrogenase 1 (ADH1) | Forward | ATGATGCCCCGAGAGCAG | 50 | 25 or 30 | 660 | |
| Reverse | GGATGCAAGGATTGATCCTC | ||||||
| At3g18780 | Actin 2 | Forward | ATGATGCCCCGAGAGCAGTG | 53 | 25 or 30 | 974 | |
| Reverse | GGATGCAAGGATTGATCCTC | ||||||
| At5g07100 | WRKY transcription factor | Forward | CGTCTCCTACGACAGGCACATTTCC | 53 | 25 | 403 | |
| Reverse | GCTATAGCGGTGGAAGATGATCGC | ||||||
| At3g02040 | Unknown protein | Forward | GGCTGCCCAATCATATTCCACGAC | 52 | 25 | 446 | |
| Reverse | GTCAAGAAGAATACGGGGTAGGTG | ||||||
| At2g05510 | Unknown, glycine rich protein | Forward | GTGGTCTCCGAAGTTTCTGCCG | 52 | 25 | 319 | |
| Reverse | CACCCGGTTTCGTCTGAACAGG | ||||||
| At3g20470 | Unknown, glycine rich protein | Forward | GCCTTACTTGTCGGCTCTTTTGC | 54 | 25 | 450† | |
| Reverse | CCAAACCCTCCACCTGAACCACC | ||||||
| At4g33070 | Pyruvate decarboxylase 1 (PDC1) | Forward | CCTTTTTCTCTAGCTCCAAG | 50 | 25 or 30 | 109 | |
| Reverse | GACCACGAACCATAACTG | ||||||
| At1g09090 | Respiratory burst oxidase homologue B (RBOHB) | Forward | GAATGGTACCACAAGACG | 50 | 30 | 116 | |
| Reverse | CTTCAAAACCTTGACAGC | ||||||
| At5g13080 | WRKY transcription factor 75 | Forward | GTCGTTGTATGCTCCTTTTTT | 53 | 30 | 407 | |
| Reverse | CATTTGAGTGAGAATATGCTC | ||||||
Ta, Annealing temperature used in reaction.
Two values for number of cycles correspond to optimized values used for total and large polysomal RNA (smaller value), and polysome fraction samples (larger value).
Primer pair that does not span an intron.
DNA oligonucleotide microarray hybridization analysis of polysomal mRNA levels and change in mRNA abundance
Total and large polysome RNA samples from one biological replicate were used for the DNA oligonucleotide hybridization analysis. cRNA synthesis and hybridization to Arabidopsis GeneChip® arrays (Arabidopsis ATH1 Genome Array, Affymetrix, Santa Clara, CA, USA) (Redman et al., 2004) were performed at the University of California, Irvine, DNA Array Core Facility. Hybridizations were performed exactly as described by Kawaguchi et al. (2004). Briefly, double-stranded cDNA was synthesized and used as a template to generate biotin-labelled cRNA. Ten micrograms of fragmented cRNA (35–200 nt) were used in each hybridization reaction at 45 °C with rotation for 16 h. After washes and staining with streptavidin–phycoerythrin, arrays were scanned to detect fluorescence intensity (signal), according to the manufacturer's protocols. The analysis of mRNA levels for individual genes was performed with Affymetrix Microarray Suite (MAS 5·0) analysis software as described previously (Kawaguchi et al., 2004) and detailed in the Affymetrix GeneChip®Expression Analysis Technical Manual (Data Analysis Fundamentals, Affymetrix). The analysis included background signal correction, normalization of signal values between arrays by globally scaling overall hybridization intensity, and estimation of the significance of differences in intensity between perfect-matched and miss-matched probes, based on the One-Step Tukey's Biweight Estimate. Microarray hybridization detection call (present or absent) and expression intensity data (signal) were used to select genes for further analysis and quantify changes in total mRNA abundance, large polysome mRNA abundance and mRNA association with large polysomes [polysome loading (PL)]. Genes (oligonucleotides probe pair sets) with a signal intensity that measured above background (‘present’) for NS and HS treatments were used for this analysis. The change in total mRNA abundance in response to HS was obtained by calculation of the Signal log2 Ratio (SLR) of each gene signal in the NS relative to the HS RNA samples, with the HS value used as the numerator.
The proportion of mRNA in large polysomal complexes (PL) was defined as the fraction of RNA present in the cell that is associated with ≥ five ribosomes. This value was determined from the ratio of the signal in the large polysome RNA sample over the signal for the total RNA sample for each gene, for the same treatment. Due to the required use of an equal cRNA quantity in each DNA microarray hybridization reaction, in spite of the unequal proportion of RNA in the large polysome fraction under the two conditions, it was necessary to normalize the signal values obtained for Large Polysome RNA. Normalization factors were determined from the relative proportion of large polysomes present under the two experimental conditions as estimated from the absorbance profile of the sucrose density gradient fractionated samples (Kawaguchi et al., 2003, 2004). Large polysomes, in the sample used for the hybridization, accounted for 54·78 % and 32·54 % of the total absorbance under NS and HS conditions, respectively (eqns 1 and 2). The normalized PL (nPL) value for each gene was determined as described in eqns 1 and 2. The percentage of an individual mRNA species in large polysomes was calculated as, 2nPL × 100%.
Normalized PL under NS:
 |
Normalized PL under HS:
 |
The change in large polysome mRNA abundance for each gene was calculated in the same manner as the change in total mRNA abundance, but by use of the log2-transformed signal obtained from the large polysome RNA sample, necessitating use of the corresponding normalization factors (eqn 3).
 |
The confidence interval of log2 nPL for each gene was approximated by t-distribution. The standard deviation (s.d.) and the two-sample t-tests were calculated as described in Kawaguchi et al. (2004).
To identify groups of genes with a similar change in mRNA abundance and PL, adaptive quality-based clustering of genes was performed by use of the webtool available at http://intra.psb.ugent.be:8080/PlantCARE/ (De Smet et al., 2002). The clustering analysis was based on a table containing the normalized log2 ratios for change in total mRNA, change in large polysome mRNA, nPLNS and nPLHS values, and performed for a minimum of ten genes per cluster, with 95 % confidence.
Effect of mRNA features on transcript association with large polysomes
A database of 5′-UTR, ORF and 3′-UTR sequences of arabidopsis genes was generated by use of The Institute of Genomic Research (TIGR) arabidopsis cDNA sequences (04/17/03 release, 28 581 cDNAs, http://www.tigr.org/tdb/e2k1/ath1/) and The Institute of Physical and Chemical Research (RIKEN) arabidopsis full-length (RAFL) cDNA database (03/12/03 release, 13 181 cDNAs, http://pfgweb.gsc.riken.go.jp/pub_data/index.html) as described previously (Kawaguchi and Bailey-Serres, 2005; http://bioinfo.ucr.edu/projects/arab_ribosome/search.php). The database included 4151 5′-UTRs from cDNAs prepared by affinity purification of 5′-7mGppp-capped mRNA (Seki et al., 2002) that were identical in length to 5′-UTRs of cDNAs in the TIGR collection. The database also included the coding sequences and 3′-UTRs of 15 133 cDNAs, mono-nucleotide and di-nucleotide composition of the 5′- and 3′-UTRs and the predicted RNA free energy (ΔG kcal mol−1) for each 5′- and 3′-UTR (Zuker, 1989) at the plant growth temperature of 22 °C. mRNAs detected in the GeneChip hybridizations were analysed for their association with large polysomes in relation to features of the 5′-UTR, 3′-UTR and ORF (length, nucleotide composition and ΔG). The average nPLNS and nPLHS of each class were compared with the average nPL in the whole data set under each condition. The difference between the means was compared by one-way analysis of variance (ANOVA) followed by Tukey tests with 95 % simultaneous confidence intervals.
The DNA microarray hybridization data from this study have been deposited in the National Center for Biotechnology Information Gene Expression Omnibus (GEO, http://www.ncbi.nlm.nih.gov/geo/) and accessible through GEO series accession number GSE2218 (http://www.ncbi.nlm.nih.gov/geo/query/acc.cgi?acc=GSE2218).
RESULTS AND DISCUSSION
Demonstration of translational regulation in arabidopsis seedlings in response to HS
To examine the effect of oxygen deprivation on mRNA translation in arabidopsis, plates with 7-d-old Landsberg erecta seedlings were transferred to an open chamber (NS) or an argon-sparged chamber in dim light for 12 h (hypoxia stress, HS). Whole seedlings were used to prepare detergent-treated cell extracts that were centrifuged to obtain a ribosome/polysome pellet (170 k g) that was further fractioned over 20–60 % (w/v) sucrose density gradients to determine the levels of 80 S monosomes, small polysome complexes (two to four ribosomes per mRNA) and large polysome complexes (≥ five ribosomes per mRNA) (Fig. 1). The calculation of the peak areas of the absorbance profiles revealed that approx. 59 % of the ribosomes were in large polysomes under NS conditions. As a consequence of HS the level of large polysome complexes decreased in abundance by over 2-fold, to 23 %, resulting in an increase in the ratio of small polysomes to large polysomes and an increase in the level of monosomes (Table 2). This decrease in polysomes and increase in 80 S monosomes is indicative of a reduction in initiation of protein synthesis in response to HS, as reported previously for several other plant species (Lin and Key, 1967; Bailey-Serres and Freeling, 1990; Butler et al., 1990).
Fig. 1.
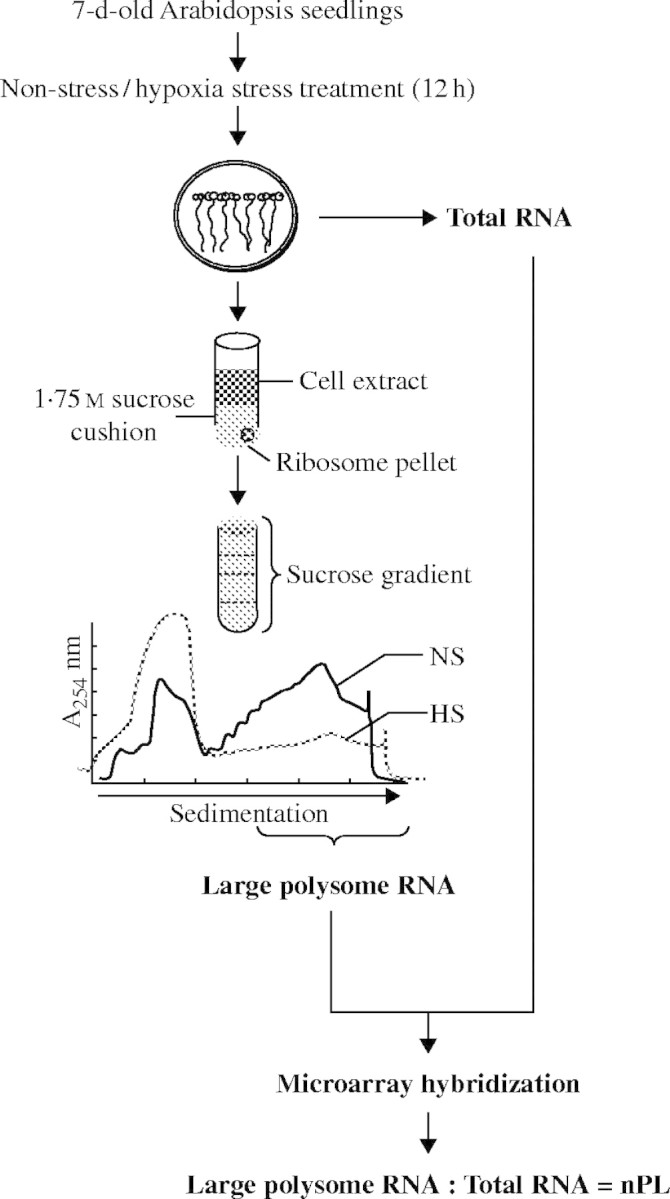
Experimental strategy for evaluation of translational regulation in response to HS. Seven-day-old seedlings grown on MS medium in vertically oriented plates were subjected to 12 h of NS or HS treatment. Seedling tissues were harvested and used for isolation of total cellular RNA (Total RNA) and RNA in large polysome complexes (≥ five ribosomes per mRNA; Large Polysome RNA) and hybridization against Affymetrix (ATH1) GeneChip microarrays. A representative absorbance profile of ribosomes fractionated in a 20 to 60 % (w/v) sucrose density gradient is shown for the NS (black line) and HS (grey line) samples. Fractions from the lower density region of the gradient include ribosomal subunits, 80 S monosomes and mRNP complexes, whereas the higher density fractions contain mRNAs in polysome complexes of increasing mass. The normalized ratio of large polysomal RNA to Total RNA abundance was used to estimate the proportion of individual mRNAs in large polysomes (polysome loading, nPL) and is expressed as a percentage (see Materials and methods for details).
Table 2.
Comparison of monosome, small and large polysome levels in seedlings under NS and HS conditions
| Treatment |
Monosomes (% of total)* |
Small polysomes (% of total) |
Large polysomes (% of total) |
Ratio of small to large polysomes |
|---|---|---|---|---|
| NS | 23·28 ± 4·14 | 14·38 ± 1·90 | 59·41 ± 3·18 | 1 : 4·2 |
| HS | 56·79 ± 6·63* | 10·72 ± 2·33 | 23·16 ± 6·59* | 1 : 2·1* |
Monosome (80 S), small and large polysomes were quantified as the percentage of total ribosomes.
Values are percentages ± standard deviation (n ≥ 3) from independent biological replicate experiments.
Statistical significance was analysed using two sample t-tests (*, P ≤ 0·05).
To evaluate whether HS results in differential translation of mRNAs in arabidopsis seedlings, as observed in seedling roots and cultured cells of maize (Fennoy and Bailey-Serres, 1995; Bailey-Serres and Dawe, 1996; Fennoy et al., 1998), the proportion of individual mRNA species in large polysome complexes under NS and HS conditions was determined by use of a full-genome oligonucleotide DNA microarray (Affymetrix Arabidopsis ATH1 array). The RNA in large polysomes was obtained by pooling the sucrose gradient fractions that contained ≥ five ribosomes per mRNA. Total cellular RNA was prepared from the same biological replicate samples (Fig. 1). These RNA preparations were used for identification of over 11 000 genes (oligonucleotide probe pair sets) with signal intensity above background (present) under NS and HS conditions in both mRNA populations (see Materials and methods). The hybridization results were used to identify genes with a significant change in the signal log ratio of steady-state and polysomal transcripts under the two conditions (supplementary Table 1; all supplementary material is available at http://www.aob.oxfordjournals.org). Differential mRNA translation was evident by the variation in concordance of these two measurements for individual gene transcripts (R2 = 0·686) (Fig. 2A). Of the 197 genes with a ≥3-fold increase in steady-state transcript abundance, slightly less than one-half of the genes (85 genes) also showed a significant increase in mRNA in large polysomes. By contrast, of the 177 genes with a ≤0·3-fold decrease in transcript abundance, 162 showed a concomitant decrease in abundance in large polysomes (Fig. 2B). The hybridization data also showed a significant decrease in large polysome mRNA level for over 70 % of the transcripts detected (8236 genes), without a concomitant decrease in mRNA abundance. Together, these results indicate that both change in transcript abundance and translation are important in the response to HS.
Fig. 2.
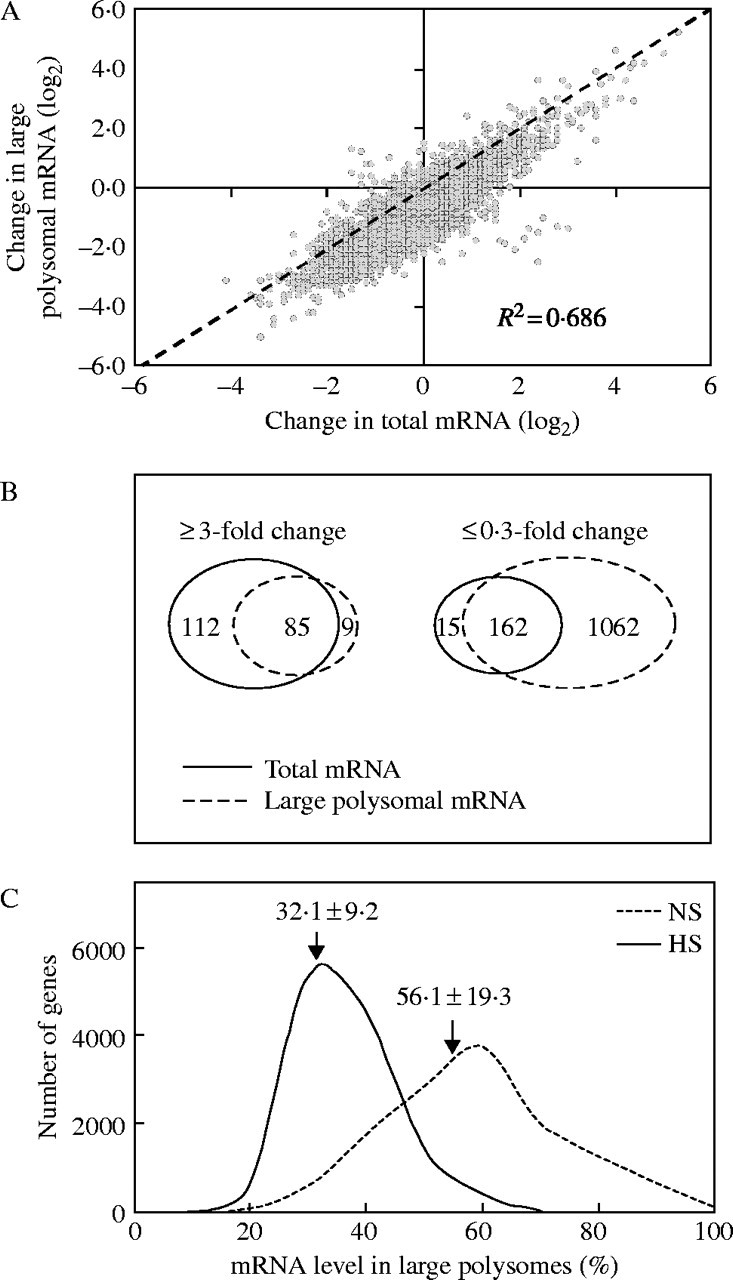
HS alters the mRNA polysome loading status of individual mRNAs. (A) Change in total and large polysomal mRNA determined for genes (probe pair sets) detected by hybridization to Affymetrix (ATH1) microarrays. Change in total RNA abundance (signal log ratio of HS versus NS total mRNA level) versus change in large polysomal RNA abundance (signal log ratio of HS versus NS large polysomal mRNA level) was plotted. The diagonal dotted line indicates no change in the relative level of total and polysomal mRNAs. R2 represents the correlation between the log2 mRNA abundance values in the two data sets. (B) Comparison between gene transcripts with an extreme change in abundance (≥3-fold and ≤0·3-fold) in total mRNA and large polysome mRNA samples in response to HS. Venn diagrams show the number of genes and the overlap between the two RNA populations. (C) Gene frequency distribution of the percentage of individual mRNA transcripts in large polysome complexes. The proportion of individual mRNA transcripts in large polysomes was determined from the estimation of mRNA levels in the large polysome and total RNA fractions for genes with transcript levels above background in the NS (n = 12 550) and HS (n = 13 712) samples in the total and large polysomal mRNA fraction under the treatment conditions (See Materials and methods for equations used for this determination). Arrows indicate the average nPL value under each condition. The 24 % decrease in nPL in response to the stress was significant for P < 0·001 (two sample t-test).
To determine the relative level of each mRNA in large polysomal complexes under the two conditions, the signal log ratio of the normalized large polysome RNA level to the total RNA level for each probe pair set was calculated as described in the Materials and methods (supplementary Table 1). This value, termed normalized polysome loading (nPL), ranged for individual transcripts under both conditions, from <5 % to >95 % (Fig. 2C). The range in nPL values indicated diversity in the recruitment or maintenance of ribosomes on individual mRNAs under both conditions. The average nPL value was 56·1 % under the NS conditions. This value was lower than the average amount of mRNA detected in all polysomes (≥ two ribosomes per mRNA) in leaves of arabidopsis (82 %) (Kawaguchi et al., 2004) and rapidly dividing yeast cells (71 %) (Arava et al., 2003). The average nPL value fell to 32·1 % in response to 12 h HS, consistent with the significant reduction in large polysomes observed by sucrose gradient absorbance profile analysis (Fig. 1 and Table 2). The data clearly demonstrate that HS promotes a reduction in the number of ribosomes per mRNA for a large number of mRNA species. A similar DNA microarray study revealed that dehydration stress also alters the translation of individual mRNAs in leaves of arabidopsis (Kawaguchi et al., 2004).
Confirmation of differential accumulation and association of mRNAs with polysomes under NS and HS conditions
The results of the DNA microarray analysis were further evaluated for nine genes by semi-quantitative RT–PCR in biological replicate samples. The selected genes represented mRNAs with varying change in total and large polysomal mRNA levels under NS and HS conditions. The ribosome pellet fraction (170 k g) was fractionated by centrifugation through a 20–60 % (w/v) sucrose gradient. For evaluation of mRNA distribution throughout the sucrose gradient, an equal proportion of each of the 13 gradient fractions was analysed. RT–PCR analyses with gene-specific primers on these RNA samples supported the microarray data (Fig. 3). Increases in steady-state and large polysomal mRNA levels in response to HS were detected for ADH1, pyruvate decarboxylase 1 (PDC1), respiratory burst oxidase homologue B (RBOHB), WRKY 75 transcription factor and a protein of unknown function (At3g02040). The increase in steady-state abundance of the mRNAs that encode a RBOHB, WRKY transcription factor (At5g07100), and a protein of unknown function (At3g02040), coincided with increased association of the transcript with large polysomes (Fig. 3). Two glycine-rich proteins of unknown function showed a decrease in steady-state accumulation in response to the stress but an increase in the level of the transcript in the large polysome fractions. Despite its recognition as an ANP, the strongly induced ADH1 transcript was modestly impaired in translation under HS, as visualized by the increased level of this message in the non-polysomal fractions and decrease in nPL (Table 3). In maize seedling roots, the association of ADH1 and ADH2 mRNA with polysomes was maintained under HS despite a global reduction in translation (Fennoy and Bailey-Serres, 1995; Fennoy et al. 1998). These results provide strong evidence of different translational efficiencies of individual mRNAs under the two conditions examined.
Fig. 3.

Verification of microarray determination that the abundance and distribution of mRNAs in polysome complexes are altered in response to HS. Semi-quantitative reverse transcriptase polymerase chain reactions (RT–PCR) were performed on 2 µg of total RNA and large polysomal RNA from NS and HS seedlings. Polysomes in the 170 k g pellet fraction were separated on 20–60 % (w/v) sucrose gradients into 13 fractions of equal volume. A proportional volume from each fraction was used in an RT–PCR reaction. Nine genes with a range of fold change in total (0·4- to 14·9-fold) and large polysomal (0·7- to 13·9-fold) abundance in response to HS were examined. Results are representative of three independent biological replicate experiments.
Table 3.
Comparison of microarray determination of fold change in transcript accumulation in seedlings and root cultures subjected to oxygen deprivation
| Fold change in total mRNA abundance |
|||||||||||
|---|---|---|---|---|---|---|---|---|---|---|---|
| Gene |
Description |
Seedlings 12 h hypoxia in light† |
Seedlings 12 h 3% oxygen in light‡ |
Cultured roots 4 h 5% oxygen‡ |
Cultured roots 20 h 5% oxygen§ |
Seedlings 6 h anoxia in dark# |
Change in nPLSeedlings 12 h hypoxia in light† |
||||
| At5g12030 | Heat shock protein 17·6A | 32·00 | 6·73 | 0·76 | |||||||
| At3g46230 | Heat shock protein 17 | 24·25 | 10·56 | 0·87 | |||||||
| At1g17180 | Putative glutathione transferase | 19·70 | 0·49 | 3·73 | 0·71 | ||||||
| At5g59820 | Zinc finger protein (ZAT12) | 18·38 | 2·95 | 1·96 | 7·46 | 0·71 | |||||
| At4g10270 | Wound-induced protein | 17·15 | 14·91 | 27·86 | 0·50** | ||||||
| At1g53540 | 17·6 kDa heat shock protein | 16·00 | 5·28 | 1·75* | |||||||
| At4g33070 | Pyruvate decarboxylase-1 (PDC1) | 14·93 | 14·60 | 5·00 | 5·85 | 128·00 | 0·87 | ||||
| At3g43190 | Sucrose synthase (SUS4) | 13·00 | 8·54 | 9·23 | 5·76 | 42·22 | 1·07 | ||||
| At2g47520 | AP2 domain transcription factor | 12·13 | 9·80 | 50·21 | 1·07 | ||||||
| At4g37370 | Cytochrome p450 family | 12·13 | 4·14 | 0·47** | |||||||
| At3g02550 | Expressed protein | 11·31 | 8·77 | 13·45 | 0·58** | ||||||
| At2g29500 | Putative small heat shock protein | 10·56 | 9·85 | 0·58** | |||||||
| At5g20830 | Sucrose synthase (SUS1) | 9·85 | 4·30 | 5·20 | 7·50 | 25·11 | 0·62** | ||||
| At1g33055 | Expressed protein | 9·19 | 7·46 | 0·62** | |||||||
| At5g66985 | Expressed protein | 9·19 | 26·91 | 0·76* | |||||||
| At1g77120 | Alcohol dehydrogenase 1 (ADH1) | 8·57 | 11·95 | 13·15 | 17·49 | 36·76 | 0·58** | ||||
| At2g41730 | Hypothetical protein | 8·57 | 3·19 | 3·05 | 2·00 | 0·50** | |||||
| At1g43800 | Expressed protein | 8·00 | 13·45 | 0·54** | |||||||
| At1g76600 | Expressed protein | 6·96 | 5·18 | 8·69 | 1·07 | 0·44** | |||||
| At3g23170 | Expressed protein | 6·96 | 4·59 | 0·87 | |||||||
| At4g33560 | Putative protein | 6·96 | 103·97 | 0·58** | |||||||
| At5g05410 | DRE binding protein (DREB2A) | 6·96 | 4·76 | 1·32 | |||||||
| At2g46240 | Hypothetical protein | 6·06 | 5·66 | 0·58** | |||||||
| At5g14730 | Putative protein | 6·06 | 10·33 | 15·53 | 1·32 | 1 | |||||
| At5g42200 | Putative protein. | 6·06 | 4·12 | 3·03 | 0·54** | ||||||
| At5g52640 | Heat-shock protein | 6·06 | 1·07 | 4·59 | 0·54** | ||||||
| At1g14870 | Unknown protein | 5·66 | 3·36 | 0·62** | |||||||
| At1g16030 | Putative heat shock protein hsp70 | 5·66 | 6·96 | 1·07 | |||||||
| At3g13310 | Putative DnaJ protein | 5·66 | 2·40 | 2·38 | 0·71** | ||||||
| At5g51440 | Mitochondrial 22 kd- heat shock protein | 5·66 | 1·16 | 4·76 | 0·35** | ||||||
| At5g17300 | Expressed protein | 5·28 | 1·26 | 3·86 | 0·41** | ||||||
| At1g26270 | Expressed protein | 4·92 | 2·24 | 3·61 | 0·47** | ||||||
| At3g03270 | Expressed protein | 4·92 | 6·64 | 13·00 | 0·54* | ||||||
| At1g03610 | Expressed protein | 4·29 | 2·21 | 3·61 | 0·62** | ||||||
| At3g11930 | Putative ethylene-responsive protein | 4·29 | 1·83 | 3·61 | 0·44** | ||||||
| At4g12400 | Stress-induced protein STI1-like protein | 4·29 | 3·36 | 0·54* | |||||||
| At4g22780 | Translation factor EF1A-like protein | 4·29 | 2·72 | 2·38 | 0·81 | ||||||
| At5g15120 | Putative protein | 4·29 | 4·38 | 9·85 | 0·58** | ||||||
| At5g19550 | Aspartate aminotransferase (ASP2) | 4·29 | 5·02 | 6·96 | 0·50** | ||||||
| At1g20270 | 2-Oxoglutarate-dependent dioxygenase family | 4·00 | 2·47 | 1·19 | 0·54* | ||||||
| At5g48570 | Peptidylprolyl isomerase | 4·00 | 0·95 | 3·86 | 0·66* | ||||||
| At1g74940 | Expressed protein | 3·73 | 2·29 | 2·38 | 0·76 | ||||||
| At4g17260 | Lactate dehydrogenase (LDH1) | 3·73 | 3·13 | 4·05 | 2·48 | 1·23 | 0·76* | ||||
| At4g31020 | Putative protein | 3·73 | 4·76 | 1·62 | 0·76* | ||||||
| At5g27420 | RING-H2 zinc finger protein-like | 3·73 | 3·03 | 0·62** | |||||||
| At5g44730 | dreg-2 like protein | 3·73 | 4·43 | 4·44 | 0·47** | ||||||
| At1g33050 | Unknown protein | 3·48 | 1·24 | 1·74 | 1 | ||||||
| At1g74500 | bHLH protein | 3·48 | 4·59 | 0·58* | |||||||
| At3g12500 | Glycosyl hydrolase family 19 (basic endochitinase) | 3·48 | 2·06 | 2·64 | 1·75** | ||||||
| At1g55810 | Putative uracil phosphoribosyltransferase | 3·25 | 1·55 | 3·61 | 0·76* | ||||||
| At2g15890 | Expressed protein | 3·25 | 1·76 | 1·80 | 0·81* | ||||||
| At2g38470 | WRKY family transcription factor | 3·25 | 3·36 | 0·58* | |||||||
| At3g09350 | Expressed protein | 3·25 | 1·06 | 3·14 | 0·66** | ||||||
| At3g28480 | 2-Oxoglutarate-dependent dioxygenase family | 3·25 | 2·51 | 2·73 | 0·50** | ||||||
| At4g17670 | Expressed protein. | 3·25 | 3·18 | 7·21 | 0·76 | ||||||
| At4g32840 | Putative pyrophosphate–fructose-6-phosphate 1-phosphotransferase | 3·25 | 1·27 | 5·66 | 0·58** | ||||||
| At4g33950 | Protein kinase—like protein | 3·25 | 1·53 | 2·73 | 0·71** | ||||||
| At5g07580 | Transcription factor-like protein; ethylene responsive element binding factor 5 | 3·25 | 1·41 | 1·57 | 0·66* | ||||||
| At5g47910 | Respiratory burst oxidase protein D (RBOHD) | 3·25 | 2·24 | 4·65 | 0·73 | 7·21 | 0·94 | ||||
| At1g03220 | Unknown protein | 3·03 | 1·43 | 2·00 | 0·66** | ||||||
| At1g19530 | Expressed protein | 3·03 | 2·42 | 1·57 | 1·23* | ||||||
| At1g66880 | Putative protein kinase | 3·03 | 1·51 | 17·15 | 0·38* | ||||||
| At2g36950 | Expressed protein | 3·03 | 1·23 | 2·55 | 0·87 | ||||||
Genes with a significant increase in mRNA abundance in 7 d-old seedlings in response to 12 h stress, as measured by use of ATH1 GeneChips and that also showed a significant increase in mRNA accumulation in one or more of the following systems.
Seedlings (13 d old) grown in liquid medium in response to 12 h of 3 % oxygen and measured by use of a microarray with 3′-end probes of 26 777 genes (Liu et al., 2005).
Cultured hairy roots in response to 4 h or 20 h of 5 % oxygen in the dark as measured by use of a DNA microarray of 1000 cDNAs of genes induced by 5 % hypoxia and 2500 cDNAs of genes involved in developmental and metabolic processes (Klok et al., 2002).
Seedlings (4 d old) grown in liquid medium in response to 6 h of anoxia in total darkness as measured with ATH1 GeneChips (Loreti et al., 2005).
Change in nPL is shown and significance of change in nPL estimated by Student's t-test (**P < 0·001, *P < 0·05).
Identification of genes with similar regulation in transcript abundance and translation
The nPL values for individual genes was plotted to visualize the range and variation in nPL under the two conditions (Fig. 4). In these graphs, the dashed line indicates no change in nPL. Of the genes that plotted below this line, 8718 showed a significant decrease in nPL and of the genes that plotted above this line, 113 showed a significant increase in nPL (Fig. 5). To further evaluate the relationship between change in mRNA abundance and translational status, mRNAs with a ≥3-fold increase in abundance in response to HS were identified (Fig. 4A, closed symbols) (supplementary Table 2). Of the 197 stress-induced mRNAs, six showed an increase and 54 showed a maintenance of nPL (Fig. 5). These stress-induced mRNAs included a number that were reported to increase significantly in response to oxygen deprivation (HS and anoxia) in arabidopsis in other studies that used the same or different DNA microarray platforms (Klok et al., 2002; Liu et al., 2005; Loreti et al., 2005) (Table 3). As shown in Fig. 3B, few of these mRNAs showed an increase in nPL and several showed a significant decrease in nPL in response to HS (Table 3). This indicates that the fold-increase in mRNA measured in response to HS may not be a reliable indicator of the actual change in gene expression due to differences in the recruitment of individual mRNAs to polysomes. The comparative analysis of four DNA microarray experiments identified genes that were consistently induced in these studies. Not unexpectedly, these included the ANPs (ADH1, SUS1, SUS4, PDC1 and LDH1) critical to fermentative metabolism. The up-regulated transcripts also encode heat shock proteins, a number of expressed unknown proteins, a zinc finger transcription factor ZAT12 reportedly involved in the response to oxidative stress (Rizhsky et al., 2004) and a respiratory burst oxidase homologue (RBOHD), possibly involved in the requirement for controlled reactive oxygen species production in signal transduction under low oxygen stress (Baxter-Burrell et al., 2002). Consideration of the change in nPL levels of these genes revealed that many of the significantly induced transcripts have significantly decreased association with large polysomes, although several transcripts encoding transcription factors and heat shock proteins were an exception, with maintained or increased nPL (Table 3).
Fig. 4.
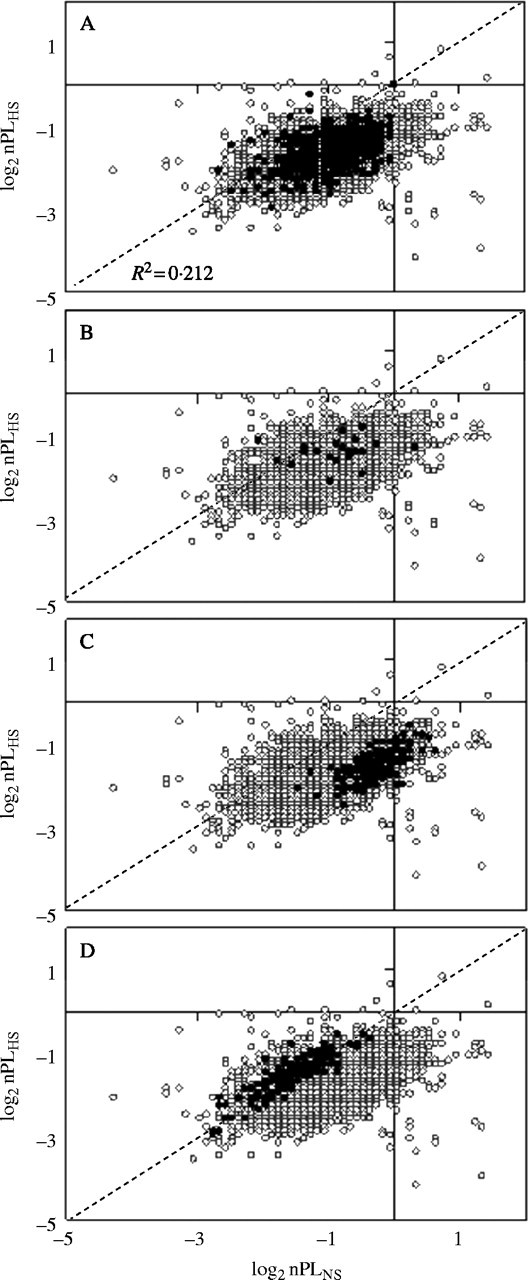
Effect of HS on nPL of genes with similar change in mRNA accumulation. Polysome loading (nPL) was estimated for 11 327 mRNAs detected above background by DNA microarray hybridization in total and large polysomal mRNA under the two treatment conditions (open and filled circles in each panel). The diagonal dashed line indicates no change in nPL value in response to HS. R2 represents the correlation between the log2 nPL values in the two data sets. The four graphs include the same data set. In each panel the genes plotted with a filled circle indicate a similar trend in the change in steady-state mRNA abundance in response to HS: (A) genes with a ≥3-fold increase in mRNA abundance (n = 197); (B) genes with an extreme induction in mRNA abundance after 12 h of HS in 13-d-old seedlings (Liu et al., 2005), 4 h or 20 h of HS in cultured roots of arabidopsis (Klok et al., 2002) or after 6 h of anoxia in 4-d-old seedlings (Loreti et al., 2005) (n = 64; Table 3); (C) genes that encode ribosomal proteins (1·04 ± 0·02-fold change in mRNA abundance) (n = 142); (D) genes with co-ordinate change in mRNA abundance and translation (Cluster 4; 2·9 ± 0·28-fold average change in mRNA abundance) (n = 194).
Fig. 5.
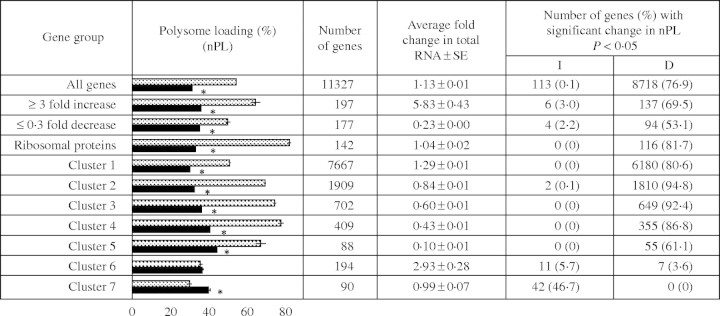
Comparison of groups of genes with similar change in mRNA abundance and nPL in response to HS. Genes were grouped by fold-change in mRNA abundance in response to HS, protein function or by a clustering algorithm that identified genes with similar expression characteristics under the two conditions. The bar graph compares the average percentage of nPL NS (grey bars) and HS (black bars). The table compares the number of genes in each group, the change in total mRNA accumulation for each gene group, and indicates the percentage of genes with a significant increase (I) or decrease (D) in nPL. Differences in nPL values for an individual gene under NS and HS conditions were evaluated by two-sample t-tests (*, P < 0·001). The groups include genes with an extreme increase or decrease in transcript level after HS (≥3-fold or ≤0·3-fold), genes with no change in mRNA abundance that encode ribosomal proteins, and groups of genes obtained by adaptive quality-based clustering.
The present analysis also identified mRNAs with a ≤0·3-fold change in abundance in response to 12 h of HS (supplementary Table 2). Of these, 94 showed a significant decrease and 11 showed an increase in nPL, indicating a general correspondence between accumulation and translation for these mRNAs. The repression of translation of mRNAs in the absence of a change in abundance was evident in this study and in the analysis of the translational response of arabidopsis leaves to dehydration stress (Kawaguchi et al., 2004). Ribosomal protein (RP) mRNA transcript levels were generally not affected by the dehydration stress but their association with polysomes was severely reduced. In non-stressed arabidopsis seedlings, on average 82·6 % of each RP mRNA was present in large polysomes; this value dropped to 33·5 % in response to HS without a marked change in mRNA accumulation (Fig. 5 and supplementary Table 2). Of the 142 RP mRNAs detected, 116 showed a significant reduction in association with large polysomes in response to HS. This co-ordinated translational regulation of RP mRNAs under NS and HS conditions is apparent in the plot presented in Fig. 4C. The reduction in translation of these abundant mRNAs indicates that ribosome biogenesis is down-regulated in response to HS.
Genes with similar regulation in response to 12 h HS were identified by use of the adaptive quality-based clustering method (De Smet et al., 2002) (Fig. 5 and supplementary Table 2). The seven clusters were generally distinguished by the change in mRNA abundance in response to HS as well as nPL values under the two conditions. Clusters 1–3 were the largest groups. These contained mRNAs that showed increased impairment in polysome association under HS. The average fold-change in steady-state mRNA accumulation in these clusters ranged from a slight increase in Cluster 1 (1·27 ± 0·01) to a slight decrease in Cluster 3 (0·64 ± 0·01). Cluster 2 contained the majority of RPs (113 of 142 RP mRNAs detected) as well as many components of the 20S and 26S proteasome complexes. mRNAs in Clusters 5 and 6 showed more severe reductions in steady-state abundance, as well as a significant decrease in nPL. Clusters 4 and 7 were exceptional groups. Based on the average values, Cluster 4 mRNAs were stress-induced and maintained association with large polysomes. Further evaluation of Cluster 4 revealed that these genes had a lower than average level of mRNA in polysomes under NS conditions and included many genes with a significant increase in nPL in response to HS (Figs 4D and 5). By contrast, Cluster 7 gene transcripts were distinguished by increased association with large polysomes and little change in steady-state accumulation in response to HS.
The biological function of proteins encoded by the genes in the seven clusters was also considered (supplementary Fig. 1). Cluster 4 included genes known to be highly induced by HS, including PDC1 (At4g33070), sucrose synthase 1 (SUS1) (At5g20830) and (SUS4) (At3g43190) (Klok et al., 2002; Kursteiner et al., 2003; Baud et al., 2004; Liu et al., 2005; Loreti et al., 2005). This cluster also included PDC2 (At5g54960), a number of genes involved in redox amelioration/regulation (e.g. several glutathione transferases), genes involved in signaling transduction pathways (e.g. calmodulin and protein kinases), transcription factors [WRKY, ethylene response element binding protein (EREBP) family members], heat shock proteins (HSPs), and RBOHB and RBOHD (At1g09090 and At5g47910). Despite the strong induction in ADH1 mRNA abundance, this gene sorted to Cluster 1, most likely because of the decrease in nPL in response to HS (Fig. 3). It was found that Cluster 7 included a large proportion of genes (25·6 %) that are induced by abiotic or biotic stresses (supplementary Fig. 1). This analysis illustrates that genes with similar biological function or role in an adaptive response display a general co-ordination in the regulation of transcript accumulation and/or translation in response to HS.
Correlation between mRNA sequence features and polysome loading
The differential translation of individual mRNAs may be due to the presence of specific sequence features. To investigate whether quantifiable characteristics of mRNA sequences contributed to polysome loading, the length of transcript regions (ORF, 5′-UTR and 3′-UTR), the 5′-UTR mono- and di-nucleotide content, and the 5′-UTR potential were analysed for secondary structure formation. The database of 5′-UTRs (n = 4151, average length of 124·7 nt) used for this analysis was prepared from publicly available full-length cDNAs generated from mRNAs isolated by affinity purification of 5′-7mGppp-capped transcripts and cDNAs that provide ORF and 3′-UTR sequences (n = 15 133, average length of 1268 and 248 nt, respectively) (Kawaguchi and Bailey-Serres, 2005). High nPL values under HS were correlated with a short ORF (400–650 nt), an average 5′- and 3′-UTR length (75–150 nt and 150–250 nt, respectively) and a moderate 5′-UTR GC content (40–50 %) with low potential for secondary structure formation of (more than −20 kcal mol−1 ΔG) (Fig. 6). High A and AU content in the 5′-UTR was favourable under NS conditions and was correlated with increasing nPL under HS (Table 4). By contrast, high G and GC content in the 5′-UTR was inversely correlated with nPL, especially under HS (Table 4 and Fig. 6B).
Fig. 6.
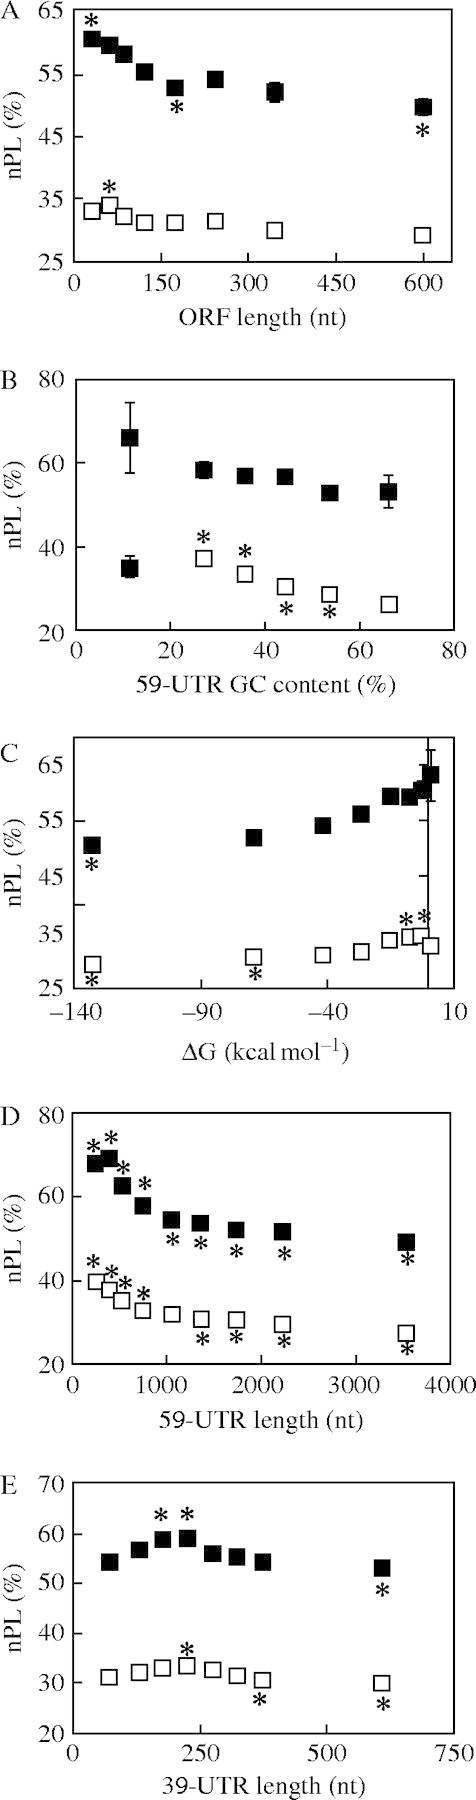
Evaluation of the effect of mRNA features on transcript association with large polysomes. Average nPL was calculated for groups of genes categorized according to different mRNA features: (A) length of the ORF (nt); (B) percentage of GC content in the 5′-UTR; (C) predicted ΔG (kcal mol−1) of the 5′-UTR; (D) length of the 5′-UTR (nt); (E) length of the 3′-UTR (nt). The average ± standard error nPL under NS (black squares) and HS (open squares) for each gene group was plotted against the average value for the mRNA feature of that group. The average nPL of each group was compared with the average nPL of all the genes for which that feature has been determined (length of ORF n = 10 262, nPLNS = 56·98 %, nPLHS = 32·46 %; GC content in 5′-UTR and 5′-UTR length n = 2727, nPLNS = 56·80 %, nPLHS = 32·19 %; predicted ΔG (kcal mol−1) of the 5′-UTR n = 2321, nPLNS = 56·89 %, nPLHS = 32·29 %; 3′-UTR length, n = 9085, nPLNS = 56·98 %, nPLHS = 32·46 %). The significance of the differences between the means was evaluated by one-way ANOVA followed by Tukey tests with 95 % simultaneous confidence intervals (*, P < 0·001).
Table 4.
Pearson correlation between nPL and mRNA features under NS and HS conditions
| 5′-UTR nucleotide content (%) |
NS (R) |
HS (R) |
||
|---|---|---|---|---|
| A | 0·058 | 0·195 | ||
| U | −0·061 | −0·043 | ||
| G | −0·009 | −0·138 | ||
| C | 0·001 | −0·097 | ||
| AU | 0·009 | 0·240 | ||
| AC | 0·066 | 0·147 | ||
| AG | 0·044 | 0·085 | ||
| UC | −0·044 | −0·085 | ||
| UG | −0·066 | −0·147 | ||
| GC | −0·009 | −0·240 | ||
| Other features | ||||
| 5′-UTR length (nt) | −0·130 | −0·100 | ||
| 5′-UTR G (kcal/mol) | 0·132 | 0·132 | ||
| ORF length (nt) | −0·228 | −0·267 | ||
| 3′-UTR length (nt) | −0·071 | −0·076 | ||
Number of genes used: 5′-UTR nucleotide composition and length, n = 2727, ΔG in 5′ UTR, n = 2321; ORF length, n = 10 262; 3′-UTR length, n = 9085.
The analysis of the mRNA features of genes in the same cluster provided additional evidence that quantifiable mRNA features contribute to translational regulation under HS (Fig. 7A). Cluster 7 mRNAs, 46 % of which showed an increase in nPL in response to HS, had a significantly lower average 5′-UTR GC content (31·6 %) and higher than average ΔG (−24·91 kcal mol−1) (Fig. 7B and C). These characteristics would be expected to reduce the amount of ATP hydrolysis required for initiation of translation. As a consequence of the crisis in ATP availability under HS (Geigenberger, 2003), Cluster 7 mRNAs may have a selective advantage in the initiation process. Cluster 7 mRNAs also tended to have a shorter than average ORF, 5′-UTR and 3′-UTR (Fig. 7A, D and E, respectively). Although these mRNAs showed little or no change in steady-state abundance in response to HS (Fig. 5), the enhancement of their translation would be expected to result in increased synthesis of the encoded proteins. Clusters 4, 5 and 6 mRNAs also had a lower than average 5′-UTR GC content and showed less of a reduction in large polysomal mRNA levels under HS. Taken together, these data indicate that qualities of the 5′-UTR, ORF and 3′-UTR contribute to the regulated translation of mRNAs in response to HS.
Fig. 7.
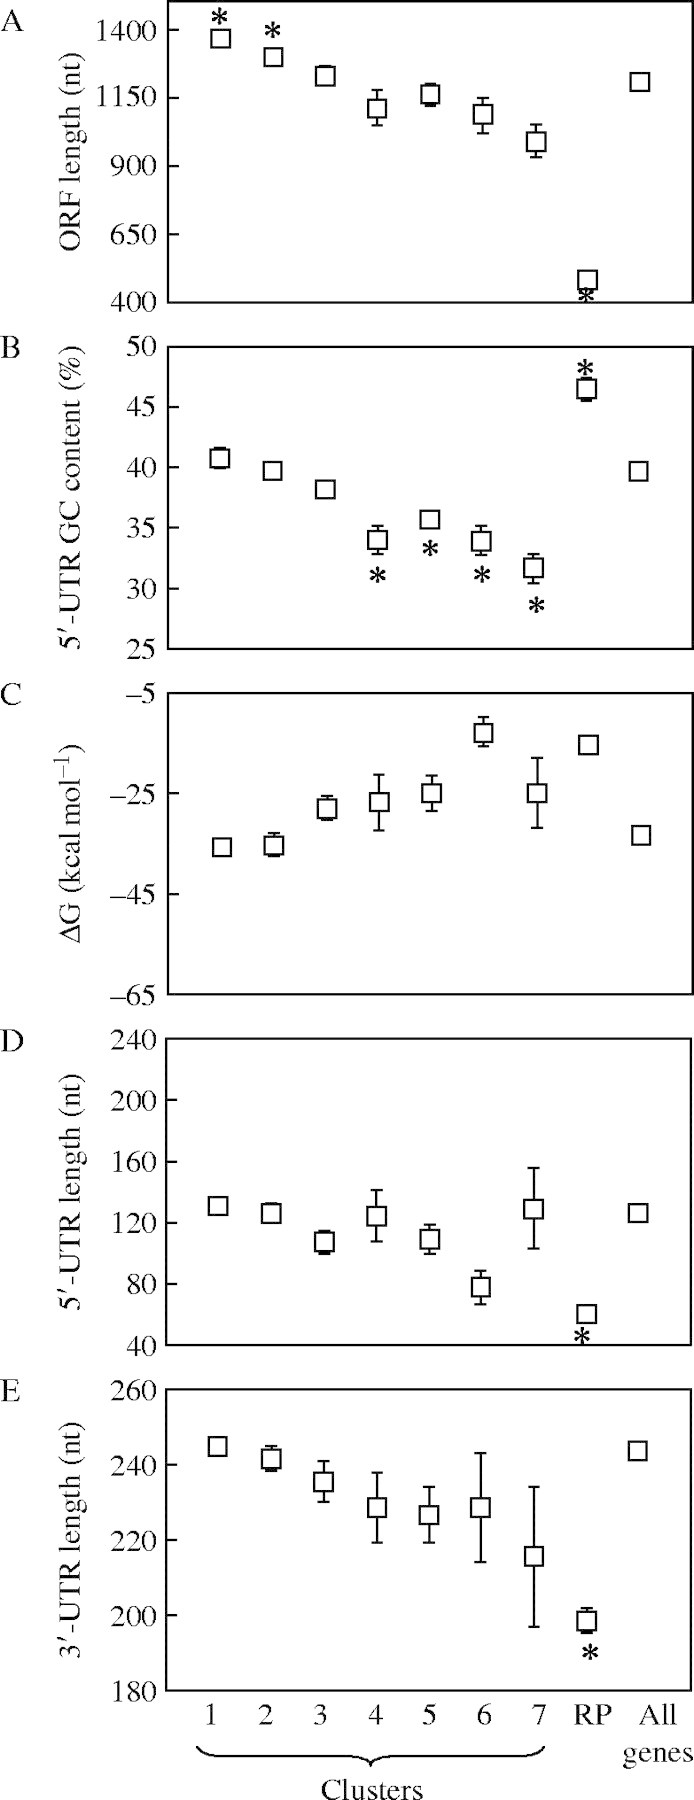
Comparisons of mRNA features between different groups of genes. Average values for each mRNA feature was calculated for groups of genes categorized according to differential mRNA abundance and nPL in response to HS (clusters 1–7 and ribosomal proteins, RP): (A) length of the ORF (nt); (B) percentage of GC content in the 5′-UTR; (C) predicted ΔG (kcal mol−1) of the 5′-UTR; (D) length of the 5′-UTR (nt); (E) length of the 3′-UTR (nt). The average ± standard error for each gene group was plotted and compared with the average corresponding feature of all the genes for which that feature has been determined [length of the ORF n = 10 262, percentage of GC content in the 5′-UTR and length of the 5′-UTR n = 2 727; predicted ΔG (kcal mol−1) of the 5′-UTR n = 2321; 3′-UTR length, n = 9085; number of genes for every other group varies depending on the available mRNA sequence data, and ranges from 13 (Cluster 7) to 1816 (Cluster 1)]. The significance of the differences between the means was evaluated by one-way ANOVA followed by Tukey tests with 95 % simultaneous confidence intervals (*, P < 0·001).
Reduction in ribosomal protein mRNA translation as an energy conserving mechanism
The RP mRNAs have a high average nPL under NS conditions but are significantly impaired in translation under HS, in the absence of a decrease in message abundance (Figs 4C and 5). These data are strong evidence of co-ordinate repression of initiation of translation of RP mRNAs under hypoxia. These mRNAs possess many of the optimal features for translation, such as a small ORF and short 5′- and 3′-UTRs (Fig. 6). However, the RP mRNAs have an extremely high 5′-UTR GC content which is correlated with low nPL values under HS (Fig. 7B). It has been shown previously for maize seedlings that hypoxia significantly reduces the level of run-on transcription of rDNA in isolated nuclei (Fennoy and Bailey-Serres, 1995; Fennoy et al., 1997) and de novo synthesis of most RPs (Bailey-Serres and Freeling, 1990). Given the dramatic reduction in nucleotide triphosphate availability during oxygen deprivation, the impairment of ribosome biogenesis may provide a means for conservation of cellular energy reserves. The maintenance of RP transcripts in hypoxic cells may allow for rapid restoration of RP synthesis upon an increase in oxygen availability.
CONCLUSIONS
Differential translation of cellular mRNAs plays an important role in the regulation of gene expression under normal growth conditions, as well as during the response of arabidopsis seedlings to HS. The range in the percentage of individual mRNAs in large polysomal complexes demonstrated that there is considerable translational regulation under both optimal and sub-optimal conditions. As expected from the significant reduction in polysome levels in response to HS, the majority of mRNAs showed a decrease in polysome association in response to this stress. Thus, many genes that show no change in mRNA abundance may be expressed at reduced levels due to a decrease in the initiation of translation. The dramatic impairment of translation of the abundant RP and proteasome component mRNAs is likely to contribute to the conservation of energy under HS. This analysis also recognized mRNAs with no change in abundance but a selective advantage for ribosome recruitment under HS (i.e. Cluster 7 mRNAs). These genes included a number of stress-induced proteins that might show an increase in synthesis without a concomitant change in mRNA abundance. Interestingly, ANPs were represented by mRNAs that showed maintained or decreased translation under HS (Cluster 4 and other clusters). These results underscore the importance of both alterations in the transcriptome and regulation of translational efficiency in the regulation of gene expression under HS.
LIST OF SUPPLEMENTARY MATERIAL
The following supplementary material can be accessed online at http://www.aob.oxfordjournals.org.
Supplementary Table 1. All genes. Fold change in total mRNA and polysomal mRNA in response to 12 h HS for all genes identified as ‘Present’ in the DNA microarray hybridization.
Supplementary Table 2. Gene groups. Data on gene groups identified by fold-change in steady-state mRNA accumulation, cluster analysis or biological function.
Supplementary Fig. 1. Functional categories of genes grouped in seven clusters. Functional classes of genes present in each cluster, as well as their relative representation were obtained through submission of corresponding AGI number to the TAIR website (http://www.arabidopsis.org/tools/bulk/go/index.jsp). Pie charts illustrate the proportion (percentage) of each functional class of genes found for each cluster. Chart number corresponds to cluster number.
Acknowledgments
This research was supported by a grant from the National Science Foundation to J.B.-S. (MCB-131486) and a fellowship from the Portuguese Fundação para a Ciência e a Tecnologia to C.B-P (SRFH/BD/9165/2002). We are grateful to Dr María de Socorro Santos Diaz for her participation in the initiation of this project, and Mr Ted Younglove and Cláudia Santos for assistance with the statistical analyses, and to members of the laboratories of J.B.-S. and R.B.F. for many helpful discussions.
LITERATURE CITED
- Arava Y, Wang Y, Storey JD, Liu CL, Brown PO, Herschlag D. 2003. Genome-wide analysis of mRNA translation profiles in Sacharomyces cerevisiae Proceedings of the National Academy of Sciences of the USA 100: 3889–3894. [DOI] [PMC free article] [PubMed] [Google Scholar]
- Bailey-Serres J. 1999. Selective translation of cytoplasmic mRNAs in plants. Trends in Plant Science 4: 142–148. [DOI] [PubMed] [Google Scholar]
- Bailey-Serres J, Dawe RK 1996. Both 5′ and 3′ sequences of maize adh1 mRNA are required to enhance translation under low oxygen. Plant Physiology 112: 685–695. [DOI] [PMC free article] [PubMed] [Google Scholar]
- Bailey-Serres J, Freeling M. 1990. Hypoxic stress-induced changes in ribosomes of maize seedling roots. Plant Physiology 94: 1237–1243. [DOI] [PMC free article] [PubMed] [Google Scholar]
- Baxter-Burrell A, Chang R, Springer P, Bailey-Serres J. 2003. Gene and enhancer trap transposable elements reveal oxygen deprivation-regulated genes and their complex patterns of expression in arabidopsis. Annals of Botany 91: 129–141. [DOI] [PMC free article] [PubMed] [Google Scholar]
- Baxter-Burrell A, Yang Z, Springer PS, Bailey-Serres J. 2002. RopGAP4-dependent Rop GTPase rheostat control of Arabidopsis oxygen deprivation tolerance. Science 296: 2026–2028. [DOI] [PubMed] [Google Scholar]
- Baud S, Vaultier MN, Rochat C. 2004. Structure and expression profile of the sucrose synthase multigene family in Arabidopsis. Journal of Experimental Botany 55: 397–409. [DOI] [PubMed] [Google Scholar]
- Blais JD, Filipenko V, Bi M, Harding HP, Ron D, Koumenis C, et al. 2004. Activating transcription factor 4 is translationally regulated by hypoxic stress. Molecular and Cellular Biology 24: 7469–7482. [DOI] [PMC free article] [PubMed] [Google Scholar]
- Browne GJ, Proud CG. 2002. Regulation of peptide-chain elongation in mammalian cells. European Journal of Biochemistry 269: 5360–5368. [DOI] [PubMed] [Google Scholar]
- Butler W, Cook L, Vayda ME. 1990. Hypoxic stress inhibits multiple aspects of the potato tuber wound response. Plant Physiology 93: 264–27. [DOI] [PMC free article] [PubMed] [Google Scholar]
- Chang WWP, Huang L, Shen M, Webster C, Burlingame AL, Roberts JKM. 2000. Patterns of protein synthesis and tolerance of anoxia in root tips of maize seedlings acclimated to a low-oxygen environment, and identification of proteins by mass spectrometry. Plant Physiology 122: 295–317. [DOI] [PMC free article] [PubMed] [Google Scholar]
- De Smet F, Mathys J, Marchal K, Thijs G, De Moor B, Moreau Y. 2002. Adaptive quality-based clustering of gene expression profiles. Bioinformatics 18: 735–746. [DOI] [PubMed] [Google Scholar]
- Dolferus R, Klok EJ, Delessert C, Wilson S, Ismond K, Good AG, et al. 2003. Enhancing the anaerobic response. Annals of Botany 91: 111–117. [DOI] [PMC free article] [PubMed] [Google Scholar]
- Dordas C, Rivoal J, Hill RD. 2003. Plant haemoglobins, nitric oxide and hypoxic stress. Annals of Botany 91: 173–178. [DOI] [PMC free article] [PubMed] [Google Scholar]
- Drew MC. 1997. Oxygen deficiency and root metabolism: injury and acclimation under hypoxia and anoxia. Annual Review of Plant Physiology and Plant Molecular Biology 48: 223–250. [DOI] [PubMed] [Google Scholar]
- Fennoy SL, Bailey-Serres J. 1995. Post-transcriptional regulation of gene expression in oxygen-deprived roots of maize. The Plant Journal 7: 287–295. [DOI] [PubMed] [Google Scholar]
- Fennoy SL, Jayachandran S, Bailey-Serres J. 1997. RNase activities are reduced concomitantly with conservation of total cellular RNA and ribosomes in O2-deprived seedling roots of maize. Plant Physiology 115: 1109–1117. [DOI] [PMC free article] [PubMed] [Google Scholar]
- Fennoy SL, Nong T, Bailey-Serres J. 1998. Transcriptional and post-transcriptional processes regulate gene expression in oxygen-deprived roots of maize. The Plant Journal 15: 727–735. [DOI] [PubMed] [Google Scholar]
- Fukao T, Bailey-Serres J. 2004. Plant responses to hypoxia—is survival a balancing act? Trends in Plant Science 9: 449–456. [DOI] [PubMed] [Google Scholar]
- Gebauer F, Hentze MW. 2004. Molecular mechanisms of translational control. Nature Review of Molecular and Cellular Biology 5: 827–835. [DOI] [PMC free article] [PubMed] [Google Scholar]
- Geigenberger P. 2003. Response of plant metabolism to too little oxygen. Current Opinion in Plant Biology 6: 247–256. [DOI] [PubMed] [Google Scholar]
- Hunt PW, Klok EJ, Trevaskis B, Watts RA, Ellis MH, Peacock WJ, et al. 2002. Increased level of hemoglobin 1 enhances survival of hypoxic stress and promotes early growth in Arabidopsis thaliana. Proceedings of the National Academy of Sciences of the USA. 99: 17197–17202. [DOI] [PMC free article] [PubMed] [Google Scholar]
- Kawaguchi R, Bailey-Serres J. 2002. Regulation of translational initiation in plants. Current Opinion in Plant Biology 5: 460–465. [DOI] [PubMed] [Google Scholar]
- Kawaguchi R, Bray EA, Bailey-Serres J. 2003. Water-deficit induced translational control in Nicotiana tabacum Plant, Cell and Environment 26: 221–229. [Google Scholar]
- Kawaguchi R, Bailey-Serres, J. 2005. mRNA sequence features responsible for translational regulation in Arabidopsis. Nucleic Acids Research 33: 955–965. [DOI] [PMC free article] [PubMed] [Google Scholar]
- Kawaguchi R, Girke T, Bray EA, Bailey-Serres J. 2004. Differential mRNA translation contributes to gene regulation under non-stress and dehydration stress conditions in Arabidopsis thaliana The Plant Journal 38: 823–839. [DOI] [PubMed] [Google Scholar]
- Klok EJ, Wilson IW, Wilson D, Chapman SC, Ewing RM, Somerville SC, et al. 2002. Expression profile analysis of the low-oxygen response in Arabidopsis root cultures. The Plant Cell 14: 2481–2494. [DOI] [PMC free article] [PubMed] [Google Scholar]
- Koch KE, Ying Z, Wu Y, Avigne WT. 2000. Multiple paths of sugar-sensing and a sugar/oxygen overlap of genes of sucrose and ethanol metabolism. Journal of Experimental Botany 51: 417–427. [DOI] [PubMed] [Google Scholar]
- Köhler U, Donath M, Mendel RR, Cerff R, Hehl R. 1996. Intron-specific stimulation of anaerobic gene expression and splicing efficiency in maize cells. Molecular and General Genetics 251: 252–258. [DOI] [PubMed] [Google Scholar]
- Kursteiner O, Dupuis I, Kuhlemeier C. 2003. The pyruvate decarboxylase1 gene of Arabidopsis is required during anoxia but not other environmental stresses. Plant Physiology 132: 968–978. [DOI] [PMC free article] [PubMed] [Google Scholar]
- Lin CY, Key JL. 1967. Dissociation and reassembly of polyribosomes in relation to protein synthesis in the soybean root. Journal of Molecular Biology 26: 237–247. [DOI] [PubMed] [Google Scholar]
- Liu F, Vantoai T, Moy LP, Bock G, Linford LD, Quackenbush J. 2005. Global transcription profiling reveals comprehensive insights into hypoxic response in Arabidopsis. Plant Physiology 137: 1115–1129. [DOI] [PMC free article] [PubMed] [Google Scholar]
- Loreti E, Poggi A, Novi G, Alpi A, Perata P. 2005. A genome-wide analysis of the effects of sucrose on gene expression in Arabidopsis seedlings under anoxia. Plant Physiology 137: 1130–1138. [DOI] [PMC free article] [PubMed] [Google Scholar]
- MacKay VL, Li X, Flory MR, Turcott E, Law GL, Serikawa KA, et al. 2004. Gene expression analyzed by high-resolution state array analysis and quantitative proteomics. Molecular and Cellular Proteomics 3.5: 478–489. [DOI] [PubMed] [Google Scholar]
- Millar AH, Trend AE, Heazlewood JL. 2004. Changes in the mitochondrial proteome during the anoxia to air transition in rice focus around cytochrome-containing respiratory complexes. Journal of Biological Chemistry 279: 39471–39478. [DOI] [PubMed] [Google Scholar]
- Paul AL, Schuerger AC, Michael PP, Richards JT, Manak MS, Ferl RJ. 2004. Hypobaric biology: Arabidopsis gene expression to low atmospheric pressure. Plant Physiology 134: 215–223. [DOI] [PMC free article] [PubMed] [Google Scholar]
- Preiss T, Hentze MW. 2003. Starting the protein synthesis machine: eukaryotic translation initiation. BioEssays 25: 1201–1211. [DOI] [PubMed] [Google Scholar]
- Preiss T, Baron-Benhamou J, Ansorge W, Hentze MW. 2003. Homodirectional changes in transcriptome composition and mRNA translation induced by rapamycin and heat shock. Nature Structural Biology 10: 1039–1047. [DOI] [PubMed] [Google Scholar]
- Redman JC, Haas BJ, Tanimoto G, Town CD. 2004. Development and evaluation of an Arabidopsis whole genome Affymetrix probe array. The Plant Journal 38: 545–561. [DOI] [PubMed] [Google Scholar]
- Rizhsky L, Davletova S, Liang H, Mittler R. 2004. The zinc finger protein Zat12 is required for cytosolic ascorbate peroxidase 1 expression during oxidative stress in Arabidopsis. Journal of Biological Chemistry 279: 11736–11743. [DOI] [PubMed] [Google Scholar]
- Sachs MM, Freeling M, Okimoto R. 1980. The anaerobic proteins of maize. Cell 20: 761–767. [DOI] [PubMed] [Google Scholar]
- Sachs MM, Subbaiah CC, Saab IN. 1996. Anaerobic gene expression and flooding tolerance in maize. Journal of Experimental Botany 47: 1–15. [Google Scholar]
- Seki M, Ishida J, Narusaka M, Fujita M, Nanjo T, Umezawa T, et al. 2002. Monitoring the expression pattern of around 7,000 Arabidopsis genes under ABA treatments using a full-length cDNA microarray. Functional and Integrative Genomics 2: 282–291. [DOI] [PubMed] [Google Scholar]
- Serikawa KA, Xu XL, MacKay VL, Law GL, Zong Q, Zhao LP, et al. 2003. The transcriptome and its translation during recovery from cell cycle arrest in Saccharomyces cerevisiae. Molecular and Cellular Proteomics 2.3: 191–204. [DOI] [PubMed] [Google Scholar]
- Szick-Miranda K, Jayachandran S, Tam A, Werner-Fraczek J, Williams AJ, Bailey-Serres, J. 2003. Evaluation of translational control mechanisms in response to oxygen deprivation in maize. Russian Journal of Plant Physiology 50: 774–786. [Google Scholar]
- Zuker M. 1989. On finding all suboptimal foldings of an RNA molecule. Science 244: 48–52. [DOI] [PubMed] [Google Scholar]
Associated Data
This section collects any data citations, data availability statements, or supplementary materials included in this article.