

Abstract
• Background and Aims The use of microarrays to characterize the transcript profile of Arabidopsis under various experimental conditions is rapidly expanding. This technique provides a huge amount of expression data, requiring bioinformatics tools to allow the proposal of working hypotheses. The aim of this study was to test the usefulness of this approach to examine the anaerobic response of Arabidopsis by evaluating the reliability of microarray data sets and by interrogation of microarray databases for the expression data of a set of anoxia-inducible genes.
•Methods User-driven software tools that display large gene expression datasets onto diagrams of metabolic pathways were used. The Genevestigator software was used to explore the expression of anoxia-inducible genes throughout the life cycle of Arabidopsis as well as relative to plant organs. T-DNA tagged mutants for selected genes identified from our microarray analysis were searched in the Arabidopsis thaliana Insertion Database, looking for insertional mutants from the Salk collection.
•Key Results The results indicate that microarray data can provide the basis for new hypotheses in the field of plant responses to anaerobiosis and also provide knowledge for a targeted screening of Arabidopsis mutants.
•Conclusions Research on plant responses to anaerobiosis can enormously benefit from the microarray technology.
Keywords: Anaerobiosis, anoxia, Arabidopsis thaliana, microarray, mutants
INTRODUCTION
Higher plants are aerobic organisms. Occasionally, plants experience a lower O2 availability (hypoxia) and, less frequently, total absence of O2 (anoxia). These conditions result from environmental factors (flooding of the soil) or anatomical structure of some tissues whose characteristics severely limit the permeability of O2 (tubers, vascular cambium of trees, meristematic tissues, etc.; see Perata and Alpi, 1993 for a review). Gene expression is strongly altered by anoxia and protein synthesis is redirected to the production of a new set of polypeptides (ANPs, anaerobic polypeptides or ASPs, anaerobic stress proteins; Geigenberger, 2003).
Most of the current knowledge about the molecular responses to anaerobiosis derives from the proteomic studies carried out using maize as a model system (Sachs et al., 1980; Chang et al., 2000). Several proteins with increased abundance under low O2 were subsequently identified as enzymes involved in the breakdown of sucrose, glycolysis and fermentation (Subbaiah and Sachs, 2003). The study of the anaerobic protein profile has also provided evidence that not only the fermentative pathway is enhanced under low O2 (Subbaiah and Sachs, 2003), but so is a xyloglucan endotransglycosylase gene (Peschke and Sachs, 1994), suggesting that the anaerobic response is far from being a simple switch from aerobic respiration to fermentative metabolism. The use of a proteomic approach has represented a powerful tool to identify genes involved in the response of plants to anaerobiosis but is, at present, outclassed by the use of DNA microarrays.
A DNA microarray uses between hundreds and hundreds of thousands of DNA probes arrayed on a solid surface to interrogate the abundance and/or binding ability of DNA or RNA target molecules. The DNA probes that are used in a DNA microarray could be amplified cDNA fragments or synthesized DNA oligonucleotides that have sequences that complement the target sequences. GeneChips are specialized microarrays that use in silico-synthesized DNA oligonucleotides as probes to detect the sequence similarity and abundance of target-DNA or -RNA molecules through complementary-sequence binding. GeneChip microarrays have been developed for Arabidopsis. The ATH1 GeneChip microarray, which was developed by Affymetrix and The Institute of Genome Research (TIGR), consists of over 22 500 probe sets (unique probe sets as well as approx. 2000 probe sets made up of sequences that are common to gene family members), representing approximately 24 000 gene sequences. These probe sets reach nearly 90 % of the Arabidopsis genome, based on the estimate of 27 750 genes. It is to be highlighted that gene annotation is not a fixed process, but a dynamic one, and both the criteria and gene detection software are continuously updated, rendering slightly different gene sets. Although genome expression analysis is still in its infancy, analyses of gene expression using GeneChip microarrays have already been applied to characterize transcript abundance, complexity and stability; to identify novel target genes and pathways that are associated with biological processes, such as hormonal-regulated gene expression (Mussig et al., 2002; Ogawa et al., 2003); to determine the regulatory elements of genes and pathways; and to characterize gene functions by profiling genetic mutants.
Plants are subjected to a variety of abiotic and biotic stresses such as salinity, flooding, mechanical stress, drought, thermal stress, attack by insects, wounds inflicted by phytophages, and infection by pathogens. Extensive cross-talks among pathways that are involved in responses to pathogen infection and to various abiotic stresses have been revealed (Schenk et al., 2000; Cheong et al., 2002). Expression profiling has also been used to study stress responses in several species, such as salt stress in rice (Kawasaki et al., 2001), barley (Ozturk et al., 2002) and yeast (Yale and Bohnert, 2001). Genome-wide expression analysis of genetic mutants not only characterizes the molecular phenotypes of those mutants at a quantitative level but also provides a vast amount of information that can be used to further define the signalling network (Tian et al., 2002).
A microarray study has recently described transcripts that are involved in the low-O2 response in Arabidopsis (Klok et al., 2002). Interestingly, genes that are differentially expressed in response to low O2 concentration encode not only well-known anaerobic proteins (Sachs et al., 1996) but also enzymes and signal-transduction components not previously known to be involved in low-O2 metabolism. These studies are interesting not only in respect to a molecular dissection of the adaptive responses to cope with anoxia (Dennis et al., 2000), but may also provide information about responses that slow metabolism and increase O2 entry, thereby enabling some plant tissues to avoid anoxia.
The shift of focus from analysing the expression of selected genes to analysing whole-genome expression provides challenges as well as opportunities. Microarray experiments have been used to shed light upon the mechanism of transcriptional regulation. Cluster analysis can group genes according to similarities in transcription profiles that are identified from microarray data (Eisen et al., 1998). These correlated gene transcription patterns may indicate the coordinated regulation of a cluster of genes. Thus, this method has been commonly used to predict co-regulated genes and, in combination with previous knowledge, may be used to group genes into signal pathways.
In the present paper we analyse the current knowledge about the use of microarrays to study the response of Arabidopsis to low O2. We compare microarray experiments performed using different technologies, and discuss the use of bioinformatics tools to explore the anaerobic transcriptome.
MATERIALS AND METHODS
Microarray datasets
Plant material was prepared for the GeneChip experiment as follows. Arabidopsis (ecotype Columbia glabra) seeds were incubated in 2·5 mL liquid growing medium without sugars (Murashige–Skoog half strength solution in 6-well plates). Plates were maintained in darkness, incubated at 4 °C for 2 d and then transferred to 23 °C for 4 d with shaking to ensure aeration of the medium before the 6 h anoxic treatment. An enclosed anaerobic work station (Forma Scientific, Anaerobic System Model 1025) was used to provide an O2-free environment for seedling incubation. This chamber uses palladium catalyst wafers and desiccant wafers to maintain an atmosphere of less than 10 ppm O2 (according to the specifications provided by the manufacturer). High purity N2 was used for purging the chamber initially and the working anaerobic gas mixture was N2 : H2 proportioned at 90 : 10. Aerobic samples were kept in a growth chamber in the dark, with vigorous shaking to ensure a good aeration of the incubation medium.
Total RNA was extracted from the seedling samples, using the Ambion RNAqueous extraction kit (Ambion, Austin, Texas, USA). RNA quality was assessed by agarose gel electrophoresis and spectrophotometry. RNA was processed for use on Affymetrix Arabidopsis ATH1 GeneChip arrays, according to the manufacturer's protocol. Expression analysis via the Affymetrix Microarray Suite software (version 5·0) was performed with standard parameters. All data manipulations were performed using Microsoft Excel. Differences in transcript abundance were calculated using the Microarray Analysis Suite 5·0 software change algorithm. Changes were assumed to be correct only if their corresponding ‘change call’ indicated a significant change.
The Klok et al. (2002) dataset of genes induced or repressed in Arabidopsis root cultures (C24 ecotype) exposed to 5 % O2 for 4 h was chosen for comparison with the dataset obtained using the Affymetrix ATH1 GeneChip.
Bioinformatics
User-driven software tools that display large datasets (gene expression data from Arabidopsis Affymetrix arrays) onto diagrams of metabolic pathways were used. AraCyc is an online tool for visualizing biochemical pathways of Arabidopsis thaliana, available at http://www.arabidopsis.org/tools/aracyc/. We also used the MapMan software, from http://gabi.rzpd.de/projects/MapMan/. The Meta Analyzer tool of the Genevestigator software (https://www.genevestigator.ethz.ch/) was used to estimate the levels of gene expression, as a heat map, throughout the life cycle of Arabidopsis as well as relative to plant organs.
Mutant database search
T-DNA tagged mutants for selected genes identified from our microarray analysis were searched using the ‘Genome Browse’ tool of the ‘Arabidopsis thaliana Insertion Database’ (http://atidb.org/cgi-perl/gbrowse/atibrowse). Only insertional mutants from the Salk collection (source: Joseph R. Ecker, Salk Institute Genomic Analysis Laboratory—SIGnAL http://signal.salk.edu) in the Columbia ecotype were considered. For every single gene of interest, the best insertional mutant was chosen, considering the position of T-DNA insertion within the sequence of the gene (e.g. insertions in 5′UTR or in former introns or exons) and the score of the BLAST analysis performed on the flanking sequence (http://arabidopsis.org/Blast/index.jsp). For the total number of insertions calculation, all the insertional mutants found for each cluster of genes were considered. For the number of ‘useful’ insertions, only mutants characterized by a T-DNA insertion in 5′UTR or the first half of the gene, which more likely give origin to knockout mutations, were considered.
RESULTS AND DISCUSSION
Transcript profiling under anoxia: are microarray data reliable?
The use of the Affymetrix ‘whole genome’ ATH1 array (Redman et al., 2004) results in over 20 000 expression data, which have to be processed to estimate the reliability of each single data point in terms of effective expression of the gene and evaluation of the statistical significance of a change of expression when comparing two datasets (e.g. RNA from an aerobic sample with that of an anaerobic sample). Besides the importance of a careful analysis of the results arising from each experiment, the need for a validation of results by comparing experiments performed by independent researchers is often under-evaluated. Indeed, one expects that the microarray technology not only provides a wealth of data about genes induced or repressed by low O2, but also that the genes identified (or at least a large proportion of genes) respond to low O2 independently of experimental conditions used to limit O2 availability. In the next paragraph, we evaluate the ability of microarrays to identify low-O2-modulated genes regardless of the experimental set-up.
Previous to the availability of microarrays covering the entire genome, the plant response to low O2 was analysed using a microarray containing 3500 cDNA clones (Klok et al., 2002). Genes encoding for known ANPs, as well as several genes of unknown function, were found to be induced or repressed by treating in vitro cultured Arabidopsis roots at 5 % O2 (Klok et al., 2002). We recently used the Affymetrix ‘whole genome’ ATH1 array to characterize the response of 4 d old Arabidopsis seedlings to 6 h anoxia (Loreti et al., 2005). Therefore, the dataset from Klok et al. (2002) and that from our laboratory can be compared. Klok et al. (2002) published the differential expression data of 210 genes significantly modulated by 5 % O2 at several time points. One hundred and eighty-nine out of the 210 genes identified by Klok et al. (2002) are represented on the Affymetrix ATH1 array, and it is thus possible to compare the two sets of results. It is important to highlight that the two experimental set-ups share the plant species used (Arabidopsis, although two different ecotypes were used by us and by Klok et al., 2002), while the plant material was treated with different anaerobic conditions (5 % O2 by Klok et al.; anoxia by Loreti et al.). The plant organs were also different (in vitro cultured roots by Klok et al.; seedlings by Loreti et al.), and the time point was slightly shifted (4 h treatment by Klok et al.; 6 h treatment by Loreti et al.). Furthermore, Klok et al. used a custom-prepared spotted cDNA microarray, while Loreti et al. used in silico synthesized DNA oligonucleotide GeneChips. The two datasets were plotted, and the results are shown in Fig. 1. The genes behaving consistently in the two experiments represent 89 % of the total 189 genes, demonstrating that genes identified as hypoxia-responsive in root cultures by Klok et al. (2002) are also anoxia responsive in seedlings (Loreti et al., unpubli.). The relative positions in the scatter plot of known anaerobic transcripts are shown in Fig. 1, and these demonstrate a very good correlation between the two-microarray experiments. Arabidopsis shows a very similar response to low oxygen (5 % O2) and to anoxia. It can be concluded that microarrays provide a powerful and reliable tool to explore the anaerobic plant transcriptome.
Fig. 1.

Comparison of the expression data obtained by Klok et al. (2002) and those obtained using the Affymetrix ATH1 GeneChip (Loreti et al., 2005). The fold-change following a 4 h treatment at 5 % O2 (x-axis, data from Klok et al., 2002) was plotted against the fold-change following a 6 h treatment under anoxia (see Materials and Methods for details about the plant materials). The genes coding for known anaerobic polypeptides are highlighted. Abbreviations: ADH, alcohol dehydrogenase; PDC, pyruvate decarboxylase; LDH, lactate dehydrogenase; SUS, sucrose synthase; ALAAT1, alanine aminotransferase.
An overview of the anoxic transcriptome
Whole genome arrays produce a vast amount of expression data. It is nearly impossible to examine the datasets manually, besides for searches of patterns of expression for genes of interest. It is thus nearly impossible to analyse microarray data without the use of specifically developed software. The AraCyc software (Mueller et al., 2003; http://www.arabidopsis.org/tools/aracyc) provides a good starting point to paint expression data on metabolic pathways (186 pathways currently available). For the data on RNAs from 6 h anoxic seedlings (Loreti et al., 2005) the AraCyc software shows that the most induced metabolic steps were those of sucrose metabolism (sucrose-synthases) and the ethanolic fermentative steps (pyruvate decarboxylase and alcohol dehydrogenase genes; data not shown). The pre-genomic knowledge about the molecular effects of anoxia is thus confirmed and reinforced. However, anoxia affects nearly all the metabolic pathways in addition to sucrose metabolism and ethanolic fermentation (data not shown). A relatively large number of genes encode the proteins responsible for each metabolic step, and AraCyc contains an average of 2·2 genes per annotated reaction (Mueller et al., 2003). The AraCyc software does not allow the user to view the expression data for each single gene product in each metabolic step.
MapMan software (Thimm et al., 2004) allows microarray data to be plated on any known metabolic pathway, through a user-defined procedure, and each piece of expression data is represented by a colour-coded dot (http://gabi.rzpd.de/projects/MapMan/). Analysis using MapMan software shows that expression of over 1600 genes in Arabidopsis is affected by 6 h anoxia. Remarkably, besides the clear induction of the genes for fermentative metabolism, the genes modulated by anoxia appear to be scattered among the majority of metabolic pathways, confirming that the anaerobic response includes a rearrangement of whole-plant metabolism, rather than a simple adaptation of the energy metabolism. Furthermore, nearly 50 % of the modulated genes code for proteins of unknown function. An effort to identify the function of these genes and their role in anaerobiosis tolerance requires the use of mutant lines for the genes of interest.
When and where are anaerobic genes expressed during the Arabidopsis life cycle?
The experiments performed using hypoxic or anoxic conditions are useful to identify low-O2-responsive genes, but cannot provide clues about the expression of these genes during the normal life cycle of the Arabidopsis plant. The Genevestigator software, allowing the ability to query a database of 1561 publicly available microarray datasets, has recently been made available online (Zimmermann et al., 2004; http://www.genevestigator.ethz.ch). By querying the database using a list of anoxia-responsive genes, including known genes encoding ANPs as well as some of the genes identified by Loreti et al. (2005) as anoxia-responsive, we tentatively identified the developmental stages and tissues in which the anoxia-responsive genes are expressed during the normal life cycle of Arabidopsis plants. Fig. 2 illustrates the expression of anoxia-inducible genes at different developmental stages, showing a preferential expression during germination, bolting, and seed production.
Fig. 2.

Heat map showing the levels of gene expression throughout the life cycle of Arabidopsis. The Meta Analyzer tool of the Genevestigator software was interrogated with the AGI codes of 19 genes that were determined to be anoxia-inducible from the GeneChip experiment (Loreti et al., 2005). Genes highlighted in red are those known to encode anaerobic polypeptides. See Zimmermann et al. (2004) for definitions of growth stages. To visualize gene expression levels and render visible slight changes in signal intensity, a blue—white colour scheme was chosen by the software developers (Zimmermann et al., 2004). All gene expression profiles were normalized for colouring such that for each gene the highest signal intensity represents a value of 100 % (dark blue) and absence of signal represents a value of 0 (white). The Genevestigator software orders the gene list on the basis of a Euclidean clustering (average linkage).
As far as known anaerobic genes are concerned, genes mostly expressed at the bolting stage (Fig. 2) include sucrose synthase1, sucrose synthase4, L-lactate dehydrogenase and alanine aminotransferase, while alcohol dehydrogenase and pyruvate decarboxylase1 and pyruvate decarboxylase2 were strongly expressed at the seed development stage. Non-symbiotic haemoglobin was mostly expressed during germination. These results suggest that distinct mechanisms are involved in the regulation of anoxia-responsive genes in their expression under physiological conditions, when low O2 is a consequence of anatomical (e.g. seed teguments can hamper O2 diffusion) or metabolic factors (e.g. intense respiration) limiting the availability of O2 (Perata and Alpi, 1993). Alternatively, assuming the expression of alcohol dehydrogenase as a reliable marker of anoxic metabolism, and thus internal anaerobic environment in the plant, Arabidopsis experiences hypoxia mostly in the developing seeds. The expression of other anoxia-inducible genes such as sucrose synthases and non-symbiotic haemoglobin might be controlled, besides anoxia, by other internal signals such as hormones or sugars. Indeed, regulation of sucrose synthase genes by sugars and abscisic acid has been reported in Arabidopsis (Dejardin et al., 1999). Interestingly, the sucrose synthase genes were not expressed at the seed development stage, while genes involved in ethanolic fermentation were strongly expressed at this stage, suggesting that sucrose synthase activity is unlikely to provide substrates for fermentation in the developing seeds. This is also supported by the low expression of sucrose synthase genes in the seeds and embryos (see Fig. 3, illustrating the pattern of expression of anoxia-inducible genes in different Arabidopsis tissues).
Fig. 3.
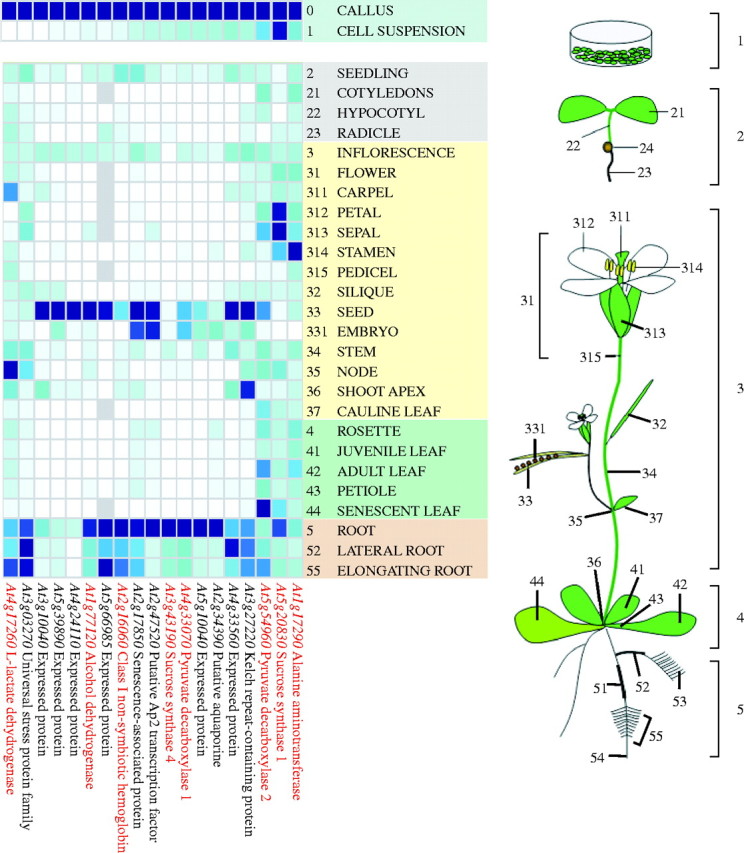
Heat map showing the levels of gene expression in different Arabidopsis tissues. The Meta Analyzer tool of the Genevestigator software was queried with the AGI codes of 19 genes that were determined to be anoxia-inducible from the GeneChip experiment (Loreti et al., 2005). Genes highlighted in red are those known to encode anaerobic polypeptides. To visualize gene expression levels and render visible slight changes in signal intensity, a blue—white colour scheme was chosen by the software developers (Zimmermann et al., 2004). All gene expression profiles were normalized for colouring such that for each gene the highest signal intensity represents a value of 100 % (dark blue) and absence of signal represents a value of 0 (white). The heat map for callus and suspension cells is normalized independently from the map showing Arabidopsis plant tissues. The Genevestigator software orders the gene list on the basis of a Euclidean clustering (average linkage). Most of the datasets used by the Genevestigator software to generate this figure are from Schmid et al. (2005).
The ‘Meta Analyzer’ tool of Genevestigator, when used to describe the pattern of expression of anoxia-inducible genes at different developmental stages, does not include microarray datasets from the roots. When checking for the expression of anoxia-inducible genes in different plant tissues it is realised that, besides the seed/embryo, the expression of many genes is preferentially located in the roots, where hypoxia may develop more easily due to liquid boundary layers (Fig. 3). Expression in roots was observed for all the known anaerobic genes (sucrose synthase1, sucrose synthase4, alcohol dehydrogenase, pyruvate decarboxylase1, pyruvate decarboxylase2, alanine aminotransferase and non-symbiotic haemoglobin), as well as for several of the additional anoxia-inducible genes. Furthermore, it is to be highlighted that the highest expression of all the genes tested was detected in in vitro cultured callus, a very likely consequence of the difficulty of O2 diffusion in the callus tissue. Suspension cultures, grown in shaken liquid culture medium, are instead very likely to be adequately aerated, and thus expression of anaerobic genes is not observed.
Microarray databases appear to represent a powerful tool to describe the pattern of expression of a set of genes of interest in silico, granted a molecular signature for the experimental condition of interest is known. The set of genes reported here represents the first attempt to define a molecular signature for the anaerobic response. More experimental evidence is, however, needed to validate and update this molecular signature.
Microarray data to enhance the search of mutants with altered response to anoxia
The use of mutants has often contributed to elucidation of the function of genes not yet characterized, or to better understand already known genes, allowing also the identification of their organization and expression mechanisms. Since the 1980s, null mutants for genes implied in the anaerobic response (e.g. alcohol dehydrogenase, ADH) have been identified and characterized in many plant species. For example, Arabidopsis null mutants for the ADH gene locus were identified using alkyl alcohol selection from ethyl methanesulfonate-mutagenized seeds. The adh− mutant is highly susceptible to anoxia (Jacobs et al., 1988).
The traditional forward genetics approach has recently been supported by reverse genetics and the use of T-DNAs and/or transposon insertional mutants as valuable instruments. A major drawback in reverse genetics is represented by the fact that the gene of interest must be already known and therefore only mutants in the primary or at least partially characterized genes in a certain response can be isolated. Another major limitation of this methodology is the fact that the probability of finding a mutation in a gene of interest increases with the number of mutant lines that are analysed. The insertional mutants collections in species such as Arabidopsis comprise a continuously increasing number of independently mutated lines. A calculation made by Krysan et al. (1999) indicates that about 280 000 T-DNA insertion lines are required to ensure a 99 % chance of mutating a particular gene, assuming a median gene length of 2·1 kb. 336 000 T-DNA insertion lines are available at present (http://signal.salk.edu), indicating that the tools needed for detecting virtually any mutation in the genome are available, although mutations that are lethal or that survive only when recessive represent a limitation to this approach. As an example, the Salk Collection (Alonso et al., 2003), the largest collection of T-DNA tagged Arabidopsis lines, comprises over 145 000 independent mapped T-DNA insertions (http://signal.salk.edu). Many hundreds of analyses may be necessary in order to find a specific line affected in the response to anaerobiosis. A preliminary screening to enrich genotypes from which a certain response is expected can expedite the process, but it does not always guarantee the final result because of genetic and functional redundancy as well as the subtle and/or conditional phenotypes.
In recent years, collections of insertional mutants have been made available where the exact insertion positions, and therefore the nature of the gene mutations, were identified with good reliability by means of high-throughput systems (Alonso et al., 2003). Recently, an Arabidopsis null mutant for the pyruvate decarboxylase1 (PDC1) gene has been isolated, allowing clarification of the importance of this gene among the PDC gene family under low-O2 conditions (Kürsteiner et al., 2003).
Further progress is represented by the combination of microarray technology and insertional mutagenesis. Analysing the anaerobic response of insertional mutants for genes previously identified by microarray analysis as responsive represents a combined reverse genetics system. A great advantage is that it becomes possible to identify several new genes involved in a biological process, therefore going into the functional genomics field. The combined microarray and T-DNA-tagged mutant screen is especially powerful to study regulatory factors (transcription factors, signal transduction components) if the mutants are not lethal, because there is no classic ‘activity’ or functional assay associated with them. For metabolic components, the situation will be different, and metabolomics will become an increasingly important analysis tool.
The potential of this combined approach is at present very high, since the T-DNA- or transposon-tagged mutants collections are very large, and also because of the very high number of genes whose functions are completely unknown. As far as the first point is concerned, an analysis carried out by us on a single collection of T-DNA mutant lines, the Salk collection (Alonso et al., 2003), in order to find insertional mutations within genes previously selected by microarray analysis as anoxia-regulated (Loreti et al., 2005), has given the results shown in Fig. 4.
Fig. 4.

T-DNA insertions within anoxia-regulated genes in the Salk collection T-DNA-tagged mutants. Genes were selected by microarray analysis and clustered according to their functional class. Results are expressed as percentages calculated based on the total number of genes belonging to each cluster. Open bars represent the percentages of total number of insertions found in each class. Shaded bars represent the percentages of the number of ‘useful’ insertions (e.g. insertions corresponding to potential knockout mutations) found in each cluster by means of a bioinformatics search, as described in Materials and Methods.
The number of insertional mutants available in this single collection for each functional class is very high, with extremes that exceed the 80 % of the selected genes. The values remain elevated also when considering only insertions that will more likely give origin to knockout mutations according to their position. The combined approach is therefore very promising and can be exploited either for single genes analysis (for those genes which are more specifically involved in the physiological response of interest) or for a high-throughput analysis (e.g. to choose all the mutants potentially interesting and therefore worthy of being screened under certain conditions).
The last aspect which must be considered is the possibility to use gene-trap or enhancer-trap insertional mutants to identify genes regulated by anaerobiosis in very specific or small plant regions and which can not be found by microarray analysis because of the dilution of their expression with that of the whole mRNA extracted from the plant. This approach has been frequently used to identify classes of genes with tissue-specific or inductive conditions-specific expression. For example, Baxter-Burrell et al. (2003) identified in Arabidopsis anoxia-regulated genes with a Ds-GUS tagging system. The comparison between their results and microarray data obtained by us (Loreti et al., 2005) revealed that actually there exist genes that appear to be anoxia-regulated in the transposon-tagging system but whose expression is classified as unchanged in the microarray analysis (e.g. a fructokinase, At3g59480; a receptor like protein kinase, At5g01890; a polygalacturonase, At1g02460).
What's next?
Besides transcriptional control, post-transcriptional and post-translational processes play an important role. Microarrays can be used to determine the steady-state mRNA levels (resulting from both transcription and mRNA stability), but a recent paper by Kawaguchi et al. (2004) demonstrates the feasibility to use this technology also to estimate the efficiency of mRNA translation. This approach has been used to evaluate the role of mRNA translation in gene regulation under water stress (low water availability), and it would be of great interest to have a similar experimental approach also carried out for hypoxia/anoxia. Furthermore, speculation about the role of genes expressed under anoxia requires substantial evidence at the protein level. Protein arrays representing a proteomic tool that closely emulates the DNA microarray technology are still at the developmental stage, and the technology available today for protein profiling (mostly based on 2-D electrophoresis) is by far outclassed by DNA microarrays. 2-D electrophoresis coupled with mass spectrometry is, however, likely to provide an extremely useful tool to identify abundant anoxic proteins (Chang et al., 2000), but is of limited use for the identification of transcription factors and other low-abundance proteins. The preparation of a library of antibodies designed on the basis of the sequences of anoxia-responsive genes identified by microarray experiments might provide tools for the identification of low-abundance anoxia-induced proteins. Furthermore, fluorescence 2-D Difference Gel Electrophoresis (DIGE) proteomics analysis utilizing 2-D PAGE protein separation may allow comparison of the protein profile with the transcript profile, thus enabling researchers to identify not only genes whose expression is upregulated by low O2, but also to get a deeper insight in the role of translation efficiency in stress adaptation.
Conclusions
Research on plant responses to anaerobiosis can benefit enormously from the high-throughput technology of the post-genomic era. Microarrays represent a consolidated technology that will provide a large amount of data concerning mRNAs levels in plant tissues subjected to anaerobiosis, requiring increasingly powerful bioinformatic tools for the analysis of complex datasets. Proteomics and metabolomics, although still in their infancy, will provide an additional layer of complexity to the study of plant anaerobiosis. We look forward to exciting progress in the knowledge about plant adaptation to low O2 availability.
Acknowledgments
We thank Mrs Emma Fiorini for help in the databases searches.
LITERATURE CITED
- Alonso JM, Stepanova AN, Leisse TJ, Kim CK, Chen H, Shinn P, et al. 2003. Genome-wide insertional mutagenesis of Arabidopsis thaliana Science 301: 653–657. [DOI] [PubMed] [Google Scholar]
- Baxter-Burrell A, Chang R, Springer P, Bailey-Serres J. 2003. Gene and enhancer trap transposable elements reveal oxygen deprivation-regulated genes and their complex patterns of expression in Arabidopsis Annals of Botany 91: 124–141. [DOI] [PMC free article] [PubMed] [Google Scholar]
- Chang WWP, Huang L, Shen M, Webster C, Burlingame AL, Roberts JKM. 2000. Patterns of protein synthesis and tolerance of anoxia in root tips of maize seedlings acclimated to a low-oxygen environment, and identification of proteins by mass spectrometry. Plant Physiology 122: 295–318. [DOI] [PMC free article] [PubMed] [Google Scholar]
- Cheong YH, Chang H-S, Gupta R, Wang X, Zhu T, Luan S. 2002. Transcriptional profiling reveals novel interactions between wounding, pathogen, abiotic stress, and hormonal responses in Arabidopsis Plant Physiology 129: 661–677. [DOI] [PMC free article] [PubMed] [Google Scholar]
- Dejardin A, Sokolov LN, Kleczkowski LA. 1999. Sugar/osmoticum levels modulate differential abscisic acid-independent expression of two stress-responsive sucrose synthase genes in Arabidopsis. Biochemical Journal 344: 503–509. [PMC free article] [PubMed] [Google Scholar]
- Dennis ES, Dolferus R, Ellis M, Rahman M, Wu Y, Hoeren FU, Grover A, Ismond KP, Good AG, Peacock WJ. 2000. Molecular strategies for improved waterlogging tolerance in plants. Journal of Experimental Botany 51: 89–97. [PubMed] [Google Scholar]
- Eisen MB, Spellman PT, Brown PO, Botstein D. 1998. Cluster analysis and display of genome-wide expression patterns. Proceedings of the National Academy of Sciences of the USA 95: 14863–14868. [DOI] [PMC free article] [PubMed] [Google Scholar]
- Geigenberger P. 2003. Response of plant metabolism to too little oxygen. Current Opinion in Plant Biology 6: 247–256. [DOI] [PubMed] [Google Scholar]
- Jacobs M, Dolferus R, Van Den Bossche D. 1988. Isolation and biochemical analysis of ethyl methanesulfonate-induced alcohol dehydrogenase null mutants of Arabidopsis thaliana (L.) Heynh. Biochemical Genetics 26: 105–122. [DOI] [PubMed] [Google Scholar]
- Kawaguchi R, Girke T, Bray EA, Bailey-Serres J. 2004. Differential mRNA translation contributes to gene regulation under non-stress and dehydration stress conditions in Arabidopsis thaliana Plant Journal 38: 823–839. [DOI] [PubMed] [Google Scholar]
- Kawasaki S, Borchert C, Deyholos M, Wang H, Brazille S, Kawai K, Galbraith D, Bohnert HJ. 2001. Gene expression profiles during the initial phase of salt stress in rice. Plant Cell 13: 889–905. [DOI] [PMC free article] [PubMed] [Google Scholar]
- Klok JE, Wilson IW, Wilson D, Chapman SC, Ewing RM, Somerville SC, Peacock WJ, Dolferus R, Dennis ES. 2002. Expression profile analysis of the low-oxygen response in Arabidopsis root cultures. Plant Cell 14: 2481–2494. [DOI] [PMC free article] [PubMed] [Google Scholar]
- Krysan PJ, Young JC, Sussman MR. 1999. T-DNA as an insertional mutagen in Arabidopsis Plant Cell 11: 2283–2290. [DOI] [PMC free article] [PubMed] [Google Scholar]
- Kürsteiner O, Dupuis I, Kuhlemeier C. 2003. The pyruvate decarboxylase1 gene of Arabidopsis is required during anoxia but not other environmental stresses. Plant Physiology 132: 968–978. [DOI] [PMC free article] [PubMed] [Google Scholar]
- Loreti E, Poggi A, Novi G, Alpi A, Perata P. 2005. A genome-wide analysis of the effects of sucrose on gene expression in Arabidopsis seedlings under anoxia. Plant Physiology 137: 1130–1138. [DOI] [PMC free article] [PubMed] [Google Scholar]
- Mueller LA, Zhang P, Rhee SY. 2003. AraCyc: a biochemical pathway database for Arabidopsis Plant Physiology 132: 453–460. [DOI] [PMC free article] [PubMed] [Google Scholar]
- Mussig C, Fischer S, Altmann T. 2002. Brassinosteroid-regulated gene expression. Plant Physiology 129: 1241–1251. [DOI] [PMC free article] [PubMed] [Google Scholar]
- Ogawa M, Hanada A, Yamauchi Y, Kuwahara A, Kamiya Y, Yamaguchi S. 2003. Gibberellin biosynthesis and response during Arabidopsis seed germination. Plant Cell 15: 1591–1604. [DOI] [PMC free article] [PubMed] [Google Scholar]
- Ozturk ZN, Talame V, Deyhoyos M, Michalowski CB, Galbraith DW, Gozukirmizi N, Tuberosa R, Bohnert HJ 2002. Monitoring large-scale changes in transcript abundance in drought- and salt-stressed barley. Plant Molecular Biology 48: 551–573. [DOI] [PubMed] [Google Scholar]
- Perata P, Alpi A. 1993. Plant responses to anaerobiosis. Plant Science 93: 1–17. [Google Scholar]
- Peschke VM, Sachs MM. 1994. Characterization and expression of transcripts induced by oxygen deprivation in maize (Zea mays L.). Plant Physiology 104: 387–394. [DOI] [PMC free article] [PubMed] [Google Scholar]
- Redman JC, Haas BJ, Tanimoto G, Town CD. 2004. Development and evaluation of an Arabidopsis whole genome Affymetrix probe array. Plant Journal 38: 545–561. [DOI] [PubMed] [Google Scholar]
- Sachs MM, Feeling M, Okimoto R. 1980. The anaerobic proteins of maize. Cell 20: 761–767. [DOI] [PubMed] [Google Scholar]
- Sachs MM, Subbaiah CC, Saab IN. 1996. Anaerobic gene expression and flooding tolerance in maize: glycolytic and XET genes and signal transduction. Journal of Experimental Botany 47: 1–15. [Google Scholar]
- Schenk PM, Kazan K, Wilson I, Anderson JP, Richmond T, Somerville SC, Manners JM. 2000. Coordinated plant defense responses in Arabidopsis revealed by microarray analysis. Proceedings of the National Academy of Sciences of the USA 97: 11655–11660. [DOI] [PMC free article] [PubMed] [Google Scholar]
- Schmid M, Davison TS, Henz SR, Pape UJ, Demar M, Vingron M, Scholkopf B, Weigel D, Lohmann JU. 2005. A gene expression map of Arabidopsis thaliana development. Nature Genetics 37: 501–506. [DOI] [PubMed] [Google Scholar]
- Subbaiah CC, Sachs MM. 2003. Molecular and cellular adaptations of maize to flooding stress. Annals of Botany 91: 119–127. [DOI] [PMC free article] [PubMed] [Google Scholar]
- Thimm O, Blasing O, Gibon Y, Nagel A, Meyer S, Kruger P, Selbig J, Muller LA, Rhee SY, Stitt M. 2004. MAPMAN: a user-driven tool to display genomics data sets onto diagrams of metabolic pathways and other biological processes. Plant Journal 37: 914–939. [DOI] [PubMed] [Google Scholar]
- Tian Q, Uhlir NJ, Reed JW. 2002.Arabidopsis SHY2/IAA3 inhibits auxin-regulated gene expression. Plant Cell 14: 301–319. [DOI] [PMC free article] [PubMed] [Google Scholar]
- Yale J, Bohnert HJ. 2001. Transcript expression in Saccharomyces cerevisiae at high salinity. Journal of Biological Chemistry 276: 15996–16007. [DOI] [PubMed] [Google Scholar]
- Zimmermann P, Hirsch-Hoffmann M, Hennig L, Gruissem W. 2004. GENEVESTIGATOR: Arabidopsis thaliana microarray database and analysis toolbox. Plant Physiology 136: 2621–2632. [DOI] [PMC free article] [PubMed] [Google Scholar]