

Abstract
• Background and Aims Flooding results in hypoxia of the root system to which N2 fixation of nodulated roots can be especially sensitive. Morphological adaptions, such as aerenchyma formation, can facilitate the diffusion of oxygen to the hypoxic tissues. Using soybean, the aim of the study was to characterize the morphological response of the nodulated root system to flooding and obtain evidence for the recovery of N metabolism.
• Methods Sections from submerged tissues were observed by light microscopy, while sap bleeding from the xylem was analysed for nitrogenous components.
• Key Results Flooding resulted in the rapid formation of adventitious roots and aerenchyma between the stem (immediately above the water line), roots and nodules. In the submerged stem, taproot, lateral roots and adventitious roots, lysigenous aerenchyma arose initially in the cortex and was gradually substituted by secondary aerenchyma arising from cells derived from the pericycle. Nodules developed aerenchyma from cells originating in the phellogen but nodules situated at depths greater than 7–8 cm showed little or no aerenchyma formation. As a result of aerenchyma formation, porosity of the taproot increased substantially between the 4th and 7th days of flooding, coinciding with the recovery of certain nitrogenous products of N metabolism of roots and nodules transported in the xylem. Thus, on the first day of flooding there was a sharp decline in xylem ureides and glutamine (products of N2 fixation), together with a sharp rise in alanine (product of anaerobic metabolism). Between days 7 and 10, recovery of ureides and glutamine to near initial levels was recorded while recovery of alanine was partial.
• Conclusions N metabolism of the nodulated soybean root system can recover at least partially during a prolonged period of flooding, a process associated with aerenchyma formation.
Keywords: Glycine max, soybean, secondary aerenchyma, oxygen deficiency, waterlogging, nitrogen metabolism, nitrogen fixation
INTRODUCTION
The lack of O2 in the root system of soybean (Glycine max), besides inhibiting symbiotic N2 fixation, also inhibits the uptake of N, leading to diminished root growth and nodulation (Sallam and Scott, 1987a, b; Sung, 1993). The stress brought on by low O2 concentrations in flooded soils leads to the formation of aerenchyma in tolerant plant species, a process that can occur in roots, nodules, rhizomes, stems and submerged leaves (Pankhurst and Sprent, 1975; Kawase and Whitmoyer, 1980; Justin and Armstrong, 1987; Armstrong et al., 1994; Loureiro et al., 1995; Drew, 1997; Jackson and Armstrong, 1999; Drew et al., 2000; Schussler and Longstreth, 2000; Gibberd et al., 2001). In the case of nodulated legumes, a large number of studies have shown the beneficial effects of aerenchyma towards N2 fixation under flooded conditions (Minchin and Summerfield, 1976; Walker et al., 1983; Loureiro et al., 1995; James and Crawford, 1998; Bacanamwo and Purcell, 1999b; James and Sprent, 1999; Shimamura et al., 2002), by providing a pathway for the diffusion of gases to the submerged nodules. Indeed, nodules of soybean grown at low pO2 produced morphological changes that were similar to those grown under waterlogged conditions and were responsible for maintaining N2-fixing activity under these conditions (Parsons and Day, 1990).
Aerenchyma can be of two types: cortical and secondary. Secondary aerenchyma arises from successive cell division, induced by hypoxia, giving rise to spongy parenchymous tissue (Justin and Armstrong, 1987). Cortical aerenchyma may be formed by a specific process of separation and differential expansion of mature cells (schizogenous aerenchyma) or by death and dissolution of such cells (lysigenous aerenchyma). Nevertheless, both types of aerenchyma can occur in the same plant and schizogenous aerenchyma may precede the occurrence of lysigenous aerenchyma in the same organ (Justin and Armstrong, 1987; Armstrong et al., 1994; Schussler and Longstreth, 1996; Jackson and Armstrong, 1999; Drew et al., 2000).
Waterlogged soybean plants form aerenchyma in the base of the stem, adventitious roots (Becanamwo and Purcell, 1999a; Pires et al., 2002; Shimamura et al., 2003), taproot (Shimamura et al., 2003), lateral roots (Bacanamwo and Purcell, 1999a) and in nodules (Pankhurst and Sprent, 1975; Shimamura et al., 2003). Shimamura et al. (2003) demonstrated that the origin of secondary aerenchyma in the hypocotyl, taproot, adventitious roots and submerged nodules was the phellogen.
Some of the principal changes in N metabolism that have been reported to occur in the soybean plant subjected to waterlogging are reduced N2 fixation (Bacanamwo and Purcell, 1999b) and the accumulation of alanine (Sousa and Sodek, 2003). The consequences of such changes are readily seen in the transport of N compounds via xylem, where elevated levels of alanine are found (Puiatti and Sodek, 1999; Sousa and Sodek, 2003) together with strongly reduced levels of glutamine and ureides, both of which reflect N2-fixing activity in soybean (McClure et al., 1980; Puiatti and Sodek, 1999; Amarante and Sodek, 2005). Although several studies have looked into the metabolic and morphological aspects of flooding, these have mostly been carried out separately, and no detailed investigation has focused on both of these aspects at the same time. Therefore, the present study was carried out in an attempt to relate anatomical studies with some of the metabolic changes associated with the waterlogged root system of nodulated soybean plants in order to better understand the influence of anatomical changes on N metabolism under these conditions.
MATERIALS AND METHODS
Experiment 1: anatomical study of submerged organs
Soybean plants (Glycine max L.), ‘FT-Abyara’ (determinate growth habit), inoculated on sowing with Bradyrhizobium elkanii, strain SEMIA 5019, were grown in a glasshouse under natural light and temperature (average maximum, 38 °C, average minimum, 19 °C) conditions. Plants were cultivated in 2-L pots (two plants per pot) in vermiculite and irrigated twice a week with 200 mL of N-free nutrient solution (Hoagland and Arnon, 1950) to the V6-7 stage (plants with five or six expanded trifoliate leaves, as defined by Fehr et al., 1971).
When the V6-7 stage was reached, the 2-L pots were placed inside 3-L pots (non-perforated) and the whole root system flooded to the base of the stem with N-free nutrient solution at one-third strength. The water level was maintained 2–3 cm above the surface of the vermiculite (giving a total volume of 1·8 L) by the daily addition of nutrient solution. The duration of the flooding treatment was 21 d.
Non-flooded controls were also run simultaneously where 200 mL of N-free nutrient solution was supplied twice a week and then increased to three times a week when the flooding treatments were initiated such that an equivalent amount of nutrients was made available (i.e. 600 mL of undiluted solution equivalent to 1·8 L of nutrient solution diluted one to three). The controls also received water as necessary.
Segments of 1 cm were taken from the waterlogged and control plants, first at daily intervals from days 1–7, and then at days 14 and 21, with three replicates per treatment. For the waterlogged plants, the segments were taken from the submerged part of the stem, the transition region between the submerged stem and the root, the taproot (at 4–5 cm below the substrate level), the lateral roots (situated about 1–2 cm below the substrate and 1 cm from the taproot) and the adventitious roots (1 cm from the root–shoot junction). As a control, plants segments were taken only from the stem, taproot and lateral roots. Nodules located on lateral roots (at 1–3 cm below the substrate surface) were taken from both control and waterlogged plants. The segments were fixed in neutral buffered formalin (100 mL of formol, 4·0 g of NaH2PO4·H2O and 6·5 g of anhydrous Na2HPO4 in 1 L of distilled water). Dehydration was carried out by treating segments sequentially with 30 %, 50 % and 70 % ethanol, for 12 h at each concentration. The segments were recut in the form of a wedge of 3 mm or less in height, width and depth, for infiltration in glycol methacrylate, according to Gerrits and Smid (1983). The polymerized resin blocks were then glued onto wooden blocks with plastic adhesive and 12-µm-thick sections cut on a rotary microtome (American Optical, model 820).
The sections were mounted on glass slides (2·5 cm × 7·5 cm), heated to 65 °C, followed by staining for 3 min in 0·05 % toluidine blue in 0·1 m acetate buffer pH 4·7 and washing in running water for 5 min (O'Brien et al., 1964). After drying the slides at room temperature, the sections were viewed and photographed with a light microscope (Olympus, model BX40).
The root system and nodules (as shown in Fig. 1) were photographed with a stereoscopic microscope (Olympus, model SZX9).
Fig. 1.
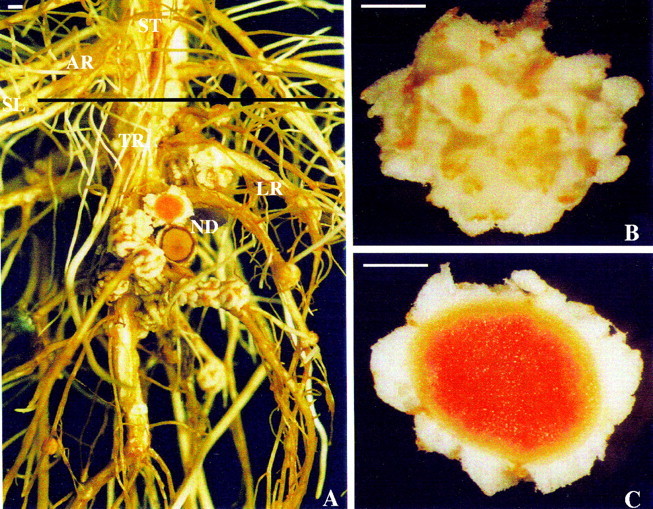
Soybean plants subjected to waterlogging for 21 d at the V6-7 stage: (A) stem–root segment, (B) external view of the nodule and (C) internal view of the nodule. AR, adventitious root; LR, lateral root; ND, nodule; SL, substrate level; ST, stem; TR, taproot. Scale bars = 1 mm.
Experiment 2: formation of aerenchyma and its effect on metabolism of the root system under hypoxia
Soybean plants were cultivated as for expt 1 up to flowering (10–12 expanded trifoliate leaves), when the root systems were flooded for a period of 10 d.
The levels of O2 in the nutrient solution were measured by a portable Jenway dissolved oxygen meter, model 9071, with the electrode placed in the solution between the inner and outer pots.
Gas volume of tissues (i.e. porosity) was determined for nodules and taproot according to Jensen et al. (1969). Nodules were harvested from roots to a depth of 3 cm, since below a depth of 5 cm there was practically no formation of aerenchyma. The segment of taproot studied was restricted to the top 8 cm due to the fact that in preliminary studies this region presented the most rapid development of aerenchyma, visible to the naked eye within 2 d of flooding.
Sap bleeding from the xylem was collected between 1100 and 1300 h during a 30- to 60-min period, according to McClure and Israel (1979). The separation and analysis of the free amino acid composition of the sap was carried out by reverse-phase HPLC of their OPA derivatives using a column of Spherisorb ODS-2, 4·6 mm × 250 mm, based on Jarret et al. (1986). The amino acids were eluted from the column by a gradient formed from two solvents, buffer A (50 mm NaAc and Na2HPO4, adjusted to pH 7·25 with HAc, plus 20 mL methanol and 20 mL tetrahydrofuran in 1 L of MilliQ water) and solvent B (65 % methanol in MilliQ water), such that the proportion of solvent B increased linearly from 20 % to 28 % between 0 and 5 min, 28 % to 58 % between 5 and 35 min, 58 to 75 % between 35 and 40 min, 75 to 95 % between 40 and 56 min and finally 95 to 100 % between 56 and 61 min. Standards (Sigma AA-S-18 plus Gln, Asn and GABA) were used at 250 nmol mL−1. Total amino acid concentration was calculated as the sum of the amino acids recovered after chromatographic separation and quantification. Uriedes were determined in the xylem sap by the method of Vogels and Van Der Drift (1970) using allantoin as standard.
Data are expressed as the means of three replicates where each replicate consisted of one pot containing two plants (material pooled). Where appropriate, the data were subjected to an analysis of variance and when F was significant the means compared by Duncan's multiple range test at a 5 % probability level.
RESULTS
Experiment 1: anatomical study of submerged organs
The O2 concentration of the nutrient solution in the pots on flooding was approx. 0·42 mmol dm−3, but rapidly fell to between 0·06 to 0·03 mmol dm−3 at day 1. The low levels persisted until the end of the experiment on day 21 (data not shown), demonstrating that hypoxic conditions existed throughout the experiment.
The morphological changes that occurred in the submerged segments began to appear after the first day of flooding. Adventitious root formation was apparent near the junction between shoot and root. Aerenchyma was formed in the root–shoot junction, adventitious roots, taproot and nodules, presumably establishing a connection of aerenchyma between these tissues (Fig. 1). Aerenchyma may be seen in tissue sections of the waterlogged material (Figs 2–4) contrasting its almost absence in the non-flooded controls. Details of anatomical changes in the different tissues were as follows.
Fig. 2.
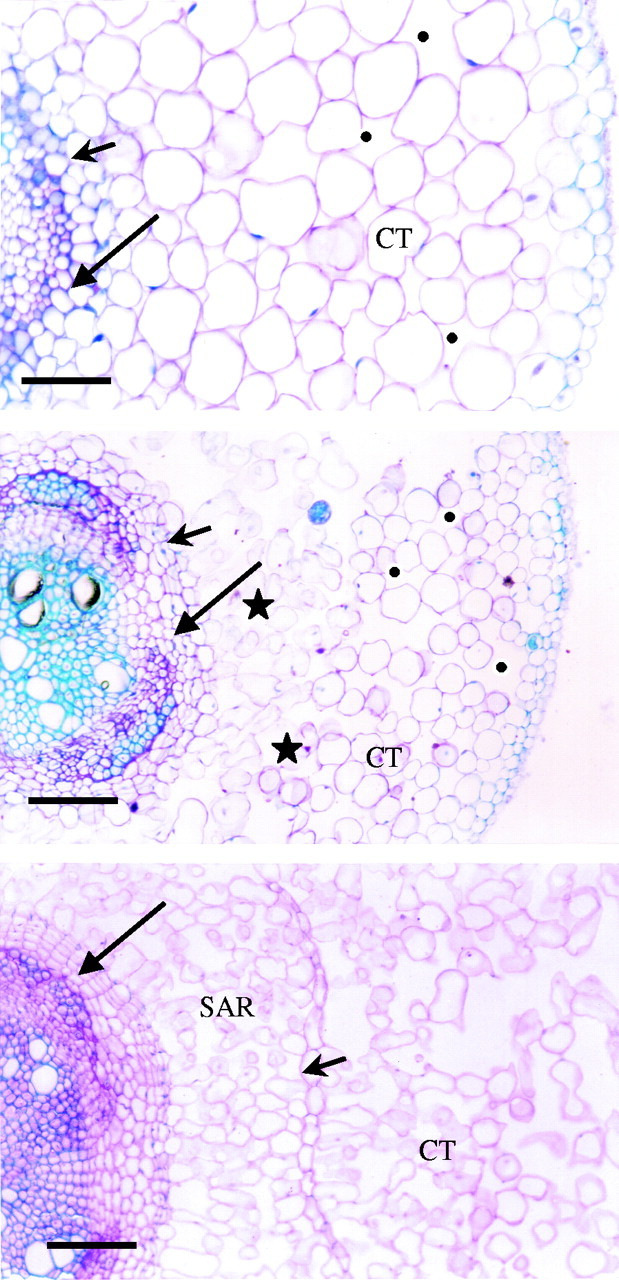
Transverse sections showing the time-course of aerenchyma formation in adventitious roots of soybean during flooding. Sections were taken 1 cm from the root–shoot junction: (A) after 7 d of flooding (scale bar = 50 µm); (B) after 14 d of flooding (scale bar = 110 µm); (C) after 21 d of flooding (scale bar = 100 µm). SAR, Secondary aerenchyma; CT, cortex. Long arrows indicate the pericycle; short arrows, the endodermis; asterisks, lysigenous aerenchyma; black dots, schizogenous aerenchyma.
Fig. 3.
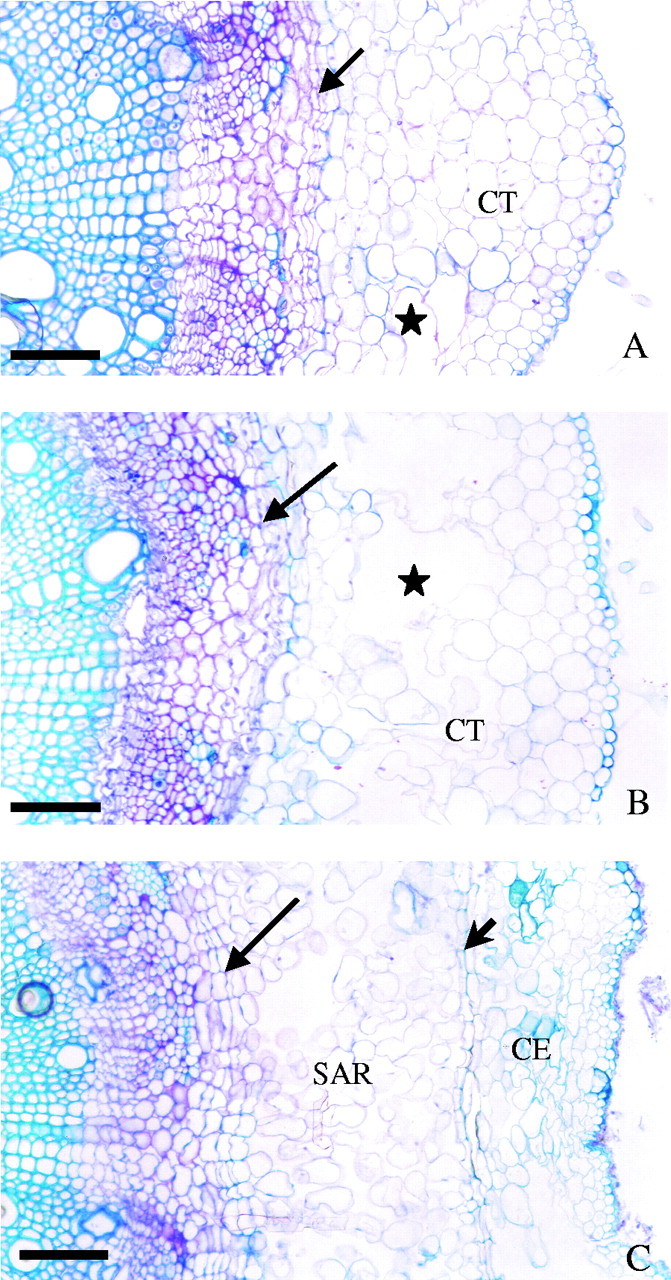
Transverse sections showing the time-course of aerenchyma formation in the taproot of soybean during flooding: (A) non-flooded control (at 21 d) (scale bar = 110 µm); (B) after 7 d of flooding (scale bar = 110 µm); (C) after 21 d of flooding (scale bar = 140 µm). SAR, Secondary aerenchyma; CT, cortex; CE, remnants of cortex and epidermis. Long arrows indicate the pericycle; short arrows, the endodermis; asterisks, lysigenous aerenchyma.
Fig. 4.
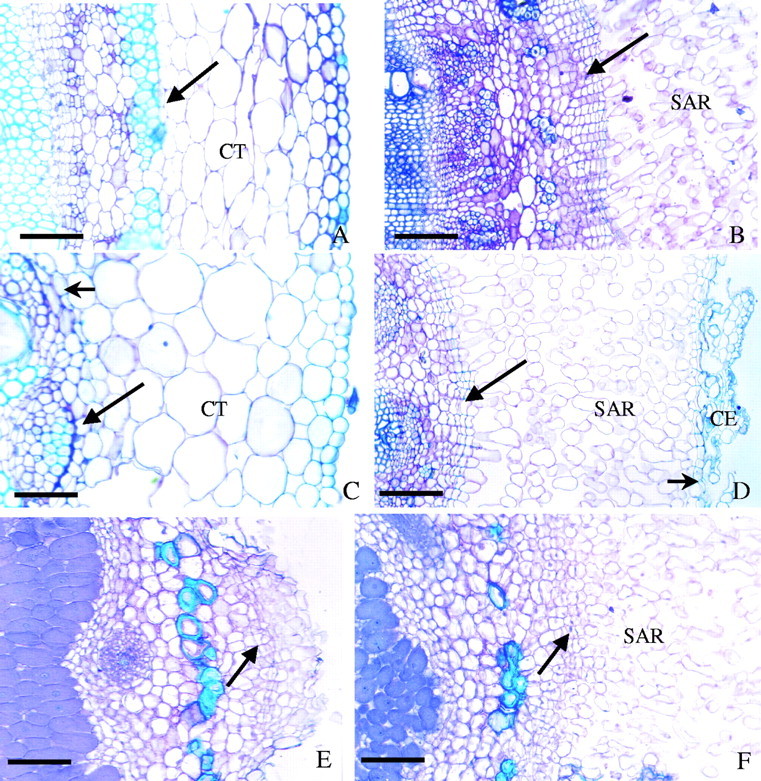
Transverse sections showing aerenchyma formation in the flooded root system of soybean. Root–shoot junction: control (A), flooded 21 d (B). Lateral root: control (C), flooded 21 d (D). Nodule: control (E), flooded 21 d (F). CT, Cortex; SAR, secondary aerenchyma; CE, remnants of cortex and epidermis. Long arrows indicate the pericycle; short arrows, the endodermis. The arrows in E and F indicate phellogen. Scale bars: B, D–F = 100 µm; A = 70 µm; C = 40 µm.
Submerged stem portion and adventitious roots
After the first day of flooding, hypertrophy of lenticels was apparent on the stem–root segment. By the second day, hypertrophy of the lenticels increased while adventitious roots appeared. Examination of sections under the microscope revealed signs of initial breakdown of the epidermis with the formation of aerenchyma involving cells arising by division of the pericycle (Fig. 4A and B). On day 3 the adventitious roots were 2–5 mm long. By days 4 and 5 the formation of aerenchyma in the stem–root segment became evident while the adventitious roots had grown to a length of 1 cm or more. After 21 d of flooding, the secondary aerenchyma of the stem–root segment was very prominent (Fig. 4B).
The adventitious roots of the submerged stem, originating from the pericycle, formed schizogenous aerenchyma in the cortex (Fig. 2A; day 7). As the flooding treatment became more prolonged, lysigenous aerenchyma formed in the cortex (Fig. 2B; day 14) and by day 21 aerenchyma was also seen to arise from cell divisions of the pericycle (Fig. 2C). The aerenchyma produced by the pericycle displaced the endodermis and the cortex radially, causing the epidermis to break away from the tissue.
Taproot and lateral roots
Formation of aerenchyma on the upper 8 cm of the taproot was only slight up to day 4 of flooding, but increased rapidly thereafter. Here, too, secondary aerenchyma was formed from cell divisions of the pericycle (Fig. 3C). The actual sequence of events is shown in Fig. 3. During the first 7 d of flooding lysigenous aerenchyma in the cortex became quite pronounced (Fig. 3B). Subsequently, tissue formed by division of the pericycle displaced the endodermis radially and produced secondary aerenchyma. By day 21 (Fig. 3C), this radial displacement caused some of the epidermis to break away, resulting in the cortical aerenchyma being largely substituted by the secondary aerenchyma. Displacement of the endodermis by cell division of the pericycle was not seen in the non-flooded material (Fig. 3A). Such controls revealed the presence of only occasional lysigenous aerenchyma in the cortex.
In the lateral roots, aerenchyma appeared from days 5 or 6 after flooding, first in the cortex and subsequently (by day 14) as secondary aerenchyma produced from cell divisions of the pericycle. By day 21 (Fig. 4D) the secondary aerenchyma had displaced the endodermis radially causing much of the epidermis to break away leaving a very reduced amount of cortical tissue. The sequence of events was in fact quite similar to that observed for the taproot shown in Fig. 3. In the non-flooded lateral roots there was no evidence for the presence of any large gas-filled spaces in the cortex (Fig. 4C).
Nodules
Formation of aerenchyma in nodules resulted in a profound change in their external appearance, with the proliferation of white friable aerenchymatous tissue (Fig. 1B) contrasting with the normally firm, light-brown and beige striped nodule surface. A transverse section of a nodule at 21 d after flooding (Fig. 1C) shows such nodules apparently viable in view of the intense colouring of the central infected zone due to leghaemoglobin. The presence of aerenchyma at this time was very prominent. Aerenchyma formation in waterlogged nodules arose from cells produced by the phellogen (Fig. 4F). However, for nodules situated below a depth of 7–8 cm, there was practically no development of aerenchyma. Even nodules of plants not subjected to flooding formed some aerenchyma through hypertrophy of lenticels (Fig. 4E), again originating from cell division of the phellogen.
Experiment 2: formation of aerenchyma and products of N metabolism in the xylem of the root system under hypoxia
The concentration of dissolved O2 in the nutrient solution (Table 1) followed a similar pattern to that of the first experiment, falling rapidly on the first day of flooding and thereafter it remained at very low levels (0·6–0·7 mg of O2 L−1) throughout the 10 d of the experiment.
Table 1.
O2 levels in the nutrient solution, porosity of nodules and taproot, xylem sap alanine, glutamine, ureides and total amino acids in soybean plants, during 10 d of waterlogging with N-free nutrient solution at the flowering stage
| Porosity (gas/tissue %v/v) |
Xylem sap (mol%) |
Xylem sap (µmol mL−1) |
||||||||||||
|---|---|---|---|---|---|---|---|---|---|---|---|---|---|---|
| Days |
O2 levels (mg L−1) |
Nodules |
Root* |
Alanine |
Glutamine |
Ureides |
Total AA |
|||||||
| Flooded | ||||||||||||||
| 0 | 6·6 | 0·4b† | 0·3c | 0·4 | 13·7 | 4·2a | 2·1a | |||||||
| 1 | 0·9 | 1·9a | 1·6c | 34·0 | 0·6 | 0·2c | 1·2bc | |||||||
| 2 | 0·7 | 1·9a | 2·5c | – | – | – | – | |||||||
| 3 | 0·6 | 1·9a | 2·6c | 17·7 | 0·2 | 0·2c | 0·8c | |||||||
| 4 | 0·8 | 1·7a | 4·7c | – | – | – | – | |||||||
| 5 | 0·6 | 1·8a | 13·4b | 12·8 | 0·8 | 0·2c | 0·7c | |||||||
| 6 | 0·6 | 1·8a | 17·3b | – | – | – | – | |||||||
| 7 | 0·6 | 2·1a | 22·0a | 3·9 | 6·2 | 1·4b | 1·1bc | |||||||
| 10 | 0·7 | 1·7a | 21·7a | 6·2 | 12·8 | 3·9a | 1·6ab | |||||||
| Non-flooded | ||||||||||||||
| 5 | 6·7 | 0·5b | 0·3c | 0·6 | 16·2 | 4·1a | 2·0a | |||||||
| 10 | 6·7 | 0·5b | 0·4c | 0·2 | 18·8 | 4·5a | 1·8a | |||||||
Upper 8 cm portion of the taproot.
Means followed by different letters, within columns, are statistically different by the multiple range test of Duncan (P ≤ 0·05).
Aerenchyma formation was followed by measuring the increase in tissue porosity (Table 1). Thus, the porosity of nodules increased from 0·4 to 1·9 % after the first day of waterlogging and remained close to this value throughout the experiment, whereas the porosity of the taproot increased progressively, from 4·7 % on the 4th day of waterlogging to its maximum value of 22 % on the 7th day.
The levels of xylem sap ureides and glutamine fell sharply to low values over the first day of flooding (Table 1). These low levels persisted for several days but started increasing at day 7 following the large increase in root porosity and returned to near pre-flooded levels by day 10. In contrast, there was a very steep rise in alanine over the first day of flooding (from 0·4 to 34 %) followed by a gradual fall to more moderate levels over the next 4 d. Levels continued falling towards the end of the experiment but initial levels were not recovered. Total amino acid levels also fell to less than half their initial value over the first 5 d of flooding but most of the fall was seen on the first day. In parallel with ureides, total amino acid levels largely recovered towards the end of the experiment, again coinciding with the large increase in root aerenchyma.
DISCUSSION
The observed morphological modifications concerning the formation of adventitious roots and aerenchyma that occur in the submerged root system of soybean were similar to those reported by Bacanamwo and Purcell (1999a), Pires et al. (2002) and Shimamura et al. (2003). However, the present data provide additional information on the development of aerenchyma in lateral, adventitious and taproots, as well as providing a clearer picture of the sequence of events. The present data demonstrate (Fig. 4B) that the origin of the secondary aerenchyma at the root–shoot junction is the pericycle, since it is from the pericycle that cells of the parenchyma are produced that dislocate the endodermis, cortex and epidermis. Shimamura et al. (2003) reported that aerenchyma in this tissue originates from the external part of the interfasicular cambium. Nevertheless, for some authors the interfascicular tissue is in fact the pericycle, as shown for stems of Ricinus communis, Wedelia paludosa and Aristolochia sp. (Angyalossy-Alfonso and Marcati, 2003).
The appearance of adventitious roots over the first few days of flooding, together with the development of aerenchyma, demonstrates that adventitious roots constitute an adaptation of soybean to flooding. Schizogenous aerenchyma (Fig. 2A) was formed in the cortex of adventitious roots during the first week of waterlogging, followed by lysigenous aerenchyma (Fig. 2B), while the formation of secondary aerenchyma arising from the pericycle (Fig. 2C) after more prolonged waterlogging led to the gradual substitution of the cortical aerenchyma. The presence of lysigenous aerenchyma in the cortex of adventitious roots was described by Bacanamwo and Purcell (1999a) and Pires et al. (2002), whereas the presence of schizogenous aerenchyma in the cortex of adventitious roots had not been reported previously, although it is known that schizogenous aerenchyma can precede lysigenous aerenchyma in the same organ in other species (Jackson and Armstrong, 1999). Similarly, the taproot and lateral roots initially formed lysigenous aerenchyma in the cortex, followed by substitution with secondary aerenchyma formed from the pericycle (referred to as phellogen by Shimamura et al., 2003). The substitution of cortical by secondary aerenchyma in taproot and adventitious roots was also reported for soybean by Shimamura et al. (2003).
The origin of secondary aerenchyma in the nodule was the phellogen (Fig. 4E and F) and its formation was very prominent in waterlogged nodules (Figs 1C and 4F), yet on occasions it also appeared in nodules of control plants (Fig. 4E), possibly due to the high capacity for water retention of the vermiculite (about 400 mL of water per 2 L of vermiculite). The present observations for aerenchyma formation in the nodules are similar to those reported by Pankhurst and Sprent (1975) and Shimamura et al. (2003).
Porosity of the taproot increased substantially between days 4 and 7 of flooding, reflecting the formation of aerenchyma. The substantial changes in certain xylem sap nitrogenous metabolites provoked by flooding were restored to or near initial levels coincident with aerenchyma formation in the taproot. Changes in nitrogenous components of the xylem sap are known to reflect important changes in root N metabolism. Xylem sap ureides are closely associated with N2 fixation (McClure et al., 1980; Herridge and Peoples, 1990), and more recently glutamine has been shown to hold a similar relationship for soybean (Amarante and Sodek, 2005). Alanine is strongly associated with hypoxia of the root system, being transported in large amounts in the xylem of waterlogged soybean plants (Sousa and Sodek, 2003), while N deficiency can result in profound changes in aspartate and asparagine (Lima and Sodek, 2003). The sharp drop in ureides and glutamine on the first day of flooding apparently reflects, therefore, a strong inhibition of N2 fixation imposed by this treatment. N2 fixation is known to be highly sensitive to oxygen deficiency and, even under ideal growth conditions, oxygen appears to be limiting for nitrogenase (Hunt et al., 1989; Layzell et al., 1990). The recuperation of xylem sap glutamine and ureides after aerenchyma formation, together with the timing of these events, suggests some recovery of N2 fixation, consistent with the restoration of a more adequate oxygen supply to the nodules as a result of the observed morphological adaptations (i.e. formation of adventitious roots and aerenchyma) in the roots to flooding. The data of Bacanamwo and Purcell (1999b) also suggest that such morphological adaptations of soybean plants to flooding lead to recovery of N2 fixation, since the rate of biomass and N accumulation returned to control levels between days 14 and 21 of flooding. Shimamura et al. (2002) reached a similar conclusion when a sharp decline in xylem ureide levels and nitrogenase activity was observed in flooded soybean plants following blockage of the hypocotyl aerenchyma with vaseline.
The changes in xylem sap alanine are also consistent with the ability of aerenchyma to supply the roots with an adequate supply of oxygen. The high levels recorded during the first few days of waterlogging would result from the prevailing hypoxic conditions, while the subsequent fall after aerenchyma formation surely is indicative of the greater availability of oxygen to the root system. The fact that alanine did not return fully to pre-hypoxic levels might be explained by the fact that aerenchyma does not penetrate to deeper-lying regions of the root which would presumably continue with anaerobic metabolism.
In conclusion, the present data are consistent with the view that a more adequate supply of oxygen to the root system associated with aerenchyma formation leads to at least partial recovery of N metabolism of the nodulated root system of soybean during a prolonged period of flooding. Furthermore, the measurement of exported N compounds in the xylem sap as a means of assessing N2 fixation activity and anaerobic metabolism of the roots, despite being indirect and therefore more qualitative than quantitative, appears to have the merit of enabling estimates of in situ activity without disturbing the waterlogged root system.
Supplementary Material
Acknowledgments
We thank CNPq for financial support and CAPES for the fellowship awarded to A.L.T.
Footnotes
Present address: Departamento de Plantas de Lavoura, UFRGS, C.P. 15100, CEP 90001-970, Porto Alegre—RS, Brazil.
LITERATURE CITED
- Amarante L, Sodek L. 2005. Waterlogging effect on xylem sap glutamine of nodulated soybean. Biologia Plantarum (in press). [Google Scholar]
- Angyalossy-Alfonso V, Marcati CR. 2003. Câmbio vascular. In: Appezzato-da-Glória, B, Carmello-Guerreiro SM, eds. Anatomia vegetal. Editora UFV, Viçosa, Brazil, 207. [Google Scholar]
- Armstrong W, Brändle R, Jackson MB. 1994. Mechanisms of flood tolerance in plants. Acta Botanica Neerlandica 43: 307–358. [Google Scholar]
- Bacanamwo M, Purcell LC. 1999. Soybean root morphological and anatomical traits associated with acclimation to flooding. Crop Science 39: 143–149. [Google Scholar]
- Bacanamwo M, Purcell LC. 1999. Soybean dry matter and N accumulation responses to flooding stress, N sources and hypoxia. Journal of Experimental Botany 50: 689–696. [Google Scholar]
- Drew MC. 1997. Oxygen deficiency and root metabolism: injury and acclimation under hypoxia and anoxia. Annual Review of Plant Physiology and Plant Molecular Biology 48: 223–250. [DOI] [PubMed] [Google Scholar]
- Drew MC, He C-J, Morgan PW. 2000. Programmed cell death and aerenchyma formation in roots. Trends in Plant Science 5: 123–127. [DOI] [PubMed] [Google Scholar]
- Fehr WR, Caviness DT, Burmood JS, Pennington JS. 1971. Stage of development descriptions for soybean. Crop Science 11: 929–931. [Google Scholar]
- Gerrits PO, Smid L. 1983. A new, less toxic polymerization system for the embedding of soft tissues in glycol methacrylate and subsequent preparing of serial sections. Journal of Microscopy 132: 81–85. [DOI] [PubMed] [Google Scholar]
- Gibberd MR, Gray JD, Cocks PS, Colmer TD. 2001. Waterlogging tolerance among a diverse range of Trifolium accessions is related to root porosity, lateral root formation and ‘aerotropic rooting’. Annals of Botany 88: 579–589. [Google Scholar]
- Herridge DF, Peoples MB. 1990. Ureide assay for measuring nitrogen fixation by nodulated soybean calibrated by 15N methods. Plant Physiology 93: 495–503. [DOI] [PMC free article] [PubMed] [Google Scholar]
- Hoagland DR, Arnon DI. 1950. The water culture method for growing plants without soil. California Agricultural Experimental Station Bulletin, Circular No. 347. [Google Scholar]
- Hunt S, King BJ, Layzell DB. 1989. Effects of gradual increases in O2 concentration on nodule activity in soybean Plant Physiology 91: 315–321. [DOI] [PMC free article] [PubMed] [Google Scholar]
- Jackson MB, Armstrong W. 1999. Formation of aerenchyma and the processes of plant ventilation in relation to soil flooding and submergence. Plant Biology 1: 274–287. [Google Scholar]
- James EK, Crawford RMM. 1998. Effect of oxygen availability on nitrogen fixation by two Lotus species under flooded conditions. Journal of Experimental Botany 49: 599–609. [Google Scholar]
- James EK, Sprent JI. 1999. Development of N2-fixing nodules on the wetland legume Lotus uliginosus exposed to conditions of flooding. New Phytologist 142: 219–231. [Google Scholar]
- Jarret HW, Cooksy KD, Ellis B, Anderson JM. 1986. The separation of o-phthalaldehyde derivatives of amino acids by reverse-phase chromatography on octylsilica columns. Analytical Biochemistry 153: 189–198. [DOI] [PubMed] [Google Scholar]
- Jensen CR, Luxmoore RJ, Van Gundy SD, Stolzy LH. 1969. Root air space measurements by a pycnometer method. Agronomy Journal 61: 474–475. [Google Scholar]
- Justin SHFW, Armstrong W. 1987. The anatomical characteristics of roots and plant response to soil flooding. New Phytologist 106: 465–495. [Google Scholar]
- Kawase M, Whitmoyer RE. 1980. Aerenchyma development in waterlogged plants. American Journal of Botany 67: 18–22. [Google Scholar]
- Layzell DB, Hunt S, Palmer GR. 1990. Mechanism of nitrogenase inhibition in soybean nodules. Pulse-modulated spectroscopy indicates that nitrogenase activity is limited by O2 Plant Physiology 92: 1101–1107. [DOI] [PMC free article] [PubMed] [Google Scholar]
- Lima JD, Sodek L. 2003. N-stress alters aspartate and asparagine levels of xylem sap in soybean. Plant Science 165: 649–656. [Google Scholar]
- Loureiro MF, James EK, Sprent JI, Franco AA. 1995. Stem and root nodules on the tropical wetland legume Aeschynomene fluminensis New Phytologist 130: 531–544. [DOI] [PMC free article] [PubMed] [Google Scholar]
- McClure PR, Israel DW. 1979. Transport of nitrogen in the xylem of soybean plants. Plant Physiology 64: 411–416. [DOI] [PMC free article] [PubMed] [Google Scholar]
- McClure PR, Israel DW, Volk RJ. 1980. Evaluation of the relative ureide content of xylem sap as an indicator of N2 fixation in soybeans. Plant Physiology 66: 720–725. [DOI] [PMC free article] [PubMed] [Google Scholar]
- Minchin FR, Sommerfield RJ. 1976. Symbiotic nitrogen fixation and vegetative growth of cowpea (Vigna unguiculata (L.) Walp.) in waterlogged conditions. Plant and Soil 45: 113–127. [Google Scholar]
- O'Brien TP, Feder N, McCully ME. 1964. Polychromatic staining of plant cell walls by toluidine blue. Protoplasma 59: 368–373. [Google Scholar]
- Pankhurst CE, Sprent JI. 1975. Surface features of soybean nodules. Protoplasma 85: 85–98. [Google Scholar]
- Parsons R, Day DA. 1990. Mechanism of soybean nodule adaptation to different oxygen pressures. Plant, Cell and Environment 13: 501–512. [Google Scholar]
- Pires JLF, Soprano E, Cassol B. 2002. Morphophysiological changes of soybean in flooded soils. Pesquisa Agropecuaria Brasileira 37: 41–50. [Google Scholar]
- Puiatti M, Sodek L. 1999. Waterlogging affects nitrogen transport in the xylem of soybean. Plant Physiology and Biochemistry 37: 767–773. [Google Scholar]
- Sallam A, Scott HD. 1987. Effects of prolonged flooding on soybeans during early vegetative growth. Soil Science 144: 61–66. [Google Scholar]
- Sallam A, Scott HD. 1987. Effects of prolonged flooding on soybean at the R2 growth stage. I. Dry matter and N and P accumulation. Journal of Plant Nutrition 10: 567–592. [Google Scholar]
- Schussler EE, Longstreth DJ. 1996. Aerenchyma develops by cell lyses in roots and cell separation in leaf petioles in Sagittaria lancifolia (Alismataceae). American Journal of Botany 83: 1266–1273. [Google Scholar]
- Schussler EE, Longstreth DJ. 2000. Changes in cell structure during the formation of root aerenchyma in Sagittaria lancifolia (Alismataceae). American Journal of Botany 87: 12–19. [PubMed] [Google Scholar]
- Shimamura S, Mochizuki T, Nada Y, Fukuyama M. 2002. Secondary aerenchyma formation and its relation to nitrogen fixation in root nodules of soybean plants (Glycine max) grown under flooded conditions. Plant Production Science 5: 294–300. [Google Scholar]
- Shimamura S, Mochizuki T, Nada Y, Fukuyama M. 2003. Formation and function of secondary aerenchyma in hypocotyl, roots and nodules of soybean (Glycine max) under flooded conditions. Plant and Soil 251: 351–359. [Google Scholar]
- Sousa CAF, Sodek L. 2003. Alanine metabolism and alanine aminotransferase activity in soybean (Glycine max) during hypoxia of the root system and subsequent return to normoxia. Environmental and Experimental Botany 50: 1–8. [Google Scholar]
- Sung FJM. 1993. Waterlogging effect on nodule nitrogenase and leaf nitrate reductase activities in soybean. Field Crops Research 35: 183–189. [Google Scholar]
- Vogels GD, Van Der Drift C. 1970. Differential analysis of glyoxylate derivatives. Analytical Biochemistry 33: 143–157. [DOI] [PubMed] [Google Scholar]
- Walker BA, Pate JS, Kuo J. 1983. Nitrogen fixation by nodulated roots of Viminaria juncea (Schrad. & Wendl.) Hoffmans. (Fabaceae) when submerged in water. Australian Journal of Plant Physiology 10: 409–421. [Google Scholar]
Associated Data
This section collects any data citations, data availability statements, or supplementary materials included in this article.