

Real-time quantitative PCR (qPCR) is a rapid and sensitive method that forms the foundation for many clinical diagnostic tests. Droplet digital PCR (ddPCR) shares these qualities with qPCR, but due to reaction partitioning, is proposed to exhibit increased tolerance to interfering substances, making it an attractive alternative to qPCR for diagnostic applications (1;2). The data to support this phenomenon and its mechanism, however, are currently lacking in the literature (3).
Herein, we describe a series of experiments to compare the inhibition tolerance of laboratory-developed CMV qPCR and ddPCR (Bio-Rad Laboratories, Hercules, CA, QX-100) assays by introducing a panel of clinically relevant inhibitors (SDS, EDTA and heparin) directly into the PCR reactions (4). Differences in the resulting inhibition curves and the half maximal inhibitory concentrations (IC50) were then assessed. The laboratory-developed CMV qPCR is a double primer/probe Taqman assay that amplifies and detects the UL123 (IE) and UL55 (gB) genes using primers and probes previously described (5). The ddPCR assay utilizes the same primers and probes with HEX replacing FAM on the gB probe and BHQ1 replacing TAM on both probes (Sigma Aldrich, St. Louis, MO).
SDS, EDTA and heparin were serially diluted and added directly to CMV (AD169 whole virus, Advanced Biotechnologies, Columbia, MD) qPCR and ddPCR reactions. On average, 14,143±439 droplets were analyzed per well of any given ddPCR reaction. The average concentration of CMV template in uninhibited samples of the ddPCR was 9.27 copies/μL (in a 20 μl reaction) over 3 biological replicates. Droplets in partially inhibited samples show fluorescent units ranging between those of positive and negative droplets and can be easily visualized in 1D-amplitude plots (Figure, wells 4 to 7). In a typical, uninhibited sample, a tight threshold (Figure, orange line) is placed near the cluster of positive droplets and is constant for a specific target. However, in the case of partial inhibition, a broad threshold is applied to the ddPCR QX100 analysis near the negative droplets to appropriately incorporate all partially inhibited droplets (Figure, blue line).
Figure 1.
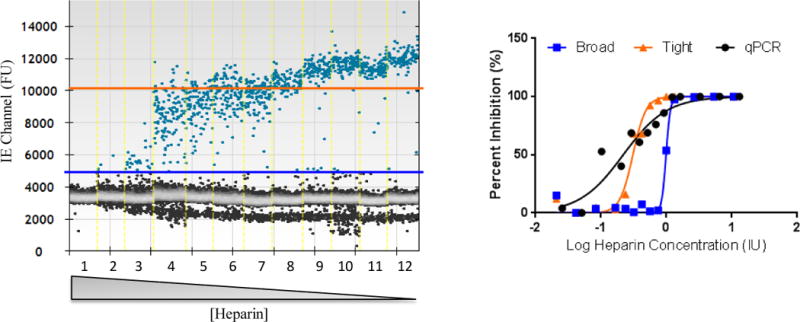
(Left panel), Droplet plot of CMV IE ddPCR assay for 12 wells containing a dilution series of heparin. Each well is demarcated by a yellow dashed line. Heparin concentration decreases from well 1 to well 12. Gray droplets are negative for CMV. Blue droplets are positive for CMV. The orange line represents the typical thresholding level for non-inhibited samples (wells 10–12). The blue line represents the broad threshold applied to inhibited samples for accurate quantitation in the presence of inhibitory concentrations of heparin. (Right panel), The inhibition curves corresponding to the threshold applied to the data analysis of the ddPCR are shown. The inhibition curve for the CMV qPCR is also indicated.
Using this strategy, log IC50 values were calculated from the resulting inhibition curves. Greater than a half log increase in IC50 was observed for both the IE and gB targets of ddPCR over qPCR for both SDS (absolute log difference in IC50 qPCR vs. ddPCR IE: 0.554, vs. ddPCR gB: 0.628) and heparin (absolute log difference in IC50 qPCR vs. ddPCR IE: 0.655, vs. ddPCR gB: 0.855). The probability of difference between the data sets for ddPCR and qPCR was >99.99% for both inhibitors and both ddPCR targets, indicating that ddPCR tolerated the presence of these inhibitors better than qPCR. However, this difference was not noted when comparing ddPCR and qPCR in the presence of EDTA for both ddPCR targets (log difference in IC50 qPCR vs. ddPCR IE: 0.116, vs. ddPCR gB: 0.0198), possibly owing to different inhibition mechanisms. EDTA is a calcium chelator whereas SDS and heparin both act on DNA polymerase.
The ddPCR CMV assay is more tolerant to SDS and heparin than the qPCR assay, indicating reaction partitioning through digitization may reduce susceptibility to traditional PCR inhibitors. The data suggests that individual micro-reactions mitigate the impact of inhibitors on PCR amplification by retaining discernible positive signal even when moderate PCR inhibition is occurring in a droplet. Since PCR reactions are not partitioned in qPCR, amplification is dependent on the concentration of inhibitor in the entire reaction, and will result in an increased number of amplification cycles required to reach a signal above a given threshold. In turn, this will result in inaccurate quantification of template in the original sample. In ddPCR, on the other hand, quantification is dictated by the Poisson distribution. Theoretically, each droplet ideally contains one or zero copies of template. This distribution can also be applied to the presence of inhibitory substances. Amplification will depend on the presence or absence of template and the presence or absence of inhibitory concentrations of inhibitor in each droplet. Delayed amplification or reduced amplification efficiency per cycle due to partial inhibition can be visualized using amplitude plots. This mechanism allows optimal placement of the analysis threshold to include positive droplets that exhibit amplitude shifts due to the effects of inhibitors (Figure). The results from the inhibitor spiked PCR reactions provide proof-of-concept that ddPCR may offer an advantage over qPCR when dealing with inhibition prone specimens. Other clinical sample types such as stool, sputum, and tissue are known to be more recalcitrant to removal of inhibitors through typical extraction methods, so ddPCR may prove especially useful for such specimens.
Acknowledgments
We would like to acknowledge Amalia Margaret, University of Washington, Seattle, WA for help with the statistical analysis. We would also like to acknowledge Steve Binder, Bio-Rad Laboratories, Hercules, CA and George Karlin-Neumann, The Digital Biology Center, Bio-Rad, Pleasanton, CA for their helpful comments in preparation of the manuscript.
Abbreviations
- qPCR
real-time quantitative PCR
- dPCR
digital PCR
- ddPCR
droplet digital PCR
- CMV
cytomegalovirus
References
- 1.Baker M. Digital PCR hits its stride. Nat Methods. 2012;9:541–4. [Google Scholar]
- 2.Sedlak RH, Jerome KR. Viral diagnostics in the era of digital polymerase chain reaction. Diagn Microbiol Infect Dis. 2013;75:1–4. doi: 10.1016/j.diagmicrobio.2012.10.009. [DOI] [PMC free article] [PubMed] [Google Scholar]
- 3.Hoshino T, Inagaki F. Molecular quantification of environmental DNA using microfluidics and digital PCR. Syst Appl Microbiol. 2012;35:390–5. doi: 10.1016/j.syapm.2012.06.006. [DOI] [PubMed] [Google Scholar]
- 4.Wilson IG. Inhibition and facilitation of nucleic acid amplifciation. Appl Environ Microbiol. 1997;63:3741–51. doi: 10.1128/aem.63.10.3741-3751.1997. [DOI] [PMC free article] [PubMed] [Google Scholar]
- 5.Boeckh M, Huang M, Ferrenberg J, Stevens-Ayers T, Stensland L, Nichols WG, Corey L. Optimization of quantitative detection of cytomegalovirus DNA in plasma by real-time PCR. J Clin Microbiol. 2004;42:1142–8. doi: 10.1128/JCM.42.3.1142-1148.2004. [DOI] [PMC free article] [PubMed] [Google Scholar]