

Abstract
Objective(s):
To assess differences between HIV prevalence estimates derived from national population surveys and antenatal care (ANC) surveillance sites and to improve the calibration of ANC-derived estimates in Spectrum 2013 to more appropriately account for differences between these data.
Design:
Retrospective analysis of national population survey and ANC surveillance data from 25 countries with generalized epidemics in sub-Saharan Africa and 8 countries with concentrated epidemics.
Methods:
Adult national population survey and ANC surveillance HIV prevalence estimates were compared for all available national population survey data points for the years 1999–2012. For sub-Saharan Africa, a mixed-effects linear regression model determined whether the relationship between national population and ANC estimates was constant across surveys. A new calibration method was developed to incorporate national population survey data directly into the likelihood for HIV prevalence in countries with generalized epidemics. Results were used to develop default rules for adjusting ANC data for countries with no national population surveys.
Results:
ANC surveillance data typically overestimate population prevalence, although a wide variation, particularly in rural areas, is observed across countries and survey years. The new calibration method yields similar point estimates to previous approaches, but leads to an average 44% increase in the width of 95% uncertainty intervals.
Conclusion:
Important biases remain in ANC surveillance data for HIV prevalence. The new approach to model-fitting in Spectrum 2013 more appropriately accounts for this bias when producing national estimates in countries with generalized epidemics. In countries with concentrated epidemics, local sex ratios should be used to calibrate ANC surveillance estimates.
Keywords: demographic and health surveys, HIV, mathematical models, models/projections, prevalence, surveillance
Introduction
Nearly all countries conduct some form of HIV surveillance to monitor patterns and trends in the HIV epidemic [1]. In countries with generalized HIV epidemics where HIV infection is firmly established in the heterosexual population, sentinel surveillance among pregnant women attending antenatal care (ANC) clinics in urban and rural areas, conducted every 1 or 2 years in each site, is the predominant data source for monitoring the epidemic [2]. In countries with concentrated epidemics where transmission of HIV occurs primarily within high-risk groups such as injection drug users and men who have sex with men, ANC surveillance data play a smaller but still important role in determining whether the epidemic has spread into the general population [3].
Despite the historical contributions of ANC surveillance, the accuracy of national HIV prevalence estimates derived from these data has been an ongoing concern. The extent to which ANC surveillance data represent the general population prevalence depends on the combined effect of a number of potential biases. First, prevalence among pregnant women attending ANC clinics may not be representative of pregnant women generally if ANC uptake is low [2]. Second, ANC prevalence may not reflect prevalence among the female population generally, due either to selection for women at higher risk at younger age or to the impact of HIV-related fertility reductions among those who are older [4,5]. Finally, ANC prevalence may not mirror national prevalence because sentinel surveillance sites are not selected randomly, and geographic coverage of lower-prevalence rural areas may be limited [6,7]. The magnitude and direction of these biases also may shift over time due to changes in ANC uptake and fertility patterns among women, as well as changes in participating sites [8–12].
National population-based household surveys, such as Demographic and Health Surveys (DHS) and AIDS Indicator Surveys (AIS), which incorporate HIV testing, are increasingly used to improve accuracy in estimates of national HIV prevalence levels [13]. Compared to ANC surveillance, these surveys have broad geographic representation and test both men and women [14]. Whereas national population surveys are considered the gold standard for measuring HIV prevalence levels in the general population, particularly in generalized epidemics, the substantial technical and financial resources they require can limit their usefulness for monitoring trends [13]. For many countries, intervals between surveys can stretch to five or more years, and for countries with concentrated epidemics, national population surveys are not recommended as population prevalence is too low to justify the effort and expense required to conduct them [3]. ANC surveillance, on the contrary, is less costly and simpler to conduct, which facilitates more frequent measurement in any setting [2].
Most countries with generalized epidemics rely on a combination of ANC surveillance and national population survey data to produce national HIV prevalence estimates using Spectrum, a modelling tool supported by the Joint United Nations Programme on HIV/AIDS (UNAIDS) [15–17]. Since 2007, Spectrum has been implemented as part of a two-stage fitting process, which first estimates prevalence trends based on ANC surveillance data and then applies a post-fitting calibration approach that adjusts these prevalence trend estimates to match prevalence levels estimated from national population surveys [18]. For countries with generalized epidemics, but no national population survey, UNAIDS has recommended a default 20% downward adjustment to ANC-based estimates in urban and rural areas based on an analysis by Gouws et al.[19] from 26 countries with ANC and population survey data between 2001 and 2007. For countries with concentrated epidemics, which historically divide low-risk population estimates by sex, UNAIDS recommended a downward adjustment of 40% for women and 60% for men, based on an unpublished comparison of ANC surveillance and population survey data through 2007 from six countries (report available from corresponding author).
Given the unique contributions that data from both national population surveys and ANC surveillance can make in informing national HIV estimates, it is critical to understand how these estimates differ currently, whether these differences have changed over time, and how Spectrum can best incorporate both data sources to obtain accurate estimates and projections of national HIV epidemics. In this study, we provide an updated comparison of adult HIV prevalence estimates from national population surveys and ANC surveillance data through 2012. For countries with generalized epidemics, we explore if this relationship has changed over time. We then describe a new, more parsimonious calibration method within Spectrum that allows national population survey data to more directly contribute to national estimates. Finally, we provide default values for calibrating Spectrum models for countries without national population surveys.
Methods
Spectrum model overview
Spectrum employs a ‘susceptible-infected’ dynamic model of HIV transmission to estimate trends in HIV incidence, prevalence and AIDS mortality [15–17]. The model is typically fit to HIV prevalence data from participating ANC surveillance sites. In the previous versions of Spectrum, after fitting the model, estimated epidemic trajectories were calibrated to match HIV prevalence levels observed in national population surveys when available or calibrated downward based on default values [18].
Spectrum currently offers three different modelling options for how the force of infection parameter, r, is modelled within the dynamic transmission model: EPP classic, r-spline, and r-trend. EPP classic relies on four parameters to generate values for r[16], with relatively little flexibility in patterns for r after the peak in prevalence. This option may be less appropriate in recent years for countries in sub-Saharan Africa (SSA), but it provides a reasonable epidemic curve for those countries with concentrated epidemics where the start of the epidemic is more recent and data are sparse. R-spline uses Bayesian penalized B-splines to generate smooth, flexible curves for r[20,21], which improves the model's ability to capture more complex epidemic patterns. R-trend also generates flexible curves for r, but does so by modelling r as a linear combination of past prevalence, the past infection rate, and a stabilization condition [22]. Brown [17] described the current model implementations in another article in this supplement.
Empirical comparison of national population survey and antenatal care surveillance HIV prevalence
Analyses were restricted to SSA countries with generalized epidemics that estimated urban and rural areas separately and countries with concentrated epidemics that estimated male and female low-risk populations separately. This includes most countries that report to UNAIDS. For the purposes of this analysis, country epidemics were classified as generalized if national estimates of HIV prevalence among adults aged 15–49 years were greater than 1%, apart from São Tomé and Príncipe, which at the time of analysis, classified its epidemic as concentrated.
We extracted national population survey HIV prevalence estimates from the Spectrum 2012 files submitted by countries to UNAIDS in July 2013. For most countries, these national population estimates are also available through online published DHS and AIS reports (accessible at http://dhsprogram.com/Data/). Spectrum Version 4.68 was used to construct national HIV prevalence estimates based on ANC surveillance data from the Spectrum 2012 files, except in Cambodia, Vietnam and India. For these countries, we abstracted median national ANC surveillance estimates for the survey year from country reports [23–25] as India produces state and union territory-level Spectrum files only, whereas Vietnam and Cambodia use another UNAIDS-supported modelling tool to produce estimates. For the six states in India with population survey estimates, HIV prevalence estimates were constructed using ANC surveillance data from the Spectrum 2012 individual state files. In Vietnam, the median ANC estimate was from the same province as the population survey.
In countries with generalized epidemics, we used the r-spline option to fit the national prevalence curves based on ANC data alone, except in rural Ghana, where the r-trend option was used as it provided the only realistic fit. In concentrated epidemics, including the six states in India, trends were fit as specified by the country depending on the availability of data and the start year of the epidemic.
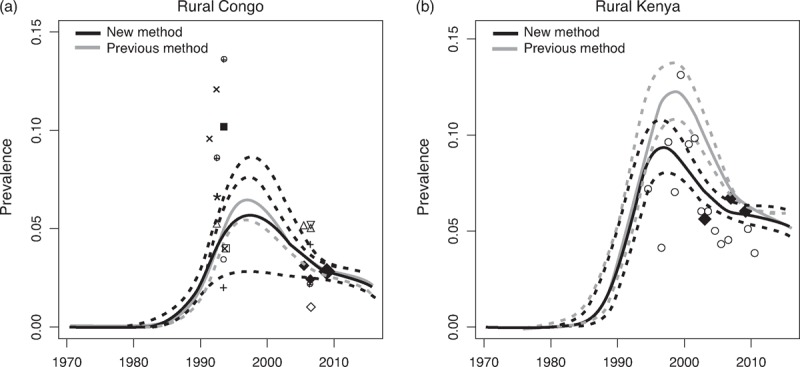
We calculated ratios of national population survey to ANC surveillance HIV prevalence estimates for each country and the national population survey year. In generalized epidemics, ratios were stratified by urban and rural areas. In concentrated epidemics, trends were fit as specified by the country depending on the availability of data and the start year of the epidemic. Because ANC prevalence data are typically analysed under the assumption that they are distributed approximately normally after transforming the data through a probit function, we accounted for variance in population survey and ANC data across countries using probit differences, calculated as follows: 
where P is the national population (NP) survey or ANC surveillance prevalence and Φ-1 is the inverse of the cumulative standard normal distribution. To detect changes in the relationship between estimates from these two data sources over time in countries with generalized epidemics and more than one survey, we constructed a multi-level longitudinal linear regression model of probit differences, allowing for differences in slope and intercept for regions and countries. Finally, to assess whether ANC surveillance data could be adjusted to reflect national population surveys, we applied the median regional ratios in countries with generalized epidemics and the overall median ratio in countries with concentrated epidemics to a country's ANC-based prevalence estimates. We then compared this adjusted estimate to the corresponding national population prevalence estimate. Analyses were conducted in Stata version 12.
Spectrum calibration
The original approach to calibrating the Spectrum model to match population-based survey prevalence estimates involved re-sampling prevalence curves after fitting the model to the ANC prevalence data [18]. The likelihood for ANC prevalence data (W) assumes normally distributed random errors for clinics on the probit scale:
where s denotes an ANC site, t denotes year, bs is the site-specific random effect and the error term, and εst approximates the binomial variation [26].
The steps of the original calibration algorithm are as follows:
Fit the model using the probit-space random-effects likelihood for ANC sites via incremental mixture importance sampling.
After fitting, calculate the calibration constant, c, as the difference between the median fitted modelled prevalence estimate and the population survey estimate of HIV prevalence.
Add c to each prevalence trajectory (on the probit scale).
Re-sample these scaled trajectories with weights proportional to a likelihood defined as a probit-space normal distribution for population survey prevalence point estimates and standard errors.
This approach succeeded in adjusting Spectrum prevalence curves fit to ANC data to match the national estimates. However, it has a few limitations: trends in survey data do not influence the initial model fit, which is increasingly important now that countries have multiple surveys; it assumes the calibration constant, c, is known with certainty, thus resulting in an underestimation of uncertainty around the calibrated prevalence trajectories; the re-sampling step could result in a poorly characterized posterior distribution if only a limited number of unique posterior draws were re-sampled; and appropriately re-scaled HIV incidence (as opposed to prevalence) curves are not produced directly from the calibration process.
To address these limitations, a new calibration approach was developed and implemented in Spectrum 2013 that involves estimating the calibration constant as part of the model-fitting procedure. To do this, the likelihood is expanded and the calibration constant, c, is estimated along with other model parameters. As before, a probit space, random-effects likelihood is used for the ANC data, but a parameter for the calibration constant, c, is also estimated and a second equation is added for the population survey data as follows: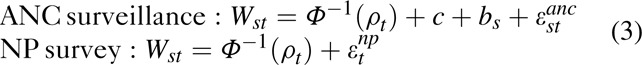
A diffuse prior for c is assumed to be distributed normally [c ∼ N(0.15,1)].
Although this approach can be used with any of the three options for modelling r within Spectrum, the methodology was developed using the r-spline model and implemented in R software [21], with later testing using the r-trend model [22]. HIV prevalence estimates from national population surveys and ANC surveillance time series data were obtained from UNAIDS for sub-regions of 20 countries with generalized epidemics: Burundi, Burkina Faso, Cameroun, Congo, Côte d’Ivoire, Democratic Republic of Congo, Ethiopia, Ghana, Haiti, Kenya, Lesotho, Malawi, Mali, Rwanda, Sierra Leone, Swaziland, Tanzania, Uganda, Zambia, and Zimbabwe. Data were used for development purposes and will not necessarily match official UNAIDS estimates.
Calibration for countries with generalized epidemics and no national population surveys
For countries with generalized epidemics but no national population surveys, we also developed an updated approach to calibrating prevalence curves derived from the ANC data in Spectrum 2013. As before [18], Spectrum is fit to ANC data, and then a calibration constant is added to each curve in the probit space. However, to better represent the larger degree of uncertainty in expected bias for ANC-based estimates for countries without a population survey, a distinct value for c is drawn for each re-sampled posterior draw of prevalence during calibration. Values for c are drawn from a normal distribution, which is parameterized with the regional median probit difference calculated in the empirical analysis described above, and a standard deviation (SD) calculated from the regional posterior distributions for c as estimated in Eq. (3).
Results
Empirical comparison of national population survey and antenatal care surveillance HIV prevalence
We identified 59 surveys from 34 countries between 1987 and 2012 that reported urban and rural or sex-specific HIV prevalence estimates. Of these, 49 were conducted in 25 countries with generalized epidemics. Only five countries in SSA (Angola, Eritrea, Gambia, Namibia and Togo) had not conducted or published data from a population survey at the time of this study. However, Eritrea subsequently released a report on a 2010 national population survey in August 2013, leaving only four countries in SSA without a national population survey.
In countries with generalized epidemics, the relationships between population survey and fitted median ANC surveillance estimates were highly variable across regions (Fig. 1a–c). For the most part, however, ANC prevalence overestimated population prevalence. In three urban areas – Democratic Republic of Congo, 2007; Mali, 2006 and Sierra Leone, 2005 – and six rural areas – Burundi, 1998, 2002, and 2010; Ethiopia, 2005; DRC, 2007; Liberia, 2007; Mali, 2006; and Sierra Leone, 2008 – ANC prevalence was more than two times greater than population prevalence (Supplemental Table 1). At the opposite extreme, in urban areas of Chad in 2005 and in rural areas of Côte d’Ivoire in 2012, ANC prevalence was just half that of the population prevalence. Comparison of ANC and national population survey trends across countries found no change in the slope of probit differences in urban areas over time [coefficient of annual change: 0.001, 95% confidence interval (CI) −0.0123, 0.015). In rural areas, an increasingly larger divergence between ANC surveillance and population survey estimates over time was identified (coefficient of annual change: 0.015, 95% CI 0.003, 0.027). The largest changes in the magnitude of bias across survey periods were observed for Burundi, Côte d’Ivoire, Ethiopia, Guinea and Kenya.
Fig. 1.
Ratio of adult HIV prevalence from national population surveys to prevalence derived from antenatal clinic surveillance data for the year in which the survey was conducted for (a) Southern Africa, (b) Eastern Africa and (c) Western and Central Africa.
ANC, antenatal care sentinel surveillance HIV prevalence estimates; NP, national population survey HIV prevalence estimates; SD, standard deviation.
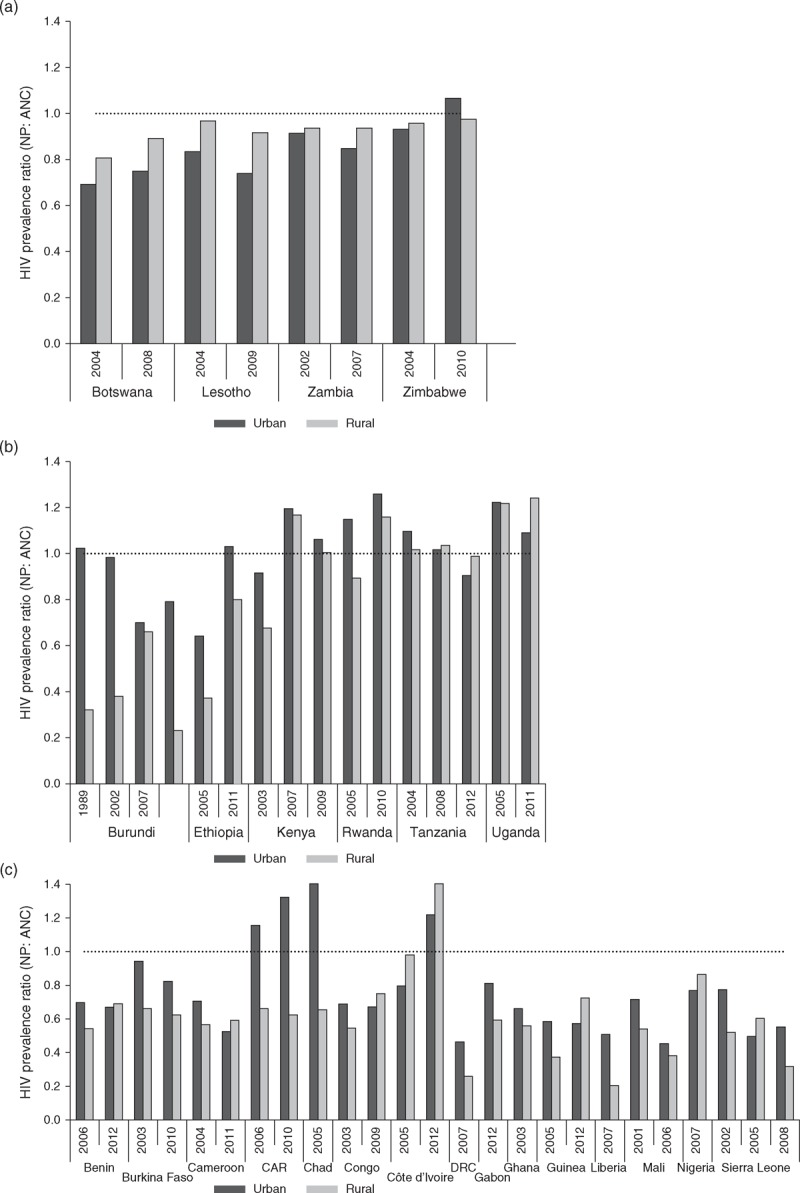
Similar to countries with generalized epidemics, ANC surveillance estimates more often overestimated population prevalence in concentrated epidemics, with similarly large variations in the magnitude of bias observed (Fig. 2). Despite this tendency, the most extreme bias in ANC estimates was observed in Mexico in 2002, 2006 and 2012, with a 4–10-fold excess in prevalence among men compared to pregnant women (Supplemental Table 2). Data from ANC surveillance also underestimated female population prevalence in Mexico in 2000 and 2012, and São Tomé and Príncipe in 2012, and male population prevalence in Manipur, India in 2006, Mexico in 2000, 2006 and 2012, São Tomé and Príncipe in 2009 and Vietnam in 2005.
Fig. 2.
Ratio of population-based adult HIV prevalence from national population surveys to prevalence derived from antenatal clinic data for the year in which the survey was conducted in concentrated epidemics.
aMedian ANC surveillance estimate for the survey year in Cambodia was abstracted from [23]. bMedian ANC surveillance estimate for India (national) was abstracted from [25]. cSex-specific estimates were not available for the 2012 DHS in Niger. dMedian ANC surveillance estimate for the survey year in Vietnam was extracted from [24]. ANC, antenatal care; NP, national population; SD, standard deviation.
Table 1 summarizes median ratios and probit differences from population survey and ANC prevalence comparisons in generalized and concentrated epidemics. In countries with generalized epidemics, overall and region-specific values are presented alongside SDs derived using the new calibration approach (results described in the following section). In countries with generalized epidemics, median bias in ANC surveillance data was greater in rural than urban areas (a 32 versus 19% overestimate, respectively). However, these results masked substantial regional variation, with larger biases across Western and Central Africa (30% overestimate in urban areas and 41% overestimate in rural areas). When the median regional values were used to adjust ANC prevalence estimates for countries with national population surveys, the adjusted ANC and national population survey estimates were similar (Supplemental Fig. 1a and b). In countries with concentrated epidemics, comparisons of population survey prevalence to ANC surveillance by sex showed a greater difference in women (53% downward reduction) as compared to men (44% downward reduction), although agreement between population survey data and the adjusted ANC data was poor, and especially so for men (Supplemental Fig. 2a and b).
Table 1.
Median ratios and probit differences of population survey (national population) and antenatal care surveillance HIV prevalence estimates for urban and rural areas in countries with generalized epidemics and for women and men in concentrated epidemics.
| Data source/region | NP : ANC median ratio | Median probit difference | Probit difference SD | |||
| Urban | Rural | Urban | Rural | Urban | Rural | |
| Countries with generalized epidemics | 0.81 | 0.68 | −0.11 | −0.17 | 0.14 | 0.22 |
| Eastern Africa | 1.02 | 0.94 | 0.01 | −0.03 | 0.14 | 0.24 |
| Southern Africa | 0.84 | 0.94 | −0.14 | −0.04 | 0.10 | 0.07 |
| Western/Central Africa | 0.70 | 0.59 | −0.17 | −0.24 | 0.13 | 0.22 |
| Women | Men | Women | Men | Women | Men | |
| Countries with concentrated epidemics | 0.47 | 0.56 | −0.27 | −0.22 | NA | NA |
ANC, antenatal care sentinel surveillance HIV prevalence estimate; NP, national population survey HIV prevalence estimate.
Performance of the new calibration approach
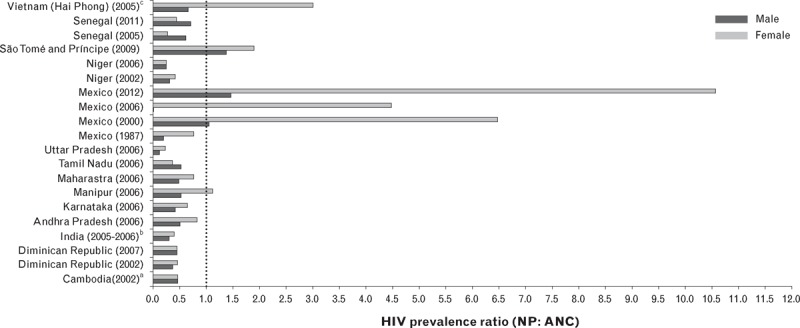
The new calibration approach in Spectrum that directly incorporates national population survey data into the likelihood for HIV prevalence performed well for the 42 sub-national epidemics where it was tested. Point estimates for prevalence obtained from the new, as compared to the old, calibration method were similar for the r-spline implementation (average root mean square error across countries = 0.003) between 1995 and 2012. Point estimates for c were also similar, with a correlation of 0.99. The new calibration approach resulted in greater uncertainty intervals around prevalence curves, with an average increase in the width of 95% uncertainty intervals of 44% (see example for rural Congo in Fig. 3a). The only epidemic with a substantially different fit between the two calibration approaches was for rural Kenya, for which three national population survey estimates were included in model fitting (Fig. 3b). Subsequent testing using the r-trend model yielded similar median estimates for the calibration constant as compared to those obtained with r-spline (correlation 0.98).
Fig. 3.
Illustrative examples of point estimates and 95% uncertainty intervals for HIV prevalence curves calibrated to national population-based survey prevalence estimates using old or new calibration method.
(a) Rural Congo; (b) rural Kenya. Large solid diamonds represent national population-based survey estimates for HIV prevalence. Smaller symbols denote HIV prevalence estimates from ANC surveillance sites. ANC, antenatal care.
Discussion
Results from this analysis provide evidence for an ongoing bias in population prevalence estimates based on ANC surveillance data, which may also be increasing over time in rural areas for countries with generalized epidemics. The largest bias was observed in countries in Western and Central Africa, where median ANC-fitted prevalence was 30% higher in urban areas and 41% higher in rural areas as compared to population survey estimates. Estimates from countries in Eastern Africa, and to some extent Southern Africa, had smaller differences. These results also suggest that the single urban and rural downward adjustment of 20% recommended in the past versions of Spectrum might have either over-adjusted or under-adjusted prevalence levels for the five countries without national population surveys, depending on the region. To better adjust for these biases in future versions of Spectrum for those countries with generalized epidemics that have not yet conducted a national population survey, the updated median regional probit differences as summarized in Table 1 have been incorporated into the new approach for calibrating models fit to ANC data in Spectrum 2013.
For countries with generalized epidemics and population survey data, our results show that the new approach to calibrating ANC surveillance data to prevalence estimates in Spectrum works well. In the majority of cases, the new calibration approach generated similar prevalence point estimates as compared to the previous method. The fact that this new approach had little impact on national estimates is not surprising given that most countries had only one or two national population surveys and the expanded likelihood used in the new approach is essentially a more parsimonious implementation of the likelihoods used in the previous two-step calibration procedure. This new approach also should improve the model's future capability to handle countries with three or more national population surveys.
The main implication of the new calibration approach is that uncertainty intervals for national prevalence estimates in Spectrum will be larger than previously calculated for countries with and without surveys. This is appropriate, as the previous approach assumed the average difference between ANC and population survey prevalence estimates was known with certainty. By estimating the calibration constant as part of the model-fitting process, the uncertainty around bias in ANC prevalence estimates is now reflected in the uncertainty intervals. This approach is also advantageous in that it yields an appropriately calibrated posterior distribution for all model parameters, and therefore all model output, such as incidence and antiretroviral therapy (ART) coverage. The primary limitation of this new approach, however, is that it leads to longer fitting times; typically about 30% more likelihoods must be calculated to reach model convergence.
A more general limitation of approaches thus far used to calibrate estimates in Spectrum is that the models assume a constant relationship between ANC and population prevalence over time. From empirical analyses presented here for rural areas, this assumption may not be correct. Possible reasons why trends in national population survey and ANC prevalence estimates could differ include: changing fertility patterns among young women [12,27], the scale-up of prevention programmes, including condom and other barrier contraception methods [4], changes in the distribution of new, and most importantly, prevalent HIV infections by age as the epidemic evolves [9], and increasingly important, the impact of dramatic scale-up of ART and prevention of mother-to-child transmission programmes, which can influence the fertility of the HIV-infected women [28–30]. Eaton et al.[31] further reinforce the need to reconsider this assumption within Spectrum. Results from their analysis of DHS data from 13 countries in SSA show an average 18% (95% CI −9 to 38%) steeper decline in prevalence among currently pregnant women as compared to all women for surveys conducted over two time periods: 2003–2008 and 2009–2012 [31]. Adjusting for age differences between the currently pregnant women and non-pregnant women did not reduce the decline substantially, suggesting other factors such as changes in fertility patterns, particularly due to ART, will be increasingly important to consider when interpreting national HIV prevalence trends based on ANC surveillance data.
Temporal changes in selection bias are not limited to ANC surveillance data alone, however, and it is possible that national population estimates may be differentially biased over survey periods, especially if participation is conditioned on HIV status. Although a study by Mishra et al.[32] using national population survey data from 14 countries suggested that the effect of non-participation bias on population estimates was likely to be minimal, more recent analyses using Heckmen-type selection models suggest that these biases may be considerably larger than previously estimated [33,34]. As the number of surveys increase within countries, calibration to an average value across all national population survey estimates may need to be reconsidered in future versions of Spectrum.
Whereas the relationship between national population survey and ANC surveillance estimates can be reasonably described for countries in SSA and the methods for calibrating ANC surveillance data are considered fairly robust, the same cannot be said for countries with concentrated epidemics. On the basis of national population surveys available through 2012, and in contrast with the previous study of surveys available through 2007, we found that the bias in ANC data to be larger when compared to women (53% overestimate) as compared to men (44% overestimate). With regard to the robustness of these findings, however, we found only moderate agreement between adjusted ANC and population prevalence for women and poor agreement between ANC estimates and population prevalence for men. Inconsistency in the relationship between ANC and population prevalence by sex across the six states in India also suggest that local dynamics of the epidemic within a country may be important to take into account. As a result, we recommend that countries with concentrated epidemics and no population surveys use local sex ratios to inform calibration of ANC surveillance estimates whenever feasible.
In conclusion, we found that important biases remain in ANC surveillance data for HIV prevalence, and we developed a more parsimonious approach to adjust Spectrum projections to match national estimates of HIV prevalence from population-based surveys. However, we also found that differences between ANC and population-based surveys may not be constant across time, suggesting additional research at the individual country level is needed to better understand these dynamics and how to account for them in Spectrum. The expanded likelihood implemented here suggests that additional sources of nationally representative information on HIV epidemics also could be incorporated into future versions of Spectrum to help improve the accuracy of its projections. In particular, data on HIV incidence or mortality could be included as additional likelihood components, providing a more comprehensive set of calibration targets than the current reliance on HIV prevalence estimates alone.
Acknowledgements
All authors contributed to developing the research questions and analysis plan. K.M. analysed the empirical national population survey and ANC surveillance data with input from M.M. D.H. and J.S. developed the new calibration approach for incorporating surveys directly into the model fitting. K.M. and D.H. each wrote the sections respective to their work, whereas K.M. organized and edited the draft based on contributions from M.M., J.S. and D.H. All authors read and approved the final manuscript.
The work was conducted under the guidance of members of the UNAIDS Reference Group on Estimates, Modelling and Projections. We are grateful for their input into the original analysis plans for this work and for discussions of preliminary results.
Sources of funding: UNAIDS.
Conflicts of interest
There are no conflicts of interest.
Supplementary Material
References
- 1.UNAIDS, WHO. A history of the HIV/AIDS epidemic with emphasis on Africa. Unpublished conference paper for the Workshop on HIV/AIDS and Adult Mortality in Developing Countries, New York, NY 2003. http://www.un.org/esa/population/publications/adultmort/UNAIDS_WHOPaper2.pdf [Accessed 12 March 2012]. [Google Scholar]
- 2.UNAIDS/WHO Working Group on Global HIV/AIDS and STI surveillance. Guidelines for conducting HIV sentinel serosurveys among pregnant women and other groups. 2003. http://data.unaids.org/publications/irc-pub06/jc954-anc-serosurveys_guidelines_en.pdf [Accessed 12 March 2012]. [Google Scholar]
- 3.UNAIDS/WHO Working Group on Global HIV/AIDS and STI Surveillance. Guidelines for second generation HIV surveillance: an update: know your epidemic. 2013. http://apps.who.int/iris/bitstream/10665/85511/1/9789241505826_eng.pdf?ua=1 [Accessed 24 September 2014]. [PubMed] [Google Scholar]
- 4.Gregson SAJ, Zaba B, Hunter S. The impact of HIV 1 on fertility in sub-Saharan Africa: causes and consequences. United Nations Population Division; 2003. http://www.un.org/esa/population/publications/completingfertility/RevisedZabapaper.PDF. [Accessed 24 September 2014]. [Google Scholar]
- 5.Zaba B, Gregson S. Measuring the impact of HIV on fertility in Africa. AIDS 1999; 12:S41–S50. [PubMed] [Google Scholar]
- 6.Ghys PD, Kufa E, George MV. Measuring trends in prevalence and incidence of HIV infection in countries with generalised epidemics. Sex Transm Infect 2006; 82:i52–i56. [DOI] [PMC free article] [PubMed] [Google Scholar]
- 7.García-Calleja JM, Gouws E, Ghys PD. National population based HIV prevalence surveys in sub-Saharan Africa: results and implications for HIV and AIDS estimates. Sex Transm Infect 2006; 82:iii64–iii70. [DOI] [PMC free article] [PubMed] [Google Scholar]
- 8.Fylkesnes K, Musonda RM, Sichone M, Ndhlovu Z, Tembo F, Monze M. Declining HIV prevalence and risk behaviours in Zambia: evidence from surveillance and population-based surveys. AIDS 2001; 15:907–916. [DOI] [PubMed] [Google Scholar]
- 9.Garnett G, Gregson S. Monitoring the course of the HIV-1 epidemic: the influence of patterns of fertility on HIV-1 prevalence estimates. Mathem Populat Stud 2000; 8:251–277. [Google Scholar]
- 10.Kwesigabo G, Killewo JZ, Urassa W, Mbena E, Mhalu F, Lugalla JL, et al. Monitoring of HIV-1 infection prevalence and trends in the general population using pregnant women as a sentinel population: 9 years experience from the Kagera region of Tanzania. JAIDS 2000; 23:410–417. [DOI] [PubMed] [Google Scholar]
- 11.Marsh K, Nyamukapa C, Donnelly CA, Garcia-Calleja T, Mushati P, Garnett GP, et al. Monitoring trends in HIV prevalence among young people, aged 15-24 years, in Manicaland, Zimbabwe. Journal of the International AIDS Society 2011; 14:e1–e11. [DOI] [PMC free article] [PubMed] [Google Scholar]
- 12.Zaba B, Boerma T, White R. Monitoring the AIDS epidemic using HIV prevalence data among young women attending antenatal clinics: prospects and problems. AIDS 2000; 14:1633–1645. [DOI] [PubMed] [Google Scholar]
- 13.UNAIDS/WHO Working Group on Global HIV/AIDS and STI Surveillance. Guidelines for measuring national HIV prevalence in population-based surveys. 2005. http://www.unaids.org/en/media/unaids/contentassets/dataimport/pub/manual/2005/20050101_gs_guidemeasuringpopulation_en.pdf [Accessed 24 March 2012]. [Google Scholar]
- 14.ICF International. HIV prevalence estimates from the Demographic and Health Surveys. Calverton, MD: ICF International; 2012. [Google Scholar]
- 15.Stover J. Projecting the demographic consequences of adult HIV prevalence trends: the Spectrum Projection Package. Sex Transm Infect 2004; 80 Suppl 1:i14–i18. [DOI] [PMC free article] [PubMed] [Google Scholar]
- 16.Improved methods and assumptions for estimation of the HIV/AIDS epidemic and its impact: recommendations of the UNAIDS Reference Group on Estimates, Modelling and Projections. AIDS 2002; 16:W1–W14. [DOI] [PubMed] [Google Scholar]
- 17.Brown T, Bao L, Eaton JW, Hogan DR, Mahy M, Marsh K, et al. Improvements in prevalence trend fitting and incidence estimation in EPP 2013. AIDS 2014; 28 Suppl 4:S415–S425. [DOI] [PMC free article] [PubMed] [Google Scholar]
- 18.Alkema L, Raftery AE, Brown T. Bayesian melding for estimating uncertainty in national HIV prevalence estimates. Sex Transm Infect 2008; 84 Suppl 1:i11–i16. [DOI] [PMC free article] [PubMed] [Google Scholar]
- 19.Gouws E, Mishra V, Fowler TB. Comparison of adult HIV prevalence from national population-based surveys and antenatal clinic surveillance in countries with generalised epidemics: implications for calibrating surveillance data. Sexual Transm Infect 2008; 84:i17–i23. [DOI] [PMC free article] [PubMed] [Google Scholar]
- 20.Hogan DR, Zaslavsky AM, Hammitt JK, Salomon JA. Flexible epidemiological model for estimates and short-term projections in generalised HIV/AIDS epidemics. Sex Transm Infect 2010; 86 Suppl 2:ii84–ii92. [DOI] [PMC free article] [PubMed] [Google Scholar]
- 21.Hogan DR, Salomon JA. Spline-based modelling of trends in the force of HIV infection, with application to the UNAIDS Estimation and Projection Package. Sex Transm Infect 2012; 88 Suppl 2:i52–i57. [DOI] [PMC free article] [PubMed] [Google Scholar]
- 22.Bao L. A new infectious disease model for estimating and projecting HIV/AIDS epidemics. Sex Transm Infect 2012; 88 Suppl 2:i58–i64. [DOI] [PMC free article] [PubMed] [Google Scholar]
- 23.National Center for HIV/AIDS, Dermatology, STDs. Report on HIV sentinel surveillance in Cambodia 2006. Phnom Penh, Cambodia: National Center for HIV/AIDS, Dermatology, STDs; 2006. [Google Scholar]
- 24.General Statistical Office. Vietnam Population and AIDS Indicator Survey, 2005. National Institute of Hygiene and Epidemiology (NIHE) [Vietnam], ORC Macro; 2006. [Google Scholar]
- 25.International Institute for Population Sciences (IIPS), Macro International. India National Family Health Survey (NFHS-3). 2005-2006. 2007. [Google Scholar]
- 26.Alkema L, Raferty AE, Clark SJ. Probabilistic projections of HIV prevalence using Bayesian melding. Ann Appl Stat 2007; 1:229–248. [Google Scholar]
- 27.Michelo C, Sandoy I, Dzekedzeke K, Siziya S, Fylkesnes K. Steep HIV prevalence declines among young people in selected Zambian communities: population-based observations (1995-2003). BMC Public Health 2006; 6:279. [DOI] [PMC free article] [PubMed] [Google Scholar]
- 28.Homsy J, Bunnell R, Moore D, King R, Malamba S, Nakityo R, et al. Reproductive intentions and outcomes among women on antiretroviral therapy in rural Uganda: a prospective cohort study. PLoS One 2009; 4:e4149. [DOI] [PMC free article] [PubMed] [Google Scholar]
- 29.Maier M, Andia I, Emenyonu N, Guzman D, Kaida A, Pepper L, et al. Antiretroviral therapy is associated with increased fertility desire, but not pregnancy or live birth, among HIV+ women in an early HIV treatment program in rural Uganda. AIDS Behav 2009; 13:28–37. [DOI] [PMC free article] [PubMed] [Google Scholar]
- 30.Kaida A, Andia I, Maier M, Strathdee SA, Bangsberg DR, Spiegel J, et al. The potential impact of antiretroviral therapy on fertility in sub-Saharan Africa. Curr HIV/AIDS Rep 2006; 3:187–194. [DOI] [PubMed] [Google Scholar]
- 31.Eaton JW, Rehle TM, Jooste S, Nkambule R, Kim AA, Mahy M, Hallett TB. Recent HIV prevalence trends among pregnant women and all women in sub-Saharan Africa: implications for HIV estimates. AIDS 2014; 28 Suppl 4:S507–514. [DOI] [PMC free article] [PubMed] [Google Scholar]
- 32.Mishra V, Barrere B, Hong R, Khan S. Evaluation of bias in HIV seroprevalence estimates from national household surveys. Sex Transm Infect 2008; 84:i63–i70. [DOI] [PMC free article] [PubMed] [Google Scholar]
- 33.Bärnighausen T, Bor J, Wandira-Kazibwe S, Canning D. Correcting HIV prevalence estimates for survey nonparticipation using Heckman-type selection models. Epidemiology 2011; 22:27–35. [DOI] [PubMed] [Google Scholar]
- 34.Hogan DR, Salomon JA, Canning D, Hammitt JK, Zaslavsky AM, Bärnighausen T. National HIV prevalence estimates for sub-Saharan Africa: controlling selection bias with Heckman-type selection models. Sexual Transm Infect 2012; 88:i17–i23. [DOI] [PMC free article] [PubMed] [Google Scholar]
Associated Data
This section collects any data citations, data availability statements, or supplementary materials included in this article.