Abstract
Background:
The Spectrum program is used to estimate key HIV indicators for national programmes. The purpose of the study is to describe the key updates made to Spectrum in the last 2 years to produce the version used in the 2013 global estimates of HIV/AIDS.
Methods:
The United Nations Programme on HIV/AIDS (UNAIDS) Reference Group on Estimates, Models and Projections regularly reviews new data and information needs and recommends updates to the methodology and assumptions used in Spectrum. The latest data from surveys, census and special studies are used to estimate key parameter values for countries and regions.
Results:
Country-specific life tables prepared by the United National Population Division (UNPD) have been incorporated into Spectrum's demographic projections replacing the model life tables used previously. This update includes revised estimates of non-AIDS life expectancy. Incidence among all adults 15–49 years generated from curve fitting to surveillance and survey data is now split by age using incidence rate ratios derived from Analysing Longitudinal Population-based HIV/AIDS data on Africa Network data for generalized epidemics. Methods for estimating the number of AIDS orphans have been updated to include the changing effects of PMTCT and antiretroviral therapy programmes. Procedures for estimating the number of adults eligible for treatment have been updated to reflect the 2013 WHO guidelines. Program data on AIDS mortality has been used to estimate prevalence trends in Argentina, Brazil and Mexico for the 2013 estimates.
Conclusion:
Spectrum was updated for the 2013 round of HIV estimates in order to support national programmes with improved methods and data to estimating national indicators.
Keywords: AIDS, estimates, HIV, modeling
Introduction
United Nations Programme on HIV/AIDS (UNAIDS) supports national programmes to make annual estimates of key HIV indicators. These estimates rely on national surveillance and survey data, national programme data as well as epidemic patterns derived from scientific studies. The Spectrum software is used to combine this information to produce estimates of key indicators, including the number of people living with HIV by age and sex, new infections, AIDS deaths, AIDS orphans, the need for treatment [antiretroviral therapy (ART), prophylaxis to prevent mother-to-child transmission and cotrimoxazole prophylaxis to prevent childhood infections], and the impact of treatment. Earlier updates to Spectrum and Epidemic Projection Package (EPP) have been published previously [1]. The purpose of this study is to describe the updates to Spectrum made in the last 2 years and used in the 2013 global estimates of HIV/AIDS.
The Spectrum/EPP program and manuals are updated regularly and available in multiple languages free of charge at www.FuturesInstitute.org. Model development has been funded primarily by United States Agency for International Development, UNAIDS and the Bill and Melinda Gates Foundation with technical collaboration from UNAIDS, WHO, United Nations Children's Fund, United Nations Population Division (UNPD), US Census Bureau, United Nations Population Fund, and other organizations.
Data used in spectrum HIV/AIDS projections
The HIV estimates produced using Spectrum rely on a number of data sources. These can be broadly categorized as 1) program data, 2) surveillance and survey data, and 3) global or regional epidemiological patterns. Table 1 shows the range of data inputs and the key sources. Demographic data are provided by the UNPD or national statistical bureaus. Other country-specific data include program data (number of people receiving treatment or prophylaxis) and surveillance and survey data collected nationally. Epidemiological parameter values are based on a variety of scientific studies including long-running cohort studies.
Table 1.
Key inputs to Spectrum estimates.
| Input | Source | References |
| Base year population by age and sex (1970) | World Population Prospects (WPP) 2012 or national estimates | United Nations [2] |
| Total fertility rate, 1970–2020 | WPP 2012 or national estimates | United Nations [2] |
| Non-AIDS life expectancy by sex, 1970–2020 | Countries with low levels of HIV: WPP 2012; Countries with high levels of HIV: Estimated from WPP 2012 all-cause mortality and Spectrum estimates of AIDS mortality | United Nations [2], Methods described in this article |
| Migration by age and sex, 1970–2020 | WPP 2012 | United Nations [2] |
| Breastfeeding rates by age of child among HIV+ women | Demographic and Health Surveys | |
| Number of HIV+ pregnant women receiving PMTCT, by regimen and year | National program data | |
| Number of HIV+ adults receiving ART by sex and year | National program data | |
| Number of HIV+ children receiving ART by year | National program data | |
| Number of HIV+ children receiving cotrimoxazole by year | National program data | |
| Criteria for ART eligibility by year | National program guidelines | |
| Progression rates by CD4+ cell count among HIV+ adults by age group (15–24, 25–34, 35–44, 45+) | Estimated to fit median survival time with HIV from ALPHA network | Todd [3], Marston [4] |
| Annual probability of adult HIV-related mortality without treatment, by CD4+ cell count and age | Estimated to fit median survival time with HIV from ALPHA network | Todd [3], Marston [4] |
| Annual mortality among HIV+ adults on ART by sex, age and CD4+ cell count at treatment initiation | IeDEA Consortium | Yiannoutsos [5] |
| Mother-to-child transmission rates by regimen (perinatal and postnatal) | Analysis of trials | Rollins [6] |
| Survival of HIV+ children without treatment | Analysis of child cohort data | Marston [7] Stover [1] |
| Effects of ART and cotrimoxazole on survival of HIV+ children | Expert review of available studies | UNAIDS [8] |
| Effects of HIV infection on fertility by age | Analysis of data from Demographic and Health Surveys | Chen [9] |
| Surveillance data by site, year, and population group | National program surveillance reports | |
| Survey data on HIV prevalence by age and sex | Demographic and Health Surveys, AIDS Indicator Surveys, other national survey | |
| Ratio of female to male prevalence | Demographic and Health Surveys, AIDS Indicator Surveys, other national survey | |
| Incidence rate ratios | ALPHA Network | Described in this article |
ALPHA, Analysing Longitudinal Population-based HIV/AIDS data on Africa; ART, antiretroviral therapy; IeDEA, International Epidemiologic Databases to Evaluate AIDS; PMTCT, Prevention of mother-to-child transmission.
Demographic estimates and projections
The UNPD produces population estimates and projections for every country in the world every 2 years. The results of the latest 2012 World Population Prospects [2] are included in Spectrum and used by most national programmes for their national estimates. Spectrum uses the information on population size by age and sex in 1970 and fertility, mortality, and migration rates from 1970 to 2020. Previous versions of Spectrum used model life tables to estimate non-AIDS mortality by age from UNPD estimates of non-AIDS life expectancy at birth. UNPD currently focuses on producing estimates of all-cause mortality. It produces country-specific life tables for all countries that rely on model life tables when good data on mortality are not available and on empirical estimates of mortality when data are available. The sources used by UNPD to estimate all-cause mortality include: household surveys, censuses, demographic surveillance sites, sample registration systems, and civil registration systems. In countries with few AIDS deaths, there will be very little difference between all-cause and non-AIDS mortality. However, for 34 countries (Angola, Bahamas, Belize, Botswana, Burkina Faso, Burundi, Cameroon, Central African Republic, Chad, Congo, Cote d’Ivoire, Djibouti, Democratic Republic of the Congo, Equatorial Guinea, Eritrea, Ethiopia, Gabon, Gambia, Ghana, Guinea, Guinea-Bissau, Haiti, Jamaica, Keya, Lesotho, Liberia, Malawi, Mali, Mozambique, Namibia, Nigeria, Rwanda, Sierra Leone, South Africa, South Sudan, Swaziland, Thailand, Togo, Uganda, United Republic of Tanzania, Zambia, and Zimbabwe) HIV mortality significantly affects the age pattern of mortality.
In countries with significant AIDS mortality, we have estimated non-AIDS mortality by determining the trend in non-AIDS life expectancy (the life expectancy of those who are not infected with HIV) that, when combined with Spectrum's estimates of AIDS deaths, will match the all-cause mortality estimated by UNPD. Model life tables are used to specify the age pattern of non-AIDS mortality. For each country, we have used the same model life table that was previously determined by UNPD to best fit non-AIDS mortality. (Over the past several rounds of estimates, UNPD has been gradually moving to using country-specific life tables for more and more countries, but through the last round, still provided for use in Spectrum a list of the model life table from the Coale-Demeny or United Nations model tables that best fit the mortality pattern in each country.) We used these model life tables and modified life expectancy at birth on the non-AIDS life expectancy to match the UNPD estimates of all-cause mortality.
Figure 1a illustrates this process for Zambia. The estimated trend in all-cause life expectancy is prepared by UNPD based on available empirical estimates of mortality. The trend in non-AIDS life expectancy was calculated so that when AIDS deaths are added, the total mortality will match the UNPD mortality estimates. Differences in the age pattern of mortality in 2013 are shown in Fig. 1b.
Fig. 1.
Mortality in Malawi with and without AIDS.
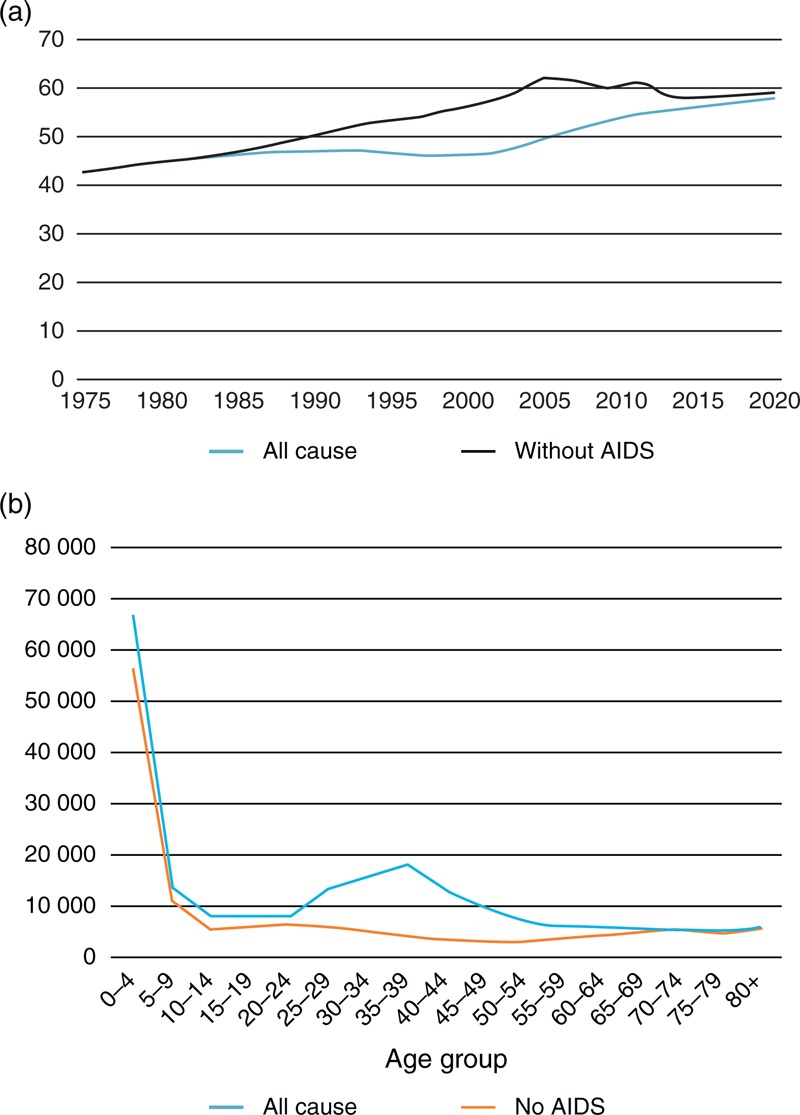
(a) Life expectancy at birth in Zambia with and without AIDS mortality. (b) Estimated number of deaths in 2003 by age in Zambia from all causes and non-AIDS causes.
Number of adults and children eligible for antiretroviral therapy
New treatment guidelines issued by WHO in 2013 [10] added additional categories of people eligible for treatment. The new guidelines recommend treatment for all HIV+ adults with CD4+ cell counts less than 500 cells/μl, and all HIV+ pregnant women, those coinfected with tuberculosis and HIV, HIV-infected adults with hepatitis B infection and severe liver disease, and those in serodiscordant partnerships. For children, eligibility is recommended for all HIV+ children up to 5 years of age and those above the age of 5 with CD4+ cell counts below 500 cells/μl. Spectrum estimates the size of each of these population groups as described below.
CD4+ cell count. Spectrum tracks new HIV infections among adults as they progress through CD4+ categories, starting from greater than 500 cells/μl and progressing to 350–500, 250–349, 200–249, 100–199, 50–99, and less than 50. Therefore, estimates of the number of HIV+ adults by CD4+ cell count are readily available to estimate eligibility.
Pregnant women. The current number of HIV+ pregnant women is estimated from the age-specific HIV prevalence among women of reproductive age, age-specific fertility rates, and age-specific reductions in fertility due to HIV infection [9].
Tuberculosis/HIV coinfections. The proportion of HIV+ adults who are coinfected with TB is estimated from surveys among HIV-infected populations and the dynamics of HIV and tuberculosis. A description of the data and methods is provided in the study by Pretorius, et al.[11] in this supplement.
Serodiscordant couples. The percentage of HIV+ adults that are in stable discordant partnerships is estimated based on data from Demographic and Health Survey and analyzed by Chemaitelly, et al.[12] for 22 countries in sub-Saharan Africa. Using these data, we calculated a regression equation to estimate the percentage of HIV+ adults in serodiscordant partnerships from HIV prevalence among all adults 15–49 years.
y = 44.322e−0.047xP(R2 = 0.944)
In this equation, y is the percentage of all HIV+ adults that are in stable, serodiscordant partnerships and P is HIV prevalence among adults 15–49 years. The relationship is shown in Fig. 2. Note that this equation estimates the percentage of all HIV+ who are in serodiscordant partnerships. This is different from the figures in most Demographic and Health Survey reports that show HIV prevalence among stable couples which are much lower.
Fig. 2.
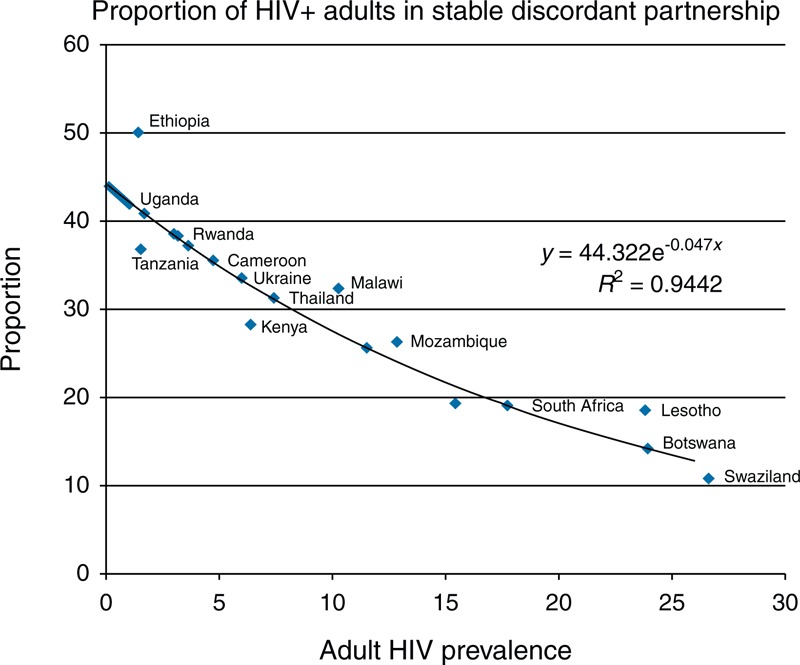
Percentage of HIV+ adults in serodiscordant stable partnerships versus adult HIV prevalence.
These methods are used in Spectrum to estimate the number of HIV+ adults under any set of eligibility criteria.
Incidence rate ratios
Data from five of the longitudinal study sites that participate in the network for Analysing Longitudinal Population-based HIV/AIDS data on Africa (ALPHA) [13] were used to estimate incidence rate ratios (IRR) by 5-year age group. Data were contributed from studies in Malawi (Karonga), Tanzania (Kisesa), Zimbabwe (Manicaland), Uganda (Masaka, Rakai), and South Africa (uMkhanyakude).
All these studies have repeated HIV status data based on research blood antibody tests carried out at regular surveys. The interval between surveys ranges from 12 to 40 months, varying by site and over time. An incident case of HIV infection is defined as a person who tested positive for HIV in a research test after having previously tested negative in the study and who was resident in the study area at the time of both tests. People who were positive when first tested in the study (prevalent cases) were excluded from the analysis, with the exception of young people aged less than 20 years, who are assumed to be negative on their 15th birthday and are included if they were resident at the time of the previous serosurvey but were too young to be eligible.
The date of seroconversion is unknown (interval censored) and must be imputed. The midpoint of the seroconversion interval, between last negative and first positive test dates, is the most common assumption but this leads to a heaping of seroconversion dates in the months that lie midway between two survey rounds, which can perturb estimates of incidence rates by calendar time. Therefore we used multiple imputation to assign dates of seroconversion, randomly allocating a date within the seroconversion interval with a constant hazard throughout the interval. Estimates were based on 50 imputations. IRR for 5-year age groups were estimated from a piecewise exponential model stratified by study site and sex.
For consistency with other ALPHA analyses, person time after the last negative HIV test was censored at the point after which 5% of individuals may have seroconverted. This varied by site and ranged from 2 to 5 years.
To derive a single set of IRRs for use in Spectrum, it was necessary to pool the results from the six studies. The Demographic Surveillance System populations are complete enumerations of small purposely selected populations rather than random samples, and thus, may not be representative of wider populations. The number of adults included in surveillance varies between sites from about 22 000 to 81 000, which precludes pooling unweighted individual level data. Furthermore, these independent studies have had different histories and fieldwork methods and are undertaken in different epidemic settings. We therefore used random effects meta-analysis to estimate the average of the true IRRs.
All analysis was carried out in Stata 13. Incidence rates and IRR between 1997 and 2012 were estimated. No single site contributed data to that entire range and one site (Karonga Stata, College Station, Texas, USA) contributed data over a limited time period and therefore had no time trend data.
Table 2 shows the number of adults aged 15–49 years who contributed data to the incidence analysis and the crude incidence rates between 1997 and 2012.
Table 2.
Data available for analysis: dates covered, number of men and women contributing data and the crude HIV incidence rate by site.
| Study | Effective date range for incidence estimates | Individuals | Number contributing to incidence analysis | Crude incidence rate (/100 person-years) | ||
| Men | Women | Men | Women | |||
| Karonga | 2008–2010 | 27 038 | 4584 | 5785 | 0.25 | 0.39 |
| Kisesa | 1997–2012 | 46 656 | 3830 | 4534 | 0.80 | 0.80 |
| Manicaland | 2000–2011 | 60 022 | 4323 | 6272 | 1.23 | 1.26 |
| Masaka | 1997–2012 | 21 986 | 6034 | 6922 | 0.58 | 0.69 |
| Rakai | 2000–2010 | 63 584 | 9941 | 12 135 | 0.97 | 1.07 |
| uMkhanyakude | 2005–2012 | 81 258 | 5841 | 8511 | 2.46 | 5.44 |
Table 3 gives the average IRR, based on random effects meta-analysis, by age group and sex (baseline: 25–29-year olds for each sex). Figure 3 shows the IRR by age group over the three calendar periods for each sex. There has been a dramatic decline in the IRR for 15–19-year-old women between the late 1990s and the late 2010s such that the incidence for the youngest women is now likely to be appreciably lower than that in 25–29-year-old women. There is little difference in the incidence rates of women in their early and late 20s but incidence is lower in women aged 30 and above.
Table 3.
Incidence rate ratios for men and women by calendar period and age group. (The 25–29 age group is the reference age group).
| Age group | 1997–2001 | 2002–2007 | 2008–2012 | |||
| IRR | 95% CI | IRR | 95% CI | IRR | 95% CI | |
| Men | ||||||
| 15–19 | 0.45 | 0.19–1.07 | 0.24 | 0.14–0.41 | 0.16 | 0.10–0.26 |
| 20–24 | 0.86 | 0.44–1.69 | 0.78 | 0.54–1.11 | 0.75 | 0.55–1.03 |
| 25–29 | 1 | 1 | 1 | |||
| 30–34 | 0.91 | 0.42–1.98 | 0.69 | 0.45–1.05 | 1.04 | 0.67–1.62 |
| 35–39 | 0.67 | 0.25–1.76 | 0.71 | 0.46–1.11 | 0.89 | 0.60–1.32 |
| 40–44 | 0.86 | 0.38–1.93 | 0.76 | 0.43–1.33 | 0.62 | 0.38–1.01 |
| 45–49 | 1.25 | 0.11–14.60 | 0.53 | 0.25–1.11 | 0.64 | 0.26–1.56 |
| Women | ||||||
| 15–19 | 1.21 | 0.58–2.50 | 0.69 | 0.49–0.97 | 0.61 | 0.46–0.81 |
| 20–24 | 1.17 | 0.58–2.34 | 0.99 | 0.74–1.31 | 1.10 | 0.90–1.35 |
| 25–29 | 1 | 1 | 1 | |||
| 30–34 | 0.89 | 0.35–2.29 | 0.72 | 0.50–1.05 | 0.74 | 0.57–0.96 |
| 35–39 | 0.68 | 0.23–2.02 | 0.61 | 0.39–0.97 | 0.52 | 0.34–0.79 |
| 40–44 | 0.86 | 0.28–2.64 | 0.40 | 0.25–0.64 | 0.45 | 0.31–0.66 |
| 45–49 | 0.72 | 0.15–3.41 | 0.29 | 0.16–0.55 | 0.33 | 0.21–0.53 |
CI, confidence interval; IRR, incidence rate ratios.
Fig. 3.
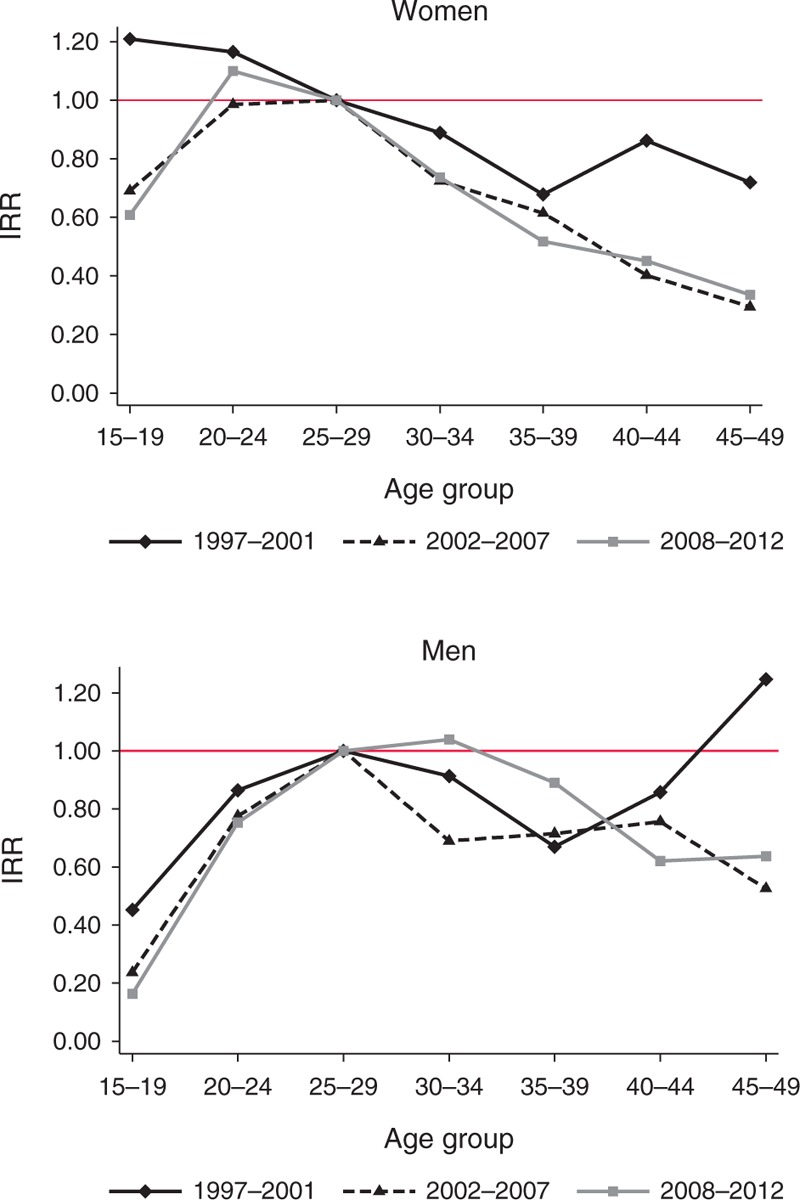
Incidence rate ratios by sex, age, and time period.
Incidence is lower among 15–19-year-old compared with 25–29-year-old men, and that difference has become more pronounced over time. Incidence has declined somewhat in 25–29–year-old men but has not fallen to the same extent among men in their 30s and in some sites it has risen, moving the IRR for these men closer to 1.
Estimation of AIDS orphans
Spectrum estimates the number of maternal, paternal, and double orphans using the methods first developed by Grassly and Timaeus [14] and later updated [15,16]. The calculation of the number of AIDS orphans assumed stable patterns for mother-to-child transmission, effects of HIV infection on fertility and mortality among HIV-infected adults and children. In recent years, the expansion of programmes to prevent mother-to-child transmission and antiretroviral treatment has changed historical patterns of mortality and the fertility-inhibiting effects of HIV infection [17,18]. Therefore, we modified the methodology for estimation of AIDS orphans to account for these dynamics.
Maternal AIDS orphans
The number of AIDS orphans for a woman at age â at death and CD4+ cell count category i (at death if the woman was not on ART, and at ART initiation if the woman was on ART) was estimated as the sum of surviving children born before infection (Ω′t,â,i), during infection when not on ART (Ω″t,â,i), and, if the woman was on ART, during infection when on ART (Ω‴t,â,i), (Fig. 4) using, 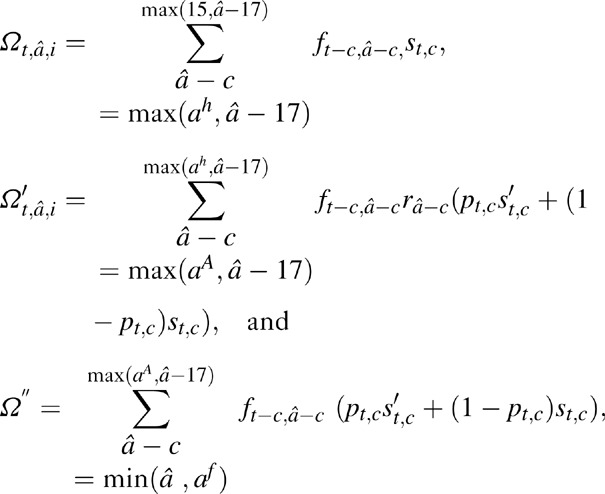
Fig. 4.
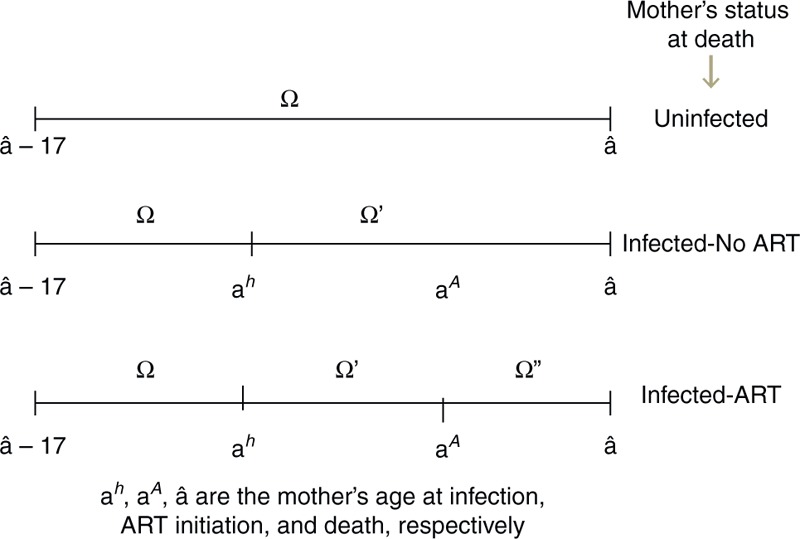
Schematic representation of surviving orphans born during different time periods of mother's life based on HIV-status of mother at time of death.
where, c is the age of child at time t, ft,a are the fertility rates at time t in women of age a, and st,a are the cumulative survival probability to age a at time t for children not infected with HIV, ra are the relative reduction in fertility rates due to HIV infection in women at age a[9], pt,c are probability values that a child of age c at time t had acquired HIV from vertical transmission, and Śc are the probability values that a child infected through vertical transmission survives to age c. Note that orphans are defined to be children under the age of 18 who have lost or both parents. Thus, in these equations we only consider children who will age 17 or younger at time t.
The mother's age at infection, ah, and age at ART initiation, aA, are calculated as follows. We used a look-up matrix of constant values (M) to determine age at infection (ah). For a woman not on ART, and at age â and CD4+ cell count category i at death, if matrix element m(a, i) equals â, then age at infection ah = aâ,ih = a. To generate M, we assumed exponentially distributed rates of transition μi from CD4+ cell count category i to i + 1 [1], and estimated m(a, i) as the average age of a person in CD4+ count category i given age at infection equals a. That is,  , where, xi are instances of random variables Xi∼ exp(μi) and n is a large referring to sample size (we assumed n = 1000).
For women on ART at time of death, to estimate age at ART initiation, we generated a constant duration-matrix L such that the matrix-elements l(t,i) represent the average duration on ART at year t for women starting ART at CD4+ count category i, that is,
where, N″t,a,i and D″t,a,i are the number of surviving persons on ART and number of deaths, respectively, at year t among women of age a and CD4+ count category at ART initiation of i. For women with age â at death, we approximate age at ART initiation aA = aA t,â,i = â − l(t,i) and, given matrix element m(a,i) = â − l(t,i), approximate age at infection ah = ahâ,i = a.
The total number of new AIDS orphans from all women dying at time t was estimated as 
where, D′ t, â, i are the number of deaths at time t in women of age â, at CD4+ cell count category i, and not on ART, and D″ t, â, i are the number of deaths at time t in women of age â with CD4+ count category i at ART initiation.
Paternal AIDS orphans
Similar to the method in maternal AIDS orphans, the total number of paternal AIDS orphans were estimated as, 
where,  are the surviving children born to men before they were infected, during infection when not on ART, and, for men on ART, during infection when on ART, respectively.
  are the number of deaths at time t in men of age a, at CD4+ cell count category i, and not on ART, and D″
t, â, i are the number of deaths at time t in men of age a with CD4+ cell count category i at ART initiation. As in maternal AIDS orphans, ah and aA represent aAt,â,i (age at infection) and ahâ, i (age at ART initiation), respectively, and were estimated as in the case of women. Pt(ws|ms) are the conditional probability of HIV status of the mother given the HIV status of the father, which were estimated using the procedure in [1].
Adjusting incidence trends to match program data
Trends in HIV prevalence and incidence are estimated in Spectrum by fitting curves to surveillance and survey data [19]. This approach is appropriate in countries that have relatively good surveillance and survey data for the general population as in many countries in sub-Saharan Africa and for those countries with concentrated epidemics with good surveillance among key populations as in many countries in Asia. In many of these countries, vital statistics on AIDS deaths may suffer from significant underreporting and cannot be used in prevalence and incidence estimation. In Latin America, HIV surveillance is not widely implemented but vital registration of deaths and program monitoring of HIV patients is relatively strong. Many countries in the region have good estimates of the numbers of deaths due to HIV/AIDS developed by adjusting recorded AIDS deaths for misclassification of cause of death [20]. In addition, many countries have estimates of the number of people living with HIV and on new HIV diagnoses based on case-report systems. Brazil estimates the number of people living with HIV by adding the number of people on ART and the number known to be HIV+ but not yet started on ART, and adds a percentage estimate of those who are HIV+ but not yet identified based on estimates of unknown status in the United States. Argentina adjusts data on the number HIV+ by the proportion of AIDS deaths that occurred to people who were not recorded as being HIV infected.
Although these estimates have some shortcomings in many countries, they may be better indicators of the epidemic dynamics than surveillance data. In Argentina, Brazil, and Mexico, incidence trends based on surveillance data have been modified to better match program estimates of the number of people living with HIV, the number of new cases of HIV, and HIV-related mortality. In some cases, this is accomplished simply by moving the entire incidence curve up or down. In others cases, it involves changing the shape of the incidence curve, particularly in the years before surveillance data began. The incidence curve is modeled as a double logistics function of the form:
Where:
α = rate of increase at the beginning of the trend
β = rate of convergence to the asymptote
t0 = the time of the inflexion point
a = peak incidence value
b = asymptote
Changes in the parameter values were made by hand to improve the fit to program data. In future versions of Spectrum, we intend to automate the process of finding the incidence curve that allows Spectrum to best fit to program data.
An example for Mexico is provided in Fig. 5. In general, these adjustments have resulted in incidence curves that are lower and with flatter peaks than those based solely on surveillance data.
Fig. 5.
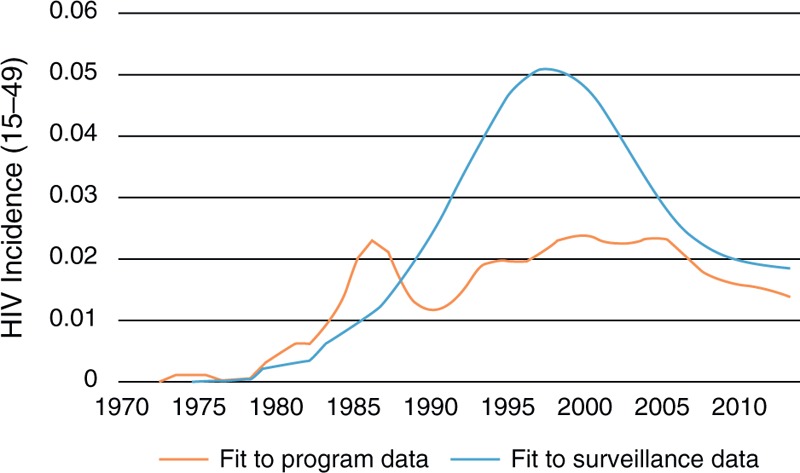
Incidence trends in Mexico derived from fitting to surveillance data on prevalence by risk group and by fitting to program data on AIDS deaths, people living with HIV and new cases identified.
Conclusion
The UNAIDS Reference Group on Estimates, Models and Projections regularly reviews the methods used to estimate key HIV indicators and indicates areas for improvement. The 2013 round of estimates uses new approaches and data to improve estimates of demographic change, the number eligible for ART, AIDS orphans, and the age distribution of incidence.
Acknowledgements
Conflicts of interest
The views expressed in the paper are those of the authors and are not necessarily those of the United Nations.
There are no conflicts of interest.
References
- 1.Stover J, Brown T, Marston M. Updates to the Spectrum/Estimation and Projection Package (EPP) model to estimate HIV trends for adults and children (2012). Sex Trans Infect 2012; 88:i11–ii16doi:10.1136/sextrans-2012-050640. [DOI] [PMC free article] [PubMed] [Google Scholar]
- 2.United Nations, Department of Economic and Social Affairs, Population Division (2013). World Population Prospects: The 2012 Revision, Volume I: Comprehensive Tables. [Google Scholar]
- 3.Todd J, Glynn J, Marston M, Lutalo T, Biraro S, Mwita W, et al. Time from HIV seroconversion to death: a collaborative analysis of eight studies in six low and middle income countries before highly active antiretroviral therapy. AIDS 2007; 21 Suppl 6:S55–S63. [DOI] [PMC free article] [PubMed] [Google Scholar]
- 4.Marston M, Todd J, Glynn JR, Nelson KE, Rangsin R, Lutalo T, et al. Estimating ‘net’ HIV-related mortality and the importance of background mortality rates. AIDS 2007; 21 Suppl 6:S65–S71. [DOI] [PMC free article] [PubMed] [Google Scholar]
- 5.Yiannoutsos CT, Johnson LF, Boulle A, Musick BS, Gsponer E, Balestre E, et al. Estimated mortality of adult HIV-infected patients starting treatment with combination antiretroviral therapy. Sex Transm Infect 2012; 88:i33–i43doi:10.1136/sextrans-2012-050658. [DOI] [PMC free article] [PubMed] [Google Scholar]
- 6.Rollins N, Mahy M, Becquet R, Kuhn L, Creek T, Mofenson L. Estimates of peripartum and postnatal mother-to-child transmission probabilities of HIV for use in Spectrum and other population-based models. Sex Transm Infect 2012; 88:i44–i51. [DOI] [PMC free article] [PubMed] [Google Scholar]
- 7.Martson M, Becquet R, Zaba B, Mouton LH, Gray G, Coovadia H, et al. Net survival of perinatally and postnatally HIV-infected children: a pooled analysis of individual data from sub-Saharan Africa. Int J Epidemiol 2011; 40:385–396. [DOI] [PMC free article] [PubMed] [Google Scholar]
- 8.UNAIDS. Consultative Meeting on Data Collection and Estimation Methods Related to HIV Infection in Infants and Children. New York: UNAIDS, UNICEF, WHO; July 8–10 July, 2008. [Google Scholar]
- 9.Chen WJ, Walker N. Fertility of HIV-infected women: insights from Demographic and Health Surveys. Sex Transm Infect 2010; 86:ii22–ii27. [DOI] [PMC free article] [PubMed] [Google Scholar]
- 10.ST/ESA/SER.A/336.World Health Organization. Consolidated guidelines on the use of antiretroviral drugs for treating and preventing HIV infection. Geneva: World Health Organization; 2013, www.who.int/hiv/pub/guidelines/arv2013 [Accessed 26 January 2014.]. [Google Scholar]
- 11.Pretorius C, Glaziou P, Dodd PJ, White R, Houben R. Using the TIME model in Spectrum to estimate tuberculosis–HIV incidence and mortality. AIDS 2014; 28 Suppl 4:S477–S487. [DOI] [PMC free article] [PubMed] [Google Scholar]
- 12.Chemaitelly H, Cremin I, Shelton J, Hallett TB, Abu-Raddad LJ. Distinct HIV discordancy patterns by epidemic size in stable partnerships in sub-Saharan Africa. Sex Transm Infect 2012; 88:51e57.doi:10.1136/sextrans-2011-050114. [DOI] [PMC free article] [PubMed] [Google Scholar]
- 13.Maher D, Biraro S, Hosegood V, Isingo R, Lutalo T, Mushati P, et al. Collaborators in ALPHA Network. Translating global health research aims into action: the example of the ALPHA network. Trop Med Int Health 2010; 15:321–328doi: 10.1111/j.1365-3156.2009.02456.x. Epub 2010 Jan 11. [DOI] [PubMed] [Google Scholar]
- 14.Grassly NC, Timaeus IM. Methods to estimate the number of orphans as a result of AIDS and other causes in Sub-Saharan Africa. J Acquir Immune Defic Syndr 2005; 39:365–375. [DOI] [PubMed] [Google Scholar]
- 15.Stover J, Johnson P, Hallett T, Marston M, Becquet R, Timeaus IM. The Spectrum projection package: improvements in estimating incidence by age and sex, mother-to-child transmission, HIV progression in children and double orphans. Sex Transm Infect 2010; 86 Suppl 2:ii16–ii21. [DOI] [PMC free article] [PubMed] [Google Scholar]
- 16.Timaeus IM. Estimation and progression of dual orphans in populations with generalized HIV epidemics: Updated methods, Report to UNAIDS, 24 April 2008. London [Google Scholar]
- 17.Myer L, Carter RJ, Katyal M, Toro P, El-Sadr W, Abrams E. Impact of antiretroviral therapy on incidence of pregnancy among HIV-infected women in Sub-Saharan Africa: a cohort study. PLoS Med 2010; 7:e1000229. [DOI] [PMC free article] [PubMed] [Google Scholar]
- 18.Homsy J, Bunnell R, Moore D, King R, Malamba S, Nakityo R, et al. Reproductive intentions and outcomes among women on antiretroviral therapy in rural Uganda: a prospective cohort study. PLoS One 2009; 4:e4149. [DOI] [PMC free article] [PubMed] [Google Scholar]
- 19.Brown T, Bao L, Raferty A, Salomon JA, Baggaley RF, Stover J, Gerland P. Modelling HIV epidemics in the antiretroviral era: the UNAIDS Estimation and Projection package 2009. Sex Transm Infect 2010; 86 Suppl 2:ii3–ii10doi:10.1136/sti.2010.044784. [DOI] [PMC free article] [PubMed] [Google Scholar]
- 20.Fazito E, Cuchi P, Ma Fat D, Ghys PD, Pereira MG, Vasconcelos AMN, Pascom ARP. Identifying and quantifying misclassified and under-reported AIDS deaths in Brazil: a retrospective analysis from 1985 to 2009. Sex Transm Infect 2012; 88:i86–i94doi:10.1136/sextrans-2012-050632. [DOI] [PMC free article] [PubMed] [Google Scholar]


