

Abstract
Objectives:
Reliable estimates of the joint burden of HIV and tuberculosis epidemics are crucial to planning strategic global and national tuberculosis responses. Prior to the Global Tuberculosis Report 2013, the Global Tuberculosis Programme (GTB) released estimates for tuberculosis–HIV incidence at the global level only. Neither GTB nor United Nations Programme on HIV/AIDS (UNAIDS) published country specific estimates for tuberculosis–HIV mortality. We used a regression approach that combined all available data from GTB and UNAIDS in order to estimate tuberculosis–HIV incidence and mortality at country level.
Methods:
A regression method was devised to relate CD4 dynamics (based on national Spectrum files) to an increased relative risk (RR) of tuberculosis disease. The objective function is based on least squares and incorporates all available country-level estimates of tuberculosis–HIV incidence. Global regression parameters, obtained from averaging results over countries with population survey estimates for tuberculosis–HIV burden, were applied to countries with no survey tuberculosis–HIV incidence estimates.
Results:
The method produced results that are in reasonably close agreement with existing GTB estimates for global tuberculosis–HIV burden. It estimated that tuberculosis–HIV accounts for 12.6% of global tuberculosis incidence, 21.3% of all tuberculosis deaths, and 20% of all HIV deaths as estimated by the Spectrum AIDS Impact Module (AIM). Regional estimates show the highest absolute incidence burden in East and Southeast Asia, and the highest per capita burden in sub-Saharan Africa, where between 12.5% (Central sub-Saharan Africa) and 60.6% (Southern sub-Saharan Africa) of all tuberculosis disease occurs in people living with HIV (PLWH). Tuberculosis mortality follows a similar pattern, except that a disproportionate percentage of global tuberculosis deaths (12.1%) relative to global incidence (8.7%) occurred in Southern sub-Saharan Africa.
Conclusion:
The disaggregation of tuberculosis incidence using a regression method on RR of tuberculosis disease and all available data on HIV burden (from UNAIDS) and tuberculosis–HIV testing (survey, sentinel and routine surveillance data) produces results that closely match GTB estimates for 2011. The tuberculosis–HIV incidence and mortality results were published in the Global Tuberculosis Report 2013. Several limitations of and potential improvements to the process are suggested.
Keywords: estimates, HIV, regression model, tuberculosis
Introduction
HIV and tuberculosis remain two of the most challenging global public health problems for national and global planners alike. According to the Global Tuberculosis Report 2013 [1], 8.6 million people developed tuberculosis in 2012. Among these cases, 1.3 million died from tuberculosis disease, including 320 000 tuberculosis–HIV associated deaths. Targets for the reduction in tuberculosis deaths are clearly set out in WHO declarations such as the Millennium Development Goals (MDGs).
Significant progress has been made in fighting tuberculosis and tuberculosis–HIV through following the WHO strategies for these diseases. Tuberculosis incidence and tuberculosis-associated mortality is now on a continuing downward trend, but more can be done to accelerate progress towards achieving MDG impact targets, which aim to halve the 1990 number of HIV/tuberculosis deaths by 2015.
Global health partners, including the WHO and the Global Fund to Fight AIDS, Tuberculosis and Malaria, are committed to setting further targets and monitoring progress in fighting HIV, tuberculosis and joint tuberculosis–HIV epidemics. As part of these efforts, countries need tuberculosis–HIV-related estimates for both planning and monitoring purposes. For example, 41 high-burden countries are now required to submit joint tuberculosis/HIV ‘concept notes’ or applications to the Global Fund to Fight AIDS, tuberculosis and Malaria as mandated in their new funding model [2].
Estimates of tuberculosis–HIV mortality at the country level have been produced by Global Tuberculosis Programme (GTB), relying partly on overall HIV prevalence estimates from UNAIDS. Recent changes to the Spectrum AIDS Impact Module (AIM) model structure present a more detailed picture of HIV burden. Tuberculosis–HIV estimates are also accumulating through population surveys of tuberculosis–HIV prevalence, sentinel HIV data, and routine HIV testing of reported tuberculosis cases. These recent changes prompted an initiative to produce improved tuberculosis–HIV mortality estimates at the national level.
A collaboration between GTB, UNAIDS, TB Modelling and Analysis Consortium (TB MAC), the Stop TB Partnership, Futures Institute, and a wide group of experts was launched under the auspices of the UNAIDS Reference Group on Estimates, Modelling and Projections. The aim was to assess all available data and methods for combining data sources from GTB and UNAIDS in order to produce the best estimates for tuberculosis–HIV burden. A method was developed by Futures Institute and finalized by the reference group. This study offers a technical account of this method, which has been integrated into TIME (TB Impact Model and Estimates) [3], a wider suite of tuberculosis tools in Spectrum [4,5], under the name TIME Estimates.
TIME Estimates uses a regression model that relates the seven CD4 categories of the adult HIV population in Spectrum AIM to their relative risk (RR) for tuberculosis disease. The model does not attempt to simulate any parts of tuberculosis natural history or care and control in a mechanistic way, but looks to directly distribute the overall burden of incident tuberculosis across HIV/CD4 strata. The model draws no distinction between adult and pediatric tuberculosis, and assumes that combined adult and childhood tuberculosis can be regressed on adult HIV CD4 distributions.
To this end, a regression method for tuberculosis incidence was devised to estimate RR for tuberculosis incidence. The model was fit to total estimated incidence from the WHO GTB database [6] and disaggregated according to HIV burden numbers, which were further disaggregated by the seven CD4 categories used by Spectrum AIM for national HIV projections. Tuberculosis mortality was calculated as the product of number of incident cases and estimated case fatality ratios (CFRs) by HIV/antiretroviral therapy (ART) and tuberculosis notification status.
Methods
Methods are presented in five sections: (1) A brief overview of the cubic-spline method used in the analysis, (2) a bootstrap method for obtaining confidence intervals, (3) functional form for the regression method to estimating tuberculosis–HIV incidence, (4) the objective function used, and (5) the use of CFRs to estimate tuberculosis–HIV mortality.
Projection with cubic splines
The regression methods used by TIME relied on estimation with cubic-splines (penalized B-splines in particular), a technique widely used use for projecting trends forward in time. The same method was used as one of the techniques of shaping the force of infection of HIV in the Estimation and Projection Package (EPP) estimation approach [7]. In simple terms, this can be explained as follows:
A time-dependent function, such as tuberculosis incidence, which is called I(x) below, can be represented as a linear combination of cubic-spline basis functions. Keeping the specification general, the linear representation involves k time-dependent m’th order cubic-spline functions [8]: 
where βi is the i’th spline coefficient and Bmi(x) represents the evaluation of the i-th basis function at time(year) x. We used 10 equally spaced knots (k = 10), which sufficiently span the projection period of 1990–2012. The order of each basis function was m, and we used cubic-splines, that is, m = 3, as in EPP.
For our application, the values of the cubic-spline coefficients β were determined by an optimization routine that minimized the least squares error between incidence data (Iobs) and the estimated curve I(x): 
Here |I - Iobs|2 is the sum of squared errors, S a second-order difference matrix, and λ a smoothness penalty matrix applied directly to the parameters β to control the level of variation between adjacent coefficients of the cubic-spline.
Global Tuberculosis Programme data
The most successful approach to estimating tuberculosis incidence at national level is through routine surveillance systems, on which reports of notified new and relapse cases are based. Generally, countries with universal health coverage have near complete notification reports, providing a reliable proxy for tuberculosis incidence [9].
However, surveillance system often fail to provide a reliable estimate of tuberculosis incidence, the major reasons of which include: laboratory errors [10], lack of notification by public [11] and private providers [12], failure of health-care staff to recognize tuberculosis signs and symptoms among people accessing health services [13] and lack of access to health services [14]. These factors all contribute to uncertainty about tuberculosis incidence estimates obtained from case notification data. Reliance on expert opinion to estimate incidence in countries with weak surveillance and health systems often result in biases in estimates and considerable uncertainty in tuberculosis estimates, as mentioned in the Global Tuberculosis Report [1].
The prevalence of HIV among reported new and relapse tuberculosis cases is used as a proxy for HIV prevalence among incident tuberculosis. Sources of data at country level include nationwide representative HIV serological surveys among a sample of reported tuberculosis cases, data from HIV sentinel groups, and results from routine testing of tuberculosis patients when testing coverage of newly reported cases is high.
Tuberculosis indicators and fitting algorithm
The cubic-spline projection method outlined above was adapted to fit and project a number of tuberculosis indicators relevant to this analysis. A general framework was used to control the terms that define each objective function, which comprise terms that minimize the error in fitting to data and terms that ensure smoothness of the fit. The method available in Spectrum TIME was replicated in MATLAB to facilitate batch processing, using the fmincon function with its Levenberg–Marquardt minimization method for non-linear least squares problems [15].
This analysis required projections for total tuberculosis notification and incidence, the ratio of which determined the case detection ratio (used in tuberculosis mortality calculations), as well as the breakdown of total tuberculosis incidence into HIV status. These indicators are described in Table 1.
Table 1.
Indicators fitted with cubic splines, either directly or through functional relationship.
| Regressand | Regressor | Description and/or purpose |
| Direct fitting | ||
| Total tuberculosis incidence (I) | Spline coefficients β | Provides envelope for HIV-negative and HIV-positive tuberculosis incidence |
| Total tuberculosis notification (N) | Spline coefficients β | Determines case detection ratio = N/I, used in mortality calculations |
| Fitting through composite functional relationship | ||
| Total tuberculosis incidence, tuberculosis–HIV survey, sentinel and routine survey data | Spline coefficients β | Provides estimate for risk of tuberculosis infection for HIV-negative and CD4+ cell count > 500 cells/ml tuberculosis cases |
| Tuberculosis–HIV progression parameter | Provides fit to available tuberculosis–HIV data | |
Overall tuberculosis incidence and notification were first estimated directly from respective data. The projected tuberculosis incidence figures were then used as simulated data, together with observed tuberculosis–HIV data, to estimate disaggregations into three assumed tuberculosis incidence components: HIV-negative, HIV-positive not on ART, and HIV-positive on ART tuberculosis cases (see section ‘Tuberculosis–HIV incidence disaggregation’). Tuberculosis mortality was finally determined using incidence and notification projections, in order to apply different case fatality ratios to incident and notified tuberculosis cases (see section ‘Estimating Tuberculosis–HIV mortality’).
For tuberculosis indicators directly fitted to data (total tuberculosis notification and incidence), we used generalized cross-validation [8] to determine a smoothness parameter. We did not apply a smoothness penalty to estimate the breakdown of projected total tuberculosis incidence by HIV status.
Confidence intervals
The cubic-spline method was then used to fit an indicator (incidence or notification) to a set of bootstrapped data, obtained by sampling from the normal error distribution with zero mean and a standard deviation of the residuals of the spline regression. This bootstrap method produced a sample of projected cubic-spline curves that inherits the temporal biases and systematic errors of the data. Confidence intervals based on the bootstrapped data, namely 2.5th and 97.5th percentile of projected cubic splines, were typically narrow in the years where the model had data to utilize, and ‘spread out’ after that, according to a Gaussian process with a linearly increasing variance.
Note our confidence intervals do not propagate the uncertainty bounds around tuberculosis incidence described in the GTB datasets, but rather represent uncertainty arising from our spline fit to the GTB best-estimate time series.
Tuberculosis–HIV incidence disaggregation
The disaggregation of tuberculosis incidence by HIV and CD4 category is based on the idea that increase in the RR for tuberculosis incidence is a function of CD4 decline. Williams et al.[16] captured this idea in a model for the relationship between the RR for tuberculosis and CD4 decline. They suggested a 42% (26–59% for the 95% confidence interval) increase in RR for tuberculosis for each unit of 100 μl CD4 decline. The model approximated this principle by first estimating HIV-negative tuberculosis incidence, and then calculating the ‘risk of tuberculosis’ function F(HIV-negative) = I− / P−, where I− is HIV-negative tuberculosis incidence and P− the number of HIV-negative individuals susceptible to tuberculosis.
An assumption was made that the risk of tuberculosis for PLWH cases with CD4+ cell count more than 500 μl was proportional to F(HIV-negative). For each 100 μl CD4 decline in the remaining categories (350–499, 250–349, 200–249, 100–199, 50–99 CD4+ cells/μl, and CD4+ cell count less than 50 cells/μl), the risk of tuberculosis as a function of CD4+ cell count was represented as:
where p(1) is a parameter that was used to recognize that PLWH, even with high CD4+ cell counts, are at higher risk of tuberculosis relative to HIV-negative cases, and p(2) controls the exponential increase in RR with CD4 decline. The CD4 decline unit dc is the number of 100 μL CD4 decline associated with the midpoint of each CD4 category relative to 500: dc = (0, 0.8, 2.0, 2.8, 3.6, 4.3, 4.8) for the seven CD4 categories.
There are a number of aspects of the RR approach that have to be balanced: the ‘biological meaning’ we would like to attach to these parameters, and a more straightforward interpretation of these parameters as regression coefficients. Either or both parameters can be fixed or allowed to vary to fit the data. For the 2012 estimates, we assumed p(1) = 2.5 [17] and fit p(2) in order to match total tuberculosis incidence and tuberculosis–HIV estimates from HIV-test data where available.
We further assumed hazard ratios of 0.35 for all CD4 at ART initiation categories. Suthar et al.[18] reports hazard ratios of 0.16, 0.35, and 0.43 for those on ART with CD4+ cell count less than 200, 200–350, and more than 350 cells/μl, and these values could in principle be used. However, we used a single hazard ratio corresponding to the prevailing CD4-based eligibility criterion at 2012. A further assumption was made that the hazard ratio of 0.35 applied only to patients on ART for more than 6 months. Spectrum's ART-mortality estimates, derived mostly from ART cohorts in Southern sub-Saharan Africa, suggested that mortality is still very high in the first 6 months of treatment. As tuberculosis is a leading cause of HIV mortality, it was felt that the hazard ratio of 0–6 month ART patients is likely still high and the reduction factor due to ART was not applied.
The above algorithm can be described by a general formula for incidence I: 
Where h is a label for HIV status: HIV-negative (h = 1), HIV-positive not on ART (h = 2), and HIV-positive tuberculosis cases on ART for 0–6 months (h = 3), 7–12 months (h = 4), and more than 1 year (h = 5), and c a label for the seven CD4 categories of each HIV-positive state (h ≥2). Ph,cis the population size of group h, c (when h = 1, c does not apply). Ah,c = p(1) ∗ p(2)dc for h≥2 or more and c = 1–7 (1 otherwise) and Bh,c = 0.35 for h≥4 or more (1 otherwise). The cubic spline parameters for the ‘risk of tuberculosis’ function F(t) as well as p(2) is estimated in an optimization step so as to minimize the sum of squared residuals between predicted tuberculosis–HIV incidence (∑h>=2Ih), described in the next section, as well as a simulated (bootstrap) dataset for overall tuberculosis incidence (∑h>=1 Ih).
Objective function for tuberculosis–HIV estimates
A simple least squares approach was used to fit the model to total tuberculosis incidence and to all available estimates of tuberculosis–HIV incidence. Weighting of the data on HIV-positive tuberculosis incidence was dependent on the perceived strength of the data point. Estimates of HIV-positive tuberculosis incidence were obtained by three sampling methods: population surveys of tuberculosis–HIV prevalence (least biased, but scarce due to cost), sentinel HIV data (biases included more testing of advanced HIV especially in resource constrained settings), and routine HIV testing of reported active cases (variable coverage as is characteristic of different contexts).
To increase the weight of survey data, we duplicated the survey data in the objective function for years with HIV-test data, we simply added identical copies of the HIV-test data to the objective function. This is a way of (subjectively) giving more weight to HIV-test data in the objective function, in which function it would be competing with our total tuberculosis incidence estimate. The total tuberculosis incidence estimate was based on much more data, evenly spread out in the estimation period 1990–2015. Our method makes no correction for the degree to which tuberculosis–HIV prevalence fails to approximate tuberculosis–HIV incidence, a point elaborated upon in the concluding section.
Trial and error showed that using two replicas of the HIV survey data (i.e., duplicating the survey data) HIV sentinel data with coverage greater than 90%, and routine testing estimates with coverage between 50–90% (routine testing data with coverage 0–50% are not used), gives a fit that passes close to survey points where they are available.
For countries with no data, we used a range for p(2) based on results from countries with survey data, which suggested that p(2) = 1.96 (1.8–2.1) and fit the RR model only to total tuberculosis incidence. We imposed a lower bound of 1.3 and an upper bound of 3.7 on p(2) when fitted to countries with survey data. There is no satisfactory way of verifying results for HIV-positive tuberculosis incidence when no HIV-testing data are available, but comparison of the global estimate for HIV-positive tuberculosis incidence produced by Spectrum tuberculosis and GTB's estimate (based a different method using HIV prevalence instead of CD4 distributions and using the same HIV-test but in a different way) suggested that the RR model worked reasonably well.
Estimating tuberculosis–HIV mortality
Tuberculosis mortality is affected by a complex relationship between active tuberculosis disease and many clinical variables, which we approximated in a simple functional relationship between incidence and CFR. For the purpose of this work, CFR was defined as the ‘fraction of individuals with active tuberculosis that will die due to tuberculosis, during that tuberculosis episode, regardless of the duration of that episode.’ This follows the definition used by Straetemans et al.[19] and included deaths recorded as ‘with tuberculosis as contributory cause’, ‘attributable to tuberculosis’ or ‘related to tuberculosis’.
We considered eight categories CFRs (HIV negative, HIV positive not on ART, HIV positive on ART <12 months and HIV positive on ART for ≥12 months, by notification status) to be clinical states that were both clinically relevant and possible to estimate from available data. Using this approach, tuberculosis mortality was calculated as product of incidence and CFRs:
where I represented incident tuberculosis cases, N cases that were notified, (I-N) tuberculosis cases that were not notified and M tuberculosis mortality. The label h referred to four HIV categories mentioned above. Fh,n and Fh,u were the CFRs for notified and non-notified incident cases, respectively. The disaggregation of incident tuberculosis was based on the ratio of the point estimate incidence and notified cases, both estimates coming from the tuberculosis database. We further assumed that all cases, regardless of HIV status, have the same detection ratio, an approximation we could not improve with available data.
CFRs and estimated parameters of their assumed triangular distribution are stated in Table 2. These parameter values were obtained in collaboration with the TB Modeling and Analysis Consortium (TBMAC), building on existing sources, and a new review of the literature. For CFR values in HIV-negative tuberculosis cases and HIV-positive tuberculosis cases not on ART systematic reviews of prechemotherapy and pre-ART data, respectively, were used [20–22], as well as existing WHO estimates [1]. For the 2013 estimates described here, preliminary results from a systematic review commissioned by UNAIDS were used to estimate the relative CFR in patients receiving ART. This review is now completed and under revision with a peer-reviewed journal [23]. The point values used for the 2013 calculations (RR = 0.55 for <12 months of ART and RR = 0.33 for ≥12 months of ART) sit towards the upper and lower end of the range found in the review (95% range for RR = 0.29–0.56). More details of the calculations and assumptions can be found in the report on the UNAIDS Reference Group website.
Table 2.
Case fatality ratios by tuberculosis notification status, HIV status and antiretroviral status.
| Non-notified cases | Notified cases | |
| HIV negative | ||
| Mode | 0.43 | 0.03 |
| Lower bound | 0.28 | 0.00 |
| Upper bound | 0.53 | 0.07 |
| HIV positive not receiving ART | ||
| Mode | 0.78 | 0.09 |
| Lower bound | 0.65 | 0.03 |
| Upper bound | 0.94 | 0.15 |
| Receiving ART for less than 1 year | ||
| Mode | 0.62 | 0.06 |
| Lower bound | 0.39 | 0.01 |
| Upper bound | 0.86 | 0.13 |
| Receiving ART for more than 1 year | ||
| Mode | 0.49 | 0.04 |
| Lower bound | 0.31 | 0.00 |
| Upper bound | 0.70 | 0.10 |
Showing the mode, lower and upper bound of the estimated triangular distribution that represent each CFR. ART, antiretroviral therapy; CFR, case fatality ratios.
Results
Results are presented in two parts: (1) A typical projection of national tuberculosis–HIV estimates and (2) regional and global tuberculosis–HIV estimates. The complete results set comprises results for 150 countries, reflecting the total number for which Spectrum AIM files were available at the time of estimation.
Tuberculosis incidence and mortality estimates for Botswana
Figure 1a shows the results of fitting a cubic-spline curve to the Botswana tuberculosis epidemic. This is a typical result, where estimated tuberculosis incidence fits well with recent data. We used the bootstrap method described above to produce 300 simulated datasets, and thus, 300 projections for each indicator. The widening confidence sets for future periods are also typical of most result sets, which is a direct result of the bootstrap uncertainty method.
Fig. 1.
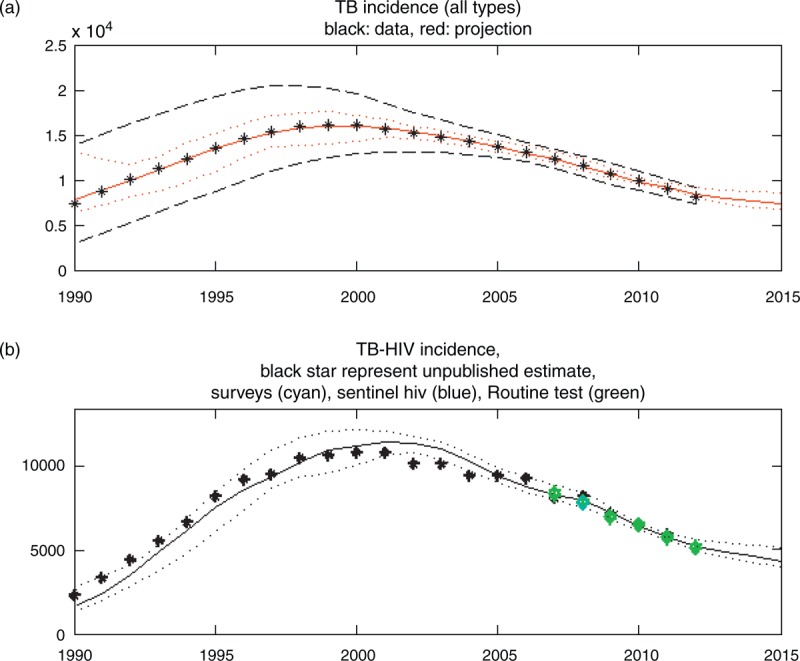
Total tuberculosis incidence and tuberculosis–HIV incidence for Botswana.
The tuberculosis–HIV incidence in Fig. 1b shows another typical result for countries from tuberculosis surveys: The tuberculosis estimate usually goes through the population survey estimate as a result of the relatively high weight given to population survey points.
Tuberculosis mortality estimates are shown in Fig. 2. The HIV-negative (Fig. 2a) and HIV-positive (Fig. 2b) mortality estimates are both close to estimates from GTB. (Note that only the HIV-negative tuberculosis mortality estimate was published prior to this analysis.) This correspondence is encouraging as GTB uses different regression methods for estimating tuberculosis mortality.
Fig. 2.
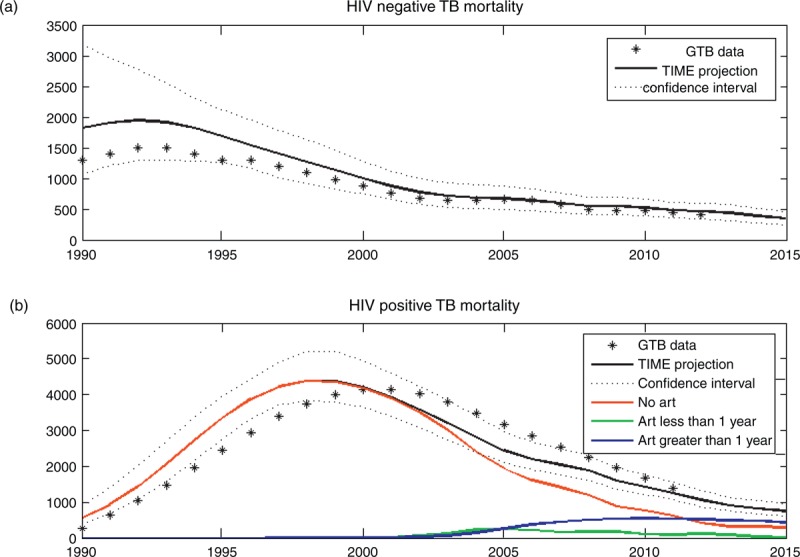
Tuberculosis mortality estimates for Botswana.
Global tuberculosis–HIV estimates
The method outlined in the preceding sections was applied to 150 countries with both UNAIDS and GTB data, representing more than 98% of the world's population. For aggregate estimates, we added the primary regression result of each country, that is, the one that determines the residuals on which the bootstrapped data is based, to give either a global or regional result. Confidence intervals for global estimates are based on the 2.5th and 97.5th percentile of the resulting 300 aggregate indicator projections. For the mortality estimates, CFRs are independently sampled, without hierarchical dependence on country.
Figure 3a shows the regression result for the global HIV-positive tuberculosis incidence estimate together with GTB's estimate. The regression method shows reasonable agreement with GTB estimates in the period 2003–2010, when more HIV-test data are available to inform the regression model. GTB HIV-positive tuberculosis incidence is higher in the historically (mostly) data-free zone, in which it is based on regression with total HIV prevalence, whereas the regression method uses the CD4 category which will typically delay tuberculosis incidence as PLWH progress to low CD4 categories over time. Figure 3b shows the regression results for the global HIV-positive tuberculosis mortality estimate together with points representing 20% of all HIV deaths, as estimated by the global HIV dataset produced by Spectrum/AIM. The regression results are naturally very sensitive to the CFR estimates used (see Table 2), particularly its estimate for CFR of ART patients.
Fig. 3.
Estimates for global tuberculosis–HIV incidence and mortality.
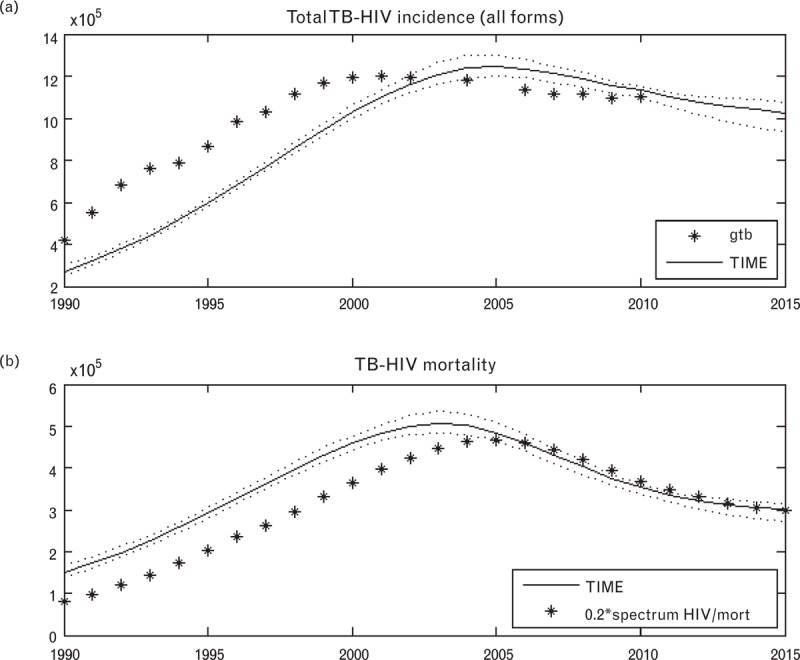
Global Tuberculosis Programme data estimates are shown as black stars, Spectrum tuberculosis estimates [TB Impact Model and Estimates (TIME)] in solid black line, and confidence intervals in dotted black lines. The black stars in subfigure (b) depict 20% of all HIV deaths, as estimated by the global HIV dataset produced by Spectrum/AIM.
Table 3 shows tuberculosis incidence by geographic region. The largest burden, as measured by absolute number of incident cases, resides in the large populations of East Asia (18.5%), South Asia (34.9%), and Southeast Asia (12.8%). Tuberculosis mortality follows a similar pattern, with Southern sub-Saharan Africa having a disproportionate proportion of tuberculosis deaths (12.1%) relative to incidence (8.7%) occurring in this region.
Table 3.
Estimated tuberculosis incidence by geographic region in 2012.
| Geographic region | All tuberculosis cases | Proportion of global burden (%) | HIV-positive tuberculosis cases | Proportion HIV positive (%) |
| Andean Latin America | 51 052 | 0.6 | 1768 | 3.5 |
| Australasia | 1827 | 0.0 | 43 | 2.4 |
| Caribbean | 30 824 | 0.4 | 5244 | 17.0 |
| Central Asia | 95 032 | 1.1 | 1613 | 1.7 |
| Central Europe | 37 332 | 0.4 | 666 | 1.8 |
| Central Latin America | 62 861 | 0.7 | 5385 | 8.6 |
| Central sub-Saharan Africa | 89 484 | 1.1 | 11 142 | 12.5 |
| East Asia | 1 576 362 | 18.5 | 36 410 | 2.3 |
| Eastern Europe | 189 855 | 2.2 | 15 016 | 7.9 |
| Eastern sub-Saharan Africa | 793 084 | 9.3 | 250 110 | 31.5 |
| High-income Asia Pacific | 26 997 | 0.3 | 184 | 0.7 |
| High-income North America | 13 132 | 0.2 | 1217 | 9.3 |
| North Africa and Middle East | 128 547 | 1.5 | 1336 | 1.0 |
| Oceania | 24 858 | 0.3 | 1 067 | 4.3 |
| South Asia | 2 975 842 | 34.9 | 134 279 | 4.5 |
| Southeast Asia | 1 089 497 | 12.8 | 43 593 | 4.0 |
| Southern Latin America | 14 078 | 0.2 | 499 | 3.5 |
| Southern sub-Saharan Africa | 742 700 | 8.7 | 450 399 | 60.6 |
| Tropical Latin America | 95 714 | 1.1 | 16 237 | 17.0 |
| Western Europe | 30 273 | 0.4 | 1557 | 5.1 |
| Western sub-Saharan Africa | 450 946 | 5.3 | 97 135 | 21.5 |
| Total | 8 520 298 | 1 074 902 | 12.6 |
Tuberculosis–HIV accounts for a large proportion of tuberculosis incidence in the sub-Saharan regions: Central sub-Saharan Africa (12.5%), Eastern sub-Saharan Africa (31.5%), Southern sub-Saharan Africa (60.6%), and Western sub-Saharan Africa (21.5%). Its contribution of 17% to the tuberculosis epidemic of the Caribbean is also high relative to regions outside of Africa. Globally, tuberculosis–HIV is estimated to account for 12.6% of tuberculosis incidence.
Table 4 shows tuberculosis deaths by WHO region. Table 4 is highly correlated with Table 3 in terms of the distribution of tuberculosis deaths as well as distribution by case type. This can be expected from a CFR-based approach such as we have used. Globally, tuberculosis/HIV mortality was estimated to account for 21.3% of all tuberculosis deaths and for 20% of all HIV deaths, as estimated by Spectrum AIM/EPP (Fig. 3b).
Table 4.
Estimated tuberculosis deaths by geographic region in 2012.
| Geographic region | All tuberculosis cases | Proportion of global burden (%) | HIV-positive tuberculosis cases | Proportion HIV positive (%) |
| Andean Latin America | 5907 | 0.4 | 470 | 8.0 |
| Australasia | 150 | 0.0 | 5 | 3.1 |
| Caribbean | 5173 | 0.3 | 1255 | 24.3 |
| Central Asia | 15 062 | 1.0 | 507 | 3.4 |
| Central Europe | 3 942 | 0.3 | 112 | 2.8 |
| Central Latin America | 10 036 | 0.7 | 1512 | 15.1 |
| Central sub-Saharan Africa | 13 290 | 0.9 | 2850 | 21.4 |
| East Asia | 189 495 | 12.6 | 11 836 | 6.2 |
| Eastern Europe | 20 796 | 1.4 | 3084 | 14.8 |
| Eastern sub-Saharan Africa | 184 579 | 12.2 | 83 005 | 45.0 |
| High-income Asia Pacific | 2083 | 0.1 | 19 | 0.9 |
| High-income North America | 1130 | 0.1 | 142 | 12.5 |
| North Africa and Middle East | 16 272 | 1.1 | 296 | 1.8 |
| Oceania | 3 723 | 0.2 | 244 | 6.5 |
| South Asia | 575 758 | 38.2 | 43 273 | 7.5 |
| Southeast Asia | 155 409 | 10.3 | 10 053 | 6.5 |
| Southern Latin America | 1456 | 0.1 | 81 | 5.5 |
| Southern sub-Saharan Africa | 171 019 | 11.3 | 121 689 | 71.2 |
| Tropical Latin America | 10 888 | 0.7 | 2568 | 23.6 |
| Western Europe | 2709 | 0.2 | 180 | 6.6 |
| Western sub-Saharan Africa | 118 212 | 7.8 | 37 834 | 32.0 |
| Total | 1 507 089 | 321 014 | 21.3 |
Discussion
Although subject to the assumptions mentioned previously, and to limitations mentioned in the remainder of this section, the TIME regression method provides a simple but clear method to generate internally consistent estimates for tuberculosis/HIV incidence and mortality, which have had immediate tuberculosis programme planning uses. Most importantly, it allows for the evaluation of progress towards the 5th MDG target of reducing tuberculosis mortality in HIV-positive individuals by 2015.
The results also provide countries with estimates of the number of incident tuberculosis cases by CD4 category. Many countries now follow 2010 ART guidelines, which recommend that HIV-positive cases with active tuberculosis must initiate treatment regardless of CD4 count. Most of them want to expand ART eligibility to higher CD4 thresholds. The model can be used to estimate resource requirements above those that will result from current ART guidelines. Another important use is the impact of ART expansion on tuberculosis–HIV incidence and mortality.
Combining data from different datasets often highlights their fundamental incompatibilities. In this instance, the incompatibilities can be traced to tuberculosis reporting problems at country level, as well as different types of biases in the data that underpin HIV prevalence estimates. For example, in some cases the best estimate of tuberculosis–HIV incidence from Spectrum TIME Estimates model occasionally falls below the number of notified tuberculosis–HIV cases from routine surveillance. This may be the result of overall tuberculosis incidence being too low, or tuberculosis–HIV overreporting cases re-registering for ART. Another problem is that the estimate of tuberculosis–HIV mortality is not explicitly calibrated to be compatible with the mortality envelope of total HIV mortality, as estimated by Spectrum, with an unknown consequence on mutual compatibility of HIV mortality estimates.
Future improvements of the tool are envisioned along two main themes: improving the methodology and improving the accuracy of data, particularly the data at the intersection of tuberculosis with HIV.
The method itself can be improved in several ways to address its limitations. It uses a CD4-aggregated impact estimate for the impact of ART on tuberculosis incidence, although Suthar et al.[18] provide an estimate for tuberculosis incidence hazard ratios by CD4 at ART initiation. Although our choice of a single hazard ratio, 0.35, is consistent with the CD4-based ART rules for the year of our estimates (2012), we plan to use the disaggregated hazard ratios from Suthar et al. in a future version of the method.
The regression incidence model does not explicitly capture tuberculosis latency, and therefore, does not capture reactivation of latent tuberculosis. This limitation could be addressed through an extension of the current regression model to approximate the contribution of reactivation to tuberculosis incidence. Another approach could be to use parameter-parsimonious dynamic tuberculosis modeling to better capture the dynamic relationship between tuberculosis–HIV prevalence and incidence, improving our current assumption of direct correspondence.
The confidence intervals of the global tuberculosis–HIV estimates produced by the TIME Estimates model appear to be too narrow. A robust treatment of global estimates requires a more thorough uncertainty analysis. However, the narrow uncertainty intervals can be traced to the bootstrap method, which is designed to reflect growing uncertainty for future projections, but which typically fit existing data arguably too well. The sampling of case fatality distributions also happen independently for each country, which may lead to the cancelation of extreme estimates, narrowing the aggregate confidence interval. A solution to these concerns may be the use of a hierarchical regression method which places a hyper prior distribution on all parameter distributions, and which provides more complex data weighing possibilities that are sensitive to the biases of tuberculosis–HIV data and the systematic errors that may exist in the various datasets. Uncertainty in the incidence data regressed on by including a measurement model relating the true and observed incidences in the regression likelihood.
Another methodological improvement is to draw a distinction between adult and pediatric tuberculosis. The need for pediatric tuberculosis estimates has already led to preliminary methodological review. The next version of the child UNAIDS HIV model will utilize the same CD4 structure currently used in the adult model, which facilitates the adoption of the above-mentioned methods to childhood tuberculosis.
In addition to data quality control processes, future versions will place constraints on the regression method to help control for inconsistencies between tuberculosis and HIV incidence as estimated by the regression method and assessed through routine surveillance. For example, a constraint can be used to limit the degree to which an estimate of tuberculosis–HIV incidence may be below notified tuberculosis–HIV, and account for expected overreporting of tuberculosis–HIV cases and for the potential underreporting of overall incidence.
The integration of TIME Estimates into Spectrum allows for further direct model interaction with Spectrum AIM, which can help improve estimates for the total HIV mortality envelope. In particular, it could help produce CD4-based CFR estimates for tuberculosis–HIV, which, until now, could not be systematically determined from tuberculosis mortality data alone. It is apparent that the challenge of ensuring mutually consistent tuberculosis–HIV estimates requires two-way communication within Spectrum between the tuberculosis modules in TIME and HIV modules AIM and goals.
In addition to presenting an explicit account of current methods, the tool has taken an important step forward in providing reliable country level estimates of tuberculosis–HIV burden. Those results, known as the ‘2012 TB-HIV estimates’, were published in the Global Tuberculosis Report 2013, and plans are underway to update the tuberculosis–HIV estimates annually with updates to the GTB and UNAIDS datasets.
Acknowledgements
C.P. was funded under a grant from the Bill and Melinda Gates Foundation (OPPGH5182, Strategic Analysis for HIV/AIDS Planning and Implementation). R.G.W. and R.H. were funded under grants from the Bill and Melinda Gates Foundation (OPP1110334 and OPP1084276).
The UNAIDS Reference Group on Estimates convened two special meetings with GTB, UNAIDS, TB Modelling and Analysis Consortium (TB MAC), The Stop TB Partnership, Futures Institute, and a wide group of experts, to discuss and address the need for tuberculosis–HIV estimates. The authors would like to acknowledge the efforts of Tim Hallett and Peter Ghys who facilitated and chaired these meetings.
Author contributions: Conceived and designed the study: C.P., P.J.D., P.G., R.W., the UNAIDS Reference Group on Estimates and other experts; Performed model simulations: C.P.; Analyzed results: C.P., P.G., and R.H.; Wrote the study: C.P.; Reviewed and edited the manuscript: C.P., P.J.D., P.G., R.G.W. and R.H.
Conflicts of interest
There are no conflicts of interest.
References
- 1.The Global TB Report 2013. http://www.who.int/tb/publications/global_report/. [Google Scholar]
- 2.The global fund: new funding model. http://www.theglobalfund.org/en/fundingmodel/. [Google Scholar]
- 3.Pretorius C, Houben RM, Glaziou P, White RG. TIME: A new country-level tool for TB-HIV estimates and impact projections in Spectrum. In: 44th Union World Conference on Lung Health; 2013; Paris. [Google Scholar]
- 4.Futures Institute. Spectrum. http://www.futuresinstitute.org/spectrum.aspx. [Google Scholar]
- 5.Stover J, McKinnon R, Winfrey B. Spectrum: a model platform for linking maternal and child survival interventions with AIDS, family planning and demographic projections. Int J Epidemiol 2010; 39 Suppl 1:i7–i10. [DOI] [PMC free article] [PubMed] [Google Scholar]
- 6.WHO: TB Data. http://www.who.int/tb/country/. [Google Scholar]
- 7.Hogan D, Zaslavsky A, Hammitt J, Salomon J. Flexible epidemiological model for estimates and short-term projections in generalised HIV/AIDS epidemics. Sex Transm Infect 2010; 86 Suppl 2:ii84–ii92. [DOI] [PMC free article] [PubMed] [Google Scholar]
- 8.Wood S. (2007) Generalized Additive Models. Chapman & Hall/CRC Texts in Statistical Science (Book 66), Chapman and Hall/CRC. [Google Scholar]
- 9.O’Neill K, Takane M, Sheffel A, Abou-Zahr C, Boerma T. Monitoring service delivery for universal health coverage: the Service Availability and Readiness Assessment. Bull World Health Organ 2013; 91:923–931. [DOI] [PMC free article] [PubMed] [Google Scholar]
- 10.Botha E, den Boon S, Lawrence KA, Reuter H, Verver S, Lombard CJ, et al. From suspect to patient: tuberculosis diagnosis and treatment initiation in health facilities in South Africa. Int J Tuberc Lung Dis 2008; 12:936–941. [PubMed] [Google Scholar]
- 11.Dye C, Scheele S, Dolin P, Pathania V, Raviglione MC. Consensus statement. Global burden of tuberculosis: estimated incidence, prevalence, and mortality by country. WHO Global Surveillance and Monitoring Project. JAMA 1999; 282:677–686. [DOI] [PubMed] [Google Scholar]
- 12.Uplekar M, Pathania V, Raviglione M. Private practitioners and public health: weak links in tuberculosis control. Lancet 2001; 358:912–916. [DOI] [PubMed] [Google Scholar]
- 13.Meintjes G, Schoeman H, Morroni C, Wilson D, Maartens G. Patient and provider delay in tuberculosis suspects from communities with a high HIV prevalence in South Africa: a cross-sectional study. BMC Infect Dis 2008; 8:72. [DOI] [PMC free article] [PubMed] [Google Scholar]
- 14.Veron LJ, Blanc LJ, Suchi M, Raviglione MC. DOTS expansion: will we reach the 2005 targets?. Int J Tuberc Lung Dis 2004; 8:139–146. [PubMed] [Google Scholar]
- 15.Matlab. R2011. http://www.mathworks.com/products/matlab/. MATLAB R2011 Natick, Massachusetts: The MathWorks Inc., 2010. [Google Scholar]
- 16.Williams B. The impact of ART for HIV on TB. http://www.who.int/hiv/topics/artforprevention/williams.pdf. [Google Scholar]
- 17.Sonnenberg P, Glynn J, Fielding K, Murray J, Godfrey-Faussett P, Shearer S. How soon after infection with HIV does the risk of tuberculosis start to increase? A Retrospective Cohort Study in South African Gold Miners. The Journal of Infectious Diseases 2005; 191:150–158. [DOI] [PubMed] [Google Scholar]
- 18.Suthar A, Lawn S, del Amo J, Getahun H, Dye C, Sculier D, et al. Antiretroviral therapy for prevention of tuberculosis in adults with HIV: a systematic review and meta-analysis. PLoS Med 2012; 9:e1001270. [DOI] [PMC free article] [PubMed] [Google Scholar]
- 19.Straetemans M, Glaziou P, Bierrenbach A, Sismanidis C, van der Werf M. Assessing tuberculosis case fatality ratio: a meta-analysis. PLoS One 2011; 6:e20755. [DOI] [PMC free article] [PubMed] [Google Scholar]
- 20.Tiemersma EW, van der Werf MJ, Borgdorff MW, Williams BG, Nagelkerke NJ. Natural history of tuberculosis: duration and fatality of untreated pulmonary tuberculosis in HIV negative patients: a systematic review. PLoS One 2011; 6:e17601. [DOI] [PMC free article] [PubMed] [Google Scholar]
- 21.Corbett EL, Watt CJ, Walker N, Maher D, Williams BG, et al. The growing burden of tuberculosis: global trends and interactions with the HIV epidemic. Arch Intern Med 2003; 163:1009–1021. [DOI] [PubMed] [Google Scholar]
- 22.Mukadi YD, Maher D, Harries A. Tuberculosis case fatality rates in high HIV prevalence populations in sub-Saharan Africa. AIDS 2001; 15:143–152. [DOI] [PubMed] [Google Scholar]
- 23.Odone A, Amadasi S, White R, Cohen T, Grant A, Houben R. The impact of antiretroviral therapy on mortality in HIV positive people during tuberculosis treatment: a systematic review and meta-analys. PLoS One 2014; accepted subject to revisions. [DOI] [PMC free article] [PubMed] [Google Scholar]