

Abstract
Objective:
To systematically review and analyse data from cohorts of people who inject drugs (PWID) to improve existing estimates of non-AIDS mortality used to calculate mortality among PWID in the Spectrum Estimates and Projection Package.
Design:
Systematic review and meta-analysis.
Methods:
We conducted an update of an earlier systematic review of mortality among PWID, searching specifically for studies providing data on non-AIDS-related deaths. Random-effects meta-analyses were performed to derive pooled estimates of non-AIDS crude mortality rates across cohorts disaggregated by sex, HIV status and periods in and out of opioid substitution therapy (OST). Within each cohort, ratios of non-AIDS CMRs were calculated and then pooled across studies for the following paired sub-groups: HIV-negative versus HIV-positive PWID; male versus female PWID; periods in OST versus out of OST. For each analysis, pooled estimates by country income group and by geographic region were also calculated.
Results:
Thirty-seven eligible studies from high-income countries and five from low and middle-income countries were found. Non-AIDS mortality was significantly higher in low and middle-income countries [2.74 per 100 person-years; 95% confidence interval (CI) 1.76–3.72] than in high-income countries (1.56 per 100 person-years; 95% CI 1.38–1.74). Non-AIDS CMRs were 1.34 times greater among men than women (95% CI 1.14–1.57; N = 19 studies); 1.50 times greater among HIV-positive than HIV-negative PWID (95% CI 1.15, 1.96; N = 16 studies); and more than three times greater during periods out of OST than for periods on OST (N = 7 studies).
Conclusions:
A comprehensive response to injecting drug must include efforts to reduce the high levels of non-AIDS mortality among PWID. Due to limitations of currently available data, including substantial heterogeneity between studies, estimates of non-AIDS mortality specific to geographic regions, country income level, or the availability of OST should be interpreted with caution.
Keywords: AIDS, HIV, intravenous, meta-analysis, mortality, review, substance abuse, systematic
Introduction
Compared to their non-drug using peers, people who inject drugs (PWID) are at an elevated risk of mortality from both acute and chronic diseases, many of which are related to their drug use. Much of this excess mortality is attributable to fatal drug overdose and from HIV and other blood-borne viruses transmitted through injecting drug use [1].
Longitudinal studies of PWID provide an opportunity to examine the magnitude, nature and correlates of mortality risk among this group. Previous reviews of drug user cohorts suggest those who are dependent on opioids (both injectors and non-injectors) may have higher mortality rates to those drug users who are dependent on stimulant drugs such as cocaine and amphetamine-type stimulants [2–4].
In a recent systematic review, in 2013, we identified cohort studies of PWID to examine mortality rates and causes of death in this group [5]. We performed random-effects meta-analyses to derive pooled crude mortality rates (CMRs) and standardized mortality ratios (SMRs), and examined participant and study-level variables associated with higher risk of death from all causes and supplementary analyses looking at overdose and AIDS-related mortality. We found AIDS and drug overdose to be the primary causes of death among PWID, and whereas CMRs varied across different settings, overall they were higher in low and middle-income countries (LMICs) compared to high-income countries (HICs).
We undertook a further review and analysis of cohorts of PWID, specifically to examine non-AIDS mortality among HIV-positive and HIV-negative individuals, in an effort to improve existing estimates of mortality used in the UNAIDS Spectrum Estimates and Projection Package model to calculate mortality among PWID.
Methods
For the original review, tailored search strings were used to search Medline, EMBASE and PsychInfo (search terms and strategies have been described previously [5]). Grey literature reporting on mortality was identified using online grey literature databases, library databases and general online searches; the complete list of websites reviewed is provided in a previously published technical report [6]. For the current analysis, we updated the literature search to identify any additional studies published in the period since the earlier review was completed, searching specifically for studies providing data on non-AIDS-related deaths.
Reported CMRs and SMRs were extracted along with information on the location of study, recruitment and duration of study follow-up period, number of people in the cohort, percentage of cohort who injected drugs, person-years of follow-up, number of deaths overall and by cause of death. CMRs reported by sex, HIV status, drug injected and opioid substitution therapy (OST) status were also extracted; OST has been demonstrated to reduce mortality among opioid-dependent PWID [2,7]. In a number of cases where standard errors, confidence intervals (CIs) or CMRs were not reported, these were estimated using standard calculations with data that were provided. For the current updated analysis, all studies were reviewed to extract relevant cause of death data to determine non-AIDS-related deaths.
Meta-analyses were performed to derive pooled estimates across cohorts, where data permitted, for the following: non-AIDS CMR among PWID; non-AIDS CMR among male PWID; non-AIDS CMR among female PWID; non-AIDS CMR among HIV-negative PWID; non-AIDS CMR among HIV-positive PWID; non-AIDS CMR among PWID on OST and non-AIDS CMR among PWID off OST.
Within studies, ratios for CMRs were calculated by the following paired sub-groups, and pooled ratios across the studies were again derived using meta-analyses: ratio of non-AIDS CMRs in HIV-negative versus HIV-positive PWID; ratio of non-AIDS CMRs in male versus female PWID; ratio of non-AIDS CMRs during periods on OST versus off OST.
For each of these analyses, in addition to estimating CMRs across all studies, pooled estimates by country income group and by geographic region were also calculated. Countries were categorized as either ‘high income’ or ‘low and middle income’ based on World Bank categories [8].
When the number of deaths within a sub-group was zero and CMR, standard error and risk ratios were rendered indeterminate, we set the number of deaths at 0.5 to allow inclusion of these groups in comparative analyses.
Meta-analyses were performed using the ‘metan’ command in STATA version 12.1 [9]. The ‘metan’ command uses inverse-variance weighting to calculate random-effects pooled summary estimates, confidence limits, a test for true differences between study effects and an estimate of between-study variance [10,11]. The random-effects model, which allows heterogeneity between and within studies, was applied to all analyses after an a priori decision was made about the marked differences between the study samples, confirmed by observing the heterogeneity chi-square and I-squared statistics.
Results
Our original review included 67 cohort studies [5]; the updated literature search yielded one additional study eligible for inclusion [12]. Of these studies, a total of 42 reported data on cause of death, specifically non-AIDS-related mortality. Table 1 presents a summary of these studies. With the exception of 5 cohorts [47–51], all were from HICs, including 22 cohorts from European countries, 7 from North America, 4 from Australia and 1 from Taiwan.
Table 1.
Studies included in current analyses.
| All-cause mortality | Non-AIDS mortality | |||||||||||||
| Sampling frame | N | PWID (%) | Men (%) | Drugs used | HIV+ (%) | Recruitment period | End of follow-up period | PYFU | CMR | 95% CI | CMR | 95% CI | ||
| High-income countries | ||||||||||||||
| Australia | Degenhardt et al. (2009) [7] | DT | 42676 | ≥70a | – | O | 1985–2006 | 2006 | 425998 | 0.89 | 0.86, 0.92 | 0.88 | 0.85, 0.91 | |
| DiGiusto et al. (2004) [13] | DT | 1244 | ≥70a | 65 | O | 1998 | 2002 | 394 | 1.27 | 0.4, 2.29 | 1.27 | 0.16, 2.38 | ||
| Tait et al. (2008) [14] | DT | 894 | ≥70a | 60 | O | 2001–2001 | 2005 | 4167 | 0.54 | 0.28, 0.72 | 0.50 | 0.29, 0.72 | ||
| Austria | Bauer et al. (2008) [15] | DT | 114 | 99b | 59 | O | 31 | 1998–1999 | 2004 | 535 | 5.42 | 3.45, 7.40 | 3.55 | 1.96, 5.15 |
| Canada | Miller et al. (2007) [16] | SI | 572 | 100 | 53 | O, S | 1966–2004 | 2004 | 1608 | 1.37 | 0.80, 1.94 | 1.18 | 0.65, 1.71 | |
| Czech Rep. | Lejckova and Mravcik (2007) [17] | DT | 12207 | 80 | 68 | O, S | 1997–2002 | 2002 | 38131 | 0.84 | 0.75, 0.93 | 0.93 | 0.81, 1.05 | |
| Zábransky et al. (2011) [18] | OtR | 151 | 100 | 43 | O,S | 1996–1998 | 2008 | 1660 | 0.48 | 0.15, 0.81 | 0.48 | 0.15, 0.82 | ||
| Germany | Golz et al. (2001) [19] | DT | 178 | 100 | 58 | – | 100 | 1996–2000 | 2000 | 805 | 4.22 | 2.80, 5.64 | 2.48 | 1.40, 3.57 |
| Italy | Antolini et al. (2006) [20] | DT | 4644 | 100 | 79 | O, S | 1975–1999 | 1999 | 39667 | 2.01 | 1.80, 2.16 | 1.18 | 1.08, 1.29 | |
| Bargagli et al. (2001) [21] | DT | 11432 | 84 | 82 | O | 1980–1995 | 1997 | 80787 | 2.15 | 2.05, 2.25 | 1.26 | 1.18, 1.34 | ||
| Brancato et al. (1995) [22] | DT | 138 | 100 | 77 | O | 1985 | 1994 | 1272 | 2.04 | 1.26, 2.83 | 1.34 | 0.70, 1.97 | ||
| Ciccolallo et al. (2000) [23] | DT | 4260 | 100 | 78 | – | 1975–1995 | 1995 | 28424 | 2.26 | 2.08, 2.43 | 1.27 | 1.14, 1.40 | ||
| Ferri et al. (2007) [24] | DT | 10376 | 72 | 86 | O | 1998–2001 | 2001 | 15369 | – | – | 0.99 | 0.83, 1.15 | ||
| Galli and Musicco (1994) [25] | DT | 2432 | 100 | 78 | O | 19 | 1980–1998 | 1991 | 16415 | 2.52 | 2.28, 2.77 | 1.64 | 1.44, 1.83 | |
| Goedert et al. (1995) [26] | DT | 4962 | 99c | – | O | 66 | 1980–1990 | 1990 | 21130 | 1.57 | 1.41, 1.75 | 0.86 | 0.74, 0.99 | |
| Manfredi et al. (2006) [27] | DT | 1214 | 100 | 76 | O | 50 | 1977–1996 | 2002 | 13280 | 2.04 | 1.8, 2.3 | 0.96 | 0.80, 1.13 | |
| Moroni and Galli (1991) [28] | DT | 2279 | 100 | – | O | 1981–1988 | 1989 | 13069 | 2.43 | 2.16, 2.69 | 1.84 | 1.60, 2.07 | ||
| Zaccarelli et al. (1994) [29] | DT | 2029 | 100 | 76 | – | 32 | 1985–1991 | 1991 | 7872 | 2.3 | 1.96, 2.63 | 1.17 | 0.93, 1.41 | |
| Netherlands | van Haastrecht et al. (1996) [30] | DT,other | 509 | 100 | 62 | O, S | 34 | 1985–1992 | 1993 | 2229 | 3.23 | 2.56, 4.07 | 2.69 | 2.01, 3.37 |
| Norway | Eskild et al. (1993) [31] | T&C | 1009 | 100 | 64 | O, S | 18 | 1985–1991 | 1991 | 3136 | 2.77 | 2.22, 3.42 | 2.65 | 2.08, 3.22 |
| Spain | Jarrin et al. (2007) [32] | Prv. | 6575 | 100 | 77 | – | 47 | 1987–1996 | 2004 | 73901 | 2.02 | 1.92, 2.12 | 0.99 | 0.92, 1.06 |
| Lumbreras et al. (2006) [33] | DT,other | 3247 | 100 | 77 | – | 45 | 1990–1996 | 2002 | 26826 | 2.18 | 2.00, 2.36 | 1.13 | 1.01,1.26 | |
| Sanchez-Carbonell and Seus (2000) [34] | DT | 135 | 88 | 71 | O | 1985 | 1995 | 1206 | 3.4 | 2.36, 4.44 | 1.66 | 0.93, 2.39 | ||
| Sweden | Fugelstad et al. (1995) [35] | DT,other | 472 | 100 | – | O, S | 100 | 1986–1990 | 1990 | 1793 | 3.85 | 2.94, 4.76 | 3.46 | 2.60, 4.32 |
| Fugelstad et al. (1997) [36] | DT | 1640 | ≥70b | 69 | O, S | 13 | 1981–1988 | 1992 | 10772 | 1.99 | 1.72, 2.25 | 1.82 | 1.56, 2.07 | |
| Fugelstad et al. (1998) [37] | DT | 101 | 100 | 55 | O | 56 | 1986–1988 | 1993 | 515 | 7.76 | 5.54, 10.58 | 9.97 | 6.21, 13.73 | |
| Taiwan | Huang et al. (2011) [12] | Prison | 4357 | 100 | 88 | O | 9 | 2007–2008 | 2008 | 6253 | 2.27 | 1.90, 2.64 | 2.27 | 1.90, 2.64 |
| UK | Copeland et al. (2004) [38] | DT | 660 | 100 | 67 | – | 1980–2001 | 2001 | 6244 | 2.45 | 2.06, 2.84 | 1.14 | 0.87, 1.40 | |
| Frischer et al. (1997) [39] | DT | 459 | 100 | 99 | O | 3 | 1982–1993 | 1994 | 2547 | 2.08 | 1.52, 2.64 | 1.96 | 1.42, 2.51 | |
| Hickman et al. (2003) [40] | DT | 881 | 76 | 75 | O | 1997–1999 | 2001 | 2075 | 1.59 | 1.13, 2.23 | 1.92 | 1.23, 2.60 | ||
| Oppenheimer et al. (1994) [41] | DT | 128 | 100 | 73 | O | 1969 | 1991 | 2349 | 1.83 | 1.28, 2.38 | 1.83 | 1.28, 2.38 | ||
| USA | Evans et al. (2012) [52] | OtR | 644 | 100 | 68 | O, S | 4 | 1997–2007 | 2007 | 4167 | 0.91 | 0.62, 1.20 | 0.91 | 0.62, 1.20 |
| Fingerhood et al. (2006) [42] | DT | 175 | 100 | O, S | 100 | 1994–1998 | 5 yearsd | 743 | 7.14 | 5.22, 9.06 | 3.23 | 1.94, 4.53 | ||
| Goedert et al. (2001) [43] | DT | 6570 | 100 | 66 | – | 14 | 1987–1991 | 1998 | 28900 | 4.67 | 4.42, 4.92 | 3.53 | 3.32, 3.75 | |
| McAnulty et al. (1995) [44] | OtR, HC | 1769 | 100 | 73 | – | 1989–1991 | 1992 | 3149 | 1.05 | 0.69, 1.41 | 1.05 | 0.69, 1.41 | ||
| Vlahov et al. (2005) [45] | OtR, SB | 3593 | 100 | 77 | O, S | 100 | 1988 | 2005 | 25736 | 4.5 | 4.24, 4.76 | 3.29 | 3.07, 3.51 | |
| Vlahov et al. (2008) [46] | OtR, SB | 2089 | 100 | 62 | O, S | 5 | 1997–1999 | 2002 | 8629 | 0.71 | 0.54, 0.88 | 0.72 | 0.54, 0.90 | |
| Middle-income countries | ||||||||||||||
| Brazil | Cardoso et al. (2006) [47] | NSP | 478 | 100 | 79 | S | 49 | 2000–2001 | 2001 | 612 | 2.77 | 1.45, 4.09 | 1.14 | 0.30, 1.99 |
| India | Solomon et al. (2009) [48] | DT,other | 1158 | 100 | 100 | O | 25 | 2005–2006 | 2008 | 1998 | 4.25 | 3.35, 5.16 | 3.55 | 2.73, 4.38 |
| Poland | Moskalewicz and Sieroslawski (1996) [49] | DT | 656 | 100 | 74 | O | 1983–1992 | 1992 | 3594 | 2.28 | 1.81, 2.83 | 2.20 | 1.71, 2.68 | |
| Thailand | Quan et al. (2007) [50] | DT | 346 | 100 | 93 | O, S | 1999 | 2002 | 571 | 3.85 | 2.42, 5.83 | 2.98 | 1.56, 4.39 | |
| Vietnam | Quan et al. (2010) [51] | DT | 894 | 100 | 100 | O | 23 | 2005 | 2007 | 710 | 6.3 | 4.60, 8.50 | 4.37 | 2.83, 5.90 |
CI, confidence interval; CMR, crude mortality rate; DT, drug treatment; HC, health clinics; NSP, needle and syringe programme; O, opioids; OtR, outreach; Prv., HIV prevention service; PWID, people who inject drugs; PYFU, person-years of follow-up; S, stimulants; SB, snowballing; SI, supervised injecting facilities; T&C, HIV testing and counselling services.
aThe proportion of patients who were injectors was not reported but was assumed to at least 70 percentage due to the predominance of this route of administration among opioid dependent people in this country.
bNot explicitly stated, but implied in this study.
cData on history of drug use was available for 62% of patients, of these 99% had a history of injection.
dPatients were followed for 5 years after date of enrolment.
Some CMR and PYFU are calculated.
The cohorts included ranged in size from 100 to over 42 000 participants, contributing a total of 929 238 person-years of follow-up. Men formed the majority of participants in all the studies (median 74% men). Cohorts varied markedly across a number of important characteristics, including: the location of recruitment, whether through drug treatment services, prison, or via ‘community’-based recruitment; HIV prevalence at baseline; the extent of exposure to effective drug treatment; and availability of antiretroviral therapy (ART) to the cohorts.
Opioids were reported as participants’ sole primary drug of injection in the majority of studies (n = 20), 13 cohorts included both stimulant and opioid users and 1 Brazilian study included stimulant users only. It was, however, commonly noted in study descriptions that poly-drug use was likely to occur.
Twenty-one studies reported non-AIDS mortality disaggregated by HIV status at baseline, 22 provided data disaggregated by sex and 7 reported on mortality for periods on and off OST. Results from the analyses of non-AIDS-related mortality are presented in the remainder of this study.
There was substantial variability in non-AIDS mortality between studies (Fig. 1). The results of meta-analyses examining non-AIDS mortality among cohorts of PWID are presented in Table 2. Non-AIDS mortality was significantly higher in LMICs (2.74 per 100 person-years; 95% CI 1.76, 3.72) than in HICs (1.56 per 100 person-years; 95% CI 1.38, 1.74). Non-AIDS mortality was higher in Asia (3.16 per 100 person-years; 95% CI 2.19, 4.13) than other geographic regions, with the lowest pooled non-AIDS mortality rate for Australasia (0.75 per 100 person-years; 95% CI 0.41, 1.82).
Fig. 1.
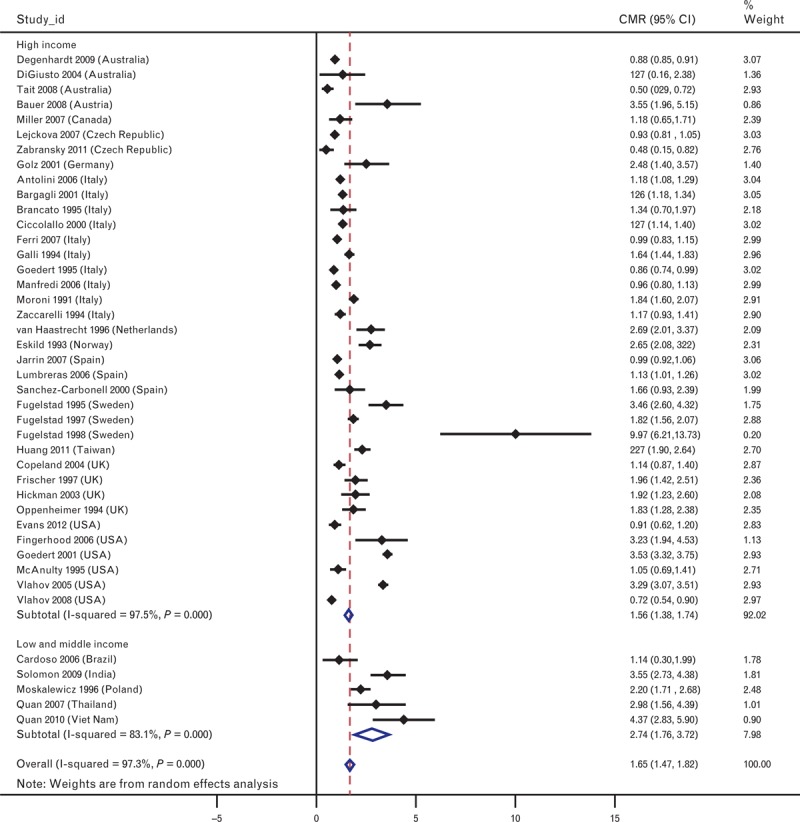
Forest plot showing non-AIDS-related crude mortality rates and overall estimates from meta-analysis.
Table 2.
Pooled crude mortality rates for non-AIDS-related mortality.
| No. of studies | Pooled CMR per 100 PYFU (95% CI) | I2 (P value) | |
| Overall | 42 | 1.65 (1.47, 1.82) | 97% (<0.001) |
| HIC | 37 | 1.56 (1.38, 1.74) | 98% (<0.001) |
| LMIC | 5 | 2.74 (1.76, 3.72) | 83% (<0.001) |
| Western Europe | 27 | 1.42 (1.28, 1.56) | 92% (<0.001) |
| Eastern Europe | 1 | 2.20 (1.72, 2.69) | – |
| Asia | 4 | 3.16 (2.19, 4.13) | 78% (<0.001) |
| Latin America | 1 | 1.14 (0.30, 1.99) | – |
| North America | 7 | 1.96 (0.87, 3.05) | 99% (<0.001) |
| Australasia | 3 | 0.75 (0.41, 1.09) | 84% (<0.001) |
CI, confidence interval; HIC, high-income country; LMIC, low and middle-income country; PYFU, person-years of follow-up.
A total of 21 studies reported data on non-AIDS mortality disaggregated by sex; 2 of these studies included men only [48,51]. Non-AIDS CMRs were greater for male than for female PWID in 14 out of the 19 cohorts that included PWID of both sexes (Table 2). In the five studies in which women had greater non-AIDS CMRs than men, these differences were not statistically significant (at 95% CI). Pooled across the 19 studies that allowed the comparison, non-AIDS CMRs were 1.34 times greater among male PWID than among female PWID (95% CI 1.142, 1.570). Pooled estimates of these rate ratios were greater than 1 for HICs and LMICs, and across all regions.
Twenty-one studies reported non-AIDS mortality disaggregated by participants’ HIV status. In the majority of these studies, individuals were assigned to HIV-positive or HIV-negative groups based on their HIV status measured at baseline. Four studies were of cohorts comprising HIV-positive participants only [19,35,42,45]. Notably, in five studies, a number of AIDS-related deaths were reported among individuals who were recorded as HIV-negative at baseline. Across the 16 studies from which data were available, the non-AIDS crude mortality was 1.5 times higher among HIV-positive than HIV-negative PWID (95% CI 1.14, 1.96) [25,33,43,47,51] (Table 3). This held true across pooled HICs and LMICs, Western Europe and Asia; in the three North American studies included [43,46,52] and a single Italian study [27], CMRs were higher among HIV-negative than HIV-positive PWID.
Table 3.
Pooled crude mortality rates for non-AIDS mortality by sex, HIV serostatus at baseline and periods on versus periods off opioid substitution therapy.
| Sex | Females | Males | Ratio CMR-male/CMR-female | ||||||
| No.of studies | Pooled CMR per 100 PYFU (95% CI) | I2 (P value) | No. of studies | Pooled CMR per 100 PYFU (95% CI) | I2 (P value) | No. of studies | Rate ratio (95% CI) | I2 (P value) | |
| Overall | 19 | 0.91 (0.68, 1.14) | 88% (<0.001) | 21 | 1.35 (1.19, 1.52) | 85% (<0.001) | 19 | 1.34 (1.14, 1.57) | 44% (0.022) |
| HIC | 17 | 0.92 (0.68, 1.15) | 88% (<0.001) | 17 | 1.22 (1.09, 1.36) | 81% (<0.001) | 17 | 1.33 (1.13, 1.57) | 49% (0.012) |
| LMIC | 2 | 0.59 (−0.67, 1.85) | 0% (0.698) | 4 | 3.25 (2.30, 4.19) | 55% (<0.1) | 2 | 3.16 (0.43, 23.35) | 0% (0.869) |
| Western Europe | 14 | 0.97 (0.70, 1.25) | 91% (<0.001) | 13 | 1.31 (1.17, 1.44) | 76% (<0.001) | 13 | 1.35 (1.12, 1.61) | 58% (0.005) |
| Asia | 1 | 1.2 (−2.11, 4.52) | – | 3 | 3.64 (2.98, 4.29) | 0% (0.544) | 1 | 2.68 (0.16, 43.89) | – |
| Latin America | 1 | 0.49 (−0.87, 1.85) | – | 1 | 1.84 (0.48, 3.21) | – | 1 | 3.76 (0.22, 65.67) | – |
| North America | 3 | 0.82 (0.43, 1.21) | 28% (<0.25) | 3 | 1.07 (0.80, 1.33) | 0% (0.816) | 3 | 1.25 (0.72, 2.18) | 24% (0.268) |
| Australasia | 1 | 0.45 (0.12, 0.78) | – | 1 | 0.49 (0.22, 0.77) | – | 1 | 1.09 (0.43, 2.76) | – |
| HIV serostatus | HIV-positive | HIV-negative | Ratio CMR-HIV-positive/CMR-HIV-negative | ||||||
| No. of studies | Pooled CMR per 100 PYFU (95% CI) | I2 (P value) | No. of studies | Pooled CMR per 100 PYFU (95% CI) | I2 (P value) | No. of studies | Rate ratio (95% CI) | I2 (P value) | |
| Overall | 21 | 2.51 (1.96, 3.05) | 97% (<0.001) | 16 | 1.66 (1.23, 2.09) | 98% (<0.001) | 16 | 1.50 (1.15, 1.96) | 86% (<0.001) |
| HIC | 18 | 2.34 (1.80, 2.89) | 97% (<0.001) | 14 | 1.49 (1.05, 1.93) | 98% (<0.001) | 14 | 1.47 (1.05, 1.93) | 88% (<0.001) |
| LMIC | 3 | 5.65 (3.69, 7.61) | 0% (0.849) | 2 | 3.22 (2.46, 3.99) | 0% (0.341) | 2 | 3.22 (2.46, 3.99) | 0% (0.690) |
| Western Europe | 13 | 2.05 (1.62, 2.47) | 92% (<0.001) | 11 | 1.35 (1.02, 1.68) | 95% (<0.001) | 11 | 1.63 (1.17, 2.27) | 87% (<0.001) |
| Asia | 2 | 5.65 (3.69, 7.61) | 0% (0.849) | 2 | 3.22 (2.46, 3.99) | 0% (0.341) | 2 | 1.73 (1.15, 2.61) | 0% (0.690) |
| Latin America | 1 | 0 | – | 1 | 0 | – | – | – | – |
| North America | 5 | 2.53 (1.10, 3.96) | 97% (<0.001) | 3 | 1.73 (−.176, 3.64) | 99% (<0.001) | 3 | 0.90 (0.75, 1.09) | 0% (0.732) |
| OST status | Periods on OST | Periods off OST | Ratio CMR-on-OST/ CMR-off-OST | ||||||
| No. of studies | Pooled CMR per 100 PYFU (95% CI) | I2 (P value) | No. of studies | Pooled CMR per 100 PYFU (95% CI) | I2 (P value) | No. of studies | Rate ratio (95% CI) | I2 (P value) | |
| Overall | 7 | 0.71 (0.40, 1.03) | 94% (<0.001) | 7 | 3.15 (2.04, 4.25) | 97% (<0.001) | 7 | 0.31 (0.18, 0.54) | 91% (<0.001) |
CI, confidence interval; CMR, crude mortality rate; HIC, high-income country; LMIC, low and middle-income country; OST, opioid substitution therapy; PYFU, person-years of follow-up.
Seven studies reported non-AIDS mortality separately for periods during which individuals received OST and when not-receiving OST [7,12,13,35–37,53]. Mortality during time spent on OST was significantly lower than time spent off OST (CMR ratio 0.31; 95% CI 0.18, 0.54) (Table 3).
Discussion
We found 42 cohort studies of PWID, from 18 countries, reporting data on non-AIDS mortality. The cohorts varied markedly in terms of recruitment methods, HIV prevalence and the pattern of drug use among the cohort, the period in which people were followed up, and likely exposure to effective treatment for drug dependence and HIV. It is highly likely that these differences, along with variation in other characteristics both within and between cohorts, were responsible for the substantial heterogeneity observed in all the analyses of non-AIDS mortality conducted for this study.
Our findings suggest non-AIDS CMRs are considerably lower in HICs than in less wealthy countries. In our previous analysis of all-cause mortality, although differences in pooled CMRs between country income groups were statistically significant, pooled SMRs were not. We posited that the higher CMRs observed in LMICs may reflect higher overall mortality in the general population in these countries, which is adjusted for through the calculation of SMRs [5]. It is possible that differences in mortality rates in the general population between HICs and LMICs contribute to the differences observed for pooled non-AIDS CMRs here.
It is important to note that data on non-AIDS mortality were available from only five studies in middle-income countries. These are unlikely to be representative of the diversity in risk and mortality present across LMICs.
The pooled regional estimates suggest rates of non-AIDS-related mortality might be lower among PWID in Australasia compared to other regions and substantially higher in Asia, but again, the limited number of studies from regions outside of North America and Western Europe do not allow robust regional comparisons.
Mortality from causes other than AIDS appears to be consistently higher among men compared to women who inject. The same direction of difference in mortality between men and women was also seen in the previous analysis examining all-cause mortality. Of note is the observation from that analysis that while pooled all-cause CMRs were higher for men than for women, all-cause SMRs were higher for women than for men, suggesting that women who inject experience much higher rates of excess mortality relative to their age-matched non-drug-using peers than is the case for men who inject.
People who inject drugs, who are HIV-positive, appear to experience substantially greater levels of mortality from non-AIDS-related causes then HIV-negative PWID. Explanations for such a difference were unable to be explored directly through the current analysis. Further research to understand this observation might examine whether or not HIV-positive PWID have poorer physical health, are more likely to experience social disadvantage or are more likely to engage in various risky behaviours that might contribute to HIV acquisition as well as fatal outcomes such as drug overdose.
The review also found that OST reduces non-AIDS mortality risk during periods when individuals were receiving treatment. Previous research has also shown that specific periods in and out of treatment vary in risk, with the first weeks in or out of treatment being the riskiest for elevated mortality [7]. Although it is known that OST availability varies considerably across countries, the data on OST coverage are limited at best [54], and typically cannot be extrapolated back to the periods in which these cohort studies were undertaken, making it difficult to make pooled estimates of the potential variation in non-AIDS mortality according to country-level OST coverage.
Examining differences in mortality from cohort studies is subject to a number of limitations. The studies identified for inclusion in the current analysis were predominantly from HICs, in particular, countries in Western Europe. It would clearly be unwise to assume that mortality is consistent across populations of injectors, pointing to a need for new research in countries where injecting is known to occur, but little or no research has examined this.
The occurrence of AIDS-related deaths among those designated HIV-negative in a number of studies highlights the limitation of relying on HIV status measured at baseline only. This results in those who contract HIV during the follow-up period being assigned to the HIV-negative group for the duration of the study. Future research in this area would benefit from assessing and recording individuals HIV status at multiple time points. Ascertaining cases of death within a cohort can also present challenges, particularly in settings without established death notification and registration systems. Reliable information on cause of death may also be unavailable and misattribution of AIDS or non-AIDS-related causes may occur.
The cohorts included in this analysis spanned significant eras of the HIV epidemic including the introduction, increasing availability and improving efficacy of ART, progress which has had an enormous impact on morbidity and survival among people living with HIV.
Few of the studies included in this review met endorsed criteria for reporting cohort studies (such as the STrengthening the Reporting of OBservational studies in Epidemiology (STROBE) consensus statement [55]). Important data, including standard parameters such as ‘person years of follow-up’, were for many studies inconsistently reported, absent or could not easily be calculated, particularly for estimates disaggregated by different characteristics.
Searches to identify studies of this nature in the peer-reviewed literature are fallible. Recent research may be difficult to access, given the typical delay from when research is conducted to being published in peer-reviewed journals. There is also a well recognized under-representation of research from LMICs in the peer-reviewed literature [56,57]. As described for our earlier review, we attempted to address these limitations by using multiple methods to source literature including surveying a broad network of experts in the field about unpublished studies. We primarily reviewed English-language documents, though the abstracts of non-English language peer-reviewed articles were reviewed when available in English and translation was undertaken when papers appeared relevant.
We also draw attention to the limitations of using meta-analytical methods to aggregate results from observational studies. These methods were originally developed for synthesizing findings from randomized controlled trials, which have the benefit that preconditions and sample factors that might influence observed outcomes can be controlled or adjusted for [58]. Controlling such factors is not possible in observational studies, and as highlighted, the settings and characteristics of the cohorts included in the current review are diverse. Recognizing this marked heterogeneity, we sought to explore factors important to mortality by looking at within-study differences between groups (by sex, HIV status and OST exposure) and then pooling the relative differences across studies.
To better examine the potential for non-AIDS mortality to be higher among HIV-positive injectors, there is a need for cross-national work involving more sophisticated analyses of these kinds of longitudinal cohorts. This might involve the development of consortia of cohort investigators across varied countries who would pool harmonized data across cohorts, and examine multiple issues including but not limited to competing risk analyses of non-AIDS and HIV-related mortality, and better investigation of potential sources of confounding.
In conclusion, non-AIDS-related causes of death and drug overdose in particular remain significant contributors to the high levels of mortality experienced by PWID. A comprehensive response to injecting drug use must include efforts that are effective in reducing mortality by these causes. Non-AIDS-related mortality should be considered in estimates of disease burden and in projections of survival among PWID.
Current knowledge about mortality among PWID is largely informed by evidence from HICs. Data that are available suggest substantial differences in mortality between HICs and LMICs. Multiple factors are likely to contribute to the differing levels of risk observed and warrant further investigation in these neglected settings.
Across a diversity of settings, men who inject drugs and PWID who are HIV-positive are at elevated risk of non-AIDS mortality compared to women and HIV-negative PWID, respectively. The limited number of studies and the marked heterogeneity of the cohorts considered in this review, however, limit our ability to make generalizable assertions, quantifying the risk conferred by these factors.
Exposure to OST significantly reduces non-AIDS mortality and remains essential to an effective and comprehensive public health strategy, addressing injecting drug use that must also be responsive to identified risk.
Acknowledgements
Conflicts of interest
There are no conflicts of interest to declare.
References
- 1.Darke S, Degenhardt L, Mattick RP. Mortality amongst illicit drug users. Cambridge: Cambridge University Press; 2006. [Google Scholar]
- 2.Degenhardt L, Bucello C, Mathers B, Briegleb C, Ali H, Hickman M, et al. Mortality among regular or dependent users of heroin and other opioids: a systematic review and meta-analysis of cohort studies. Addiction 2011; 106:32–51. [DOI] [PubMed] [Google Scholar]
- 3.Degenhardt L, Singleton J, Calabria B, McLaren J, Kerr T, Mehta S, et al. Mortality among cocaine users: a systematic review of cohort studies. Drug Alcohol Depend 2011; 113:88–95. [DOI] [PubMed] [Google Scholar]
- 4.Singleton J, Degenhardt L, Hall W, Zabransky T. Mortality among people who use amphetamines: s systematic review of cohort studies. Drug Alcohol Depend 2009; 105:1–8. [DOI] [PubMed] [Google Scholar]
- 5.Mathers BM, Degenhardt L, Bucello C, Lemon J, Wiessing L, Hickman M. Mortality among people who inject drugs: a systematic review and meta-analysis. Bull World Health Organ 2013; 91:102–123. [DOI] [PMC free article] [PubMed] [Google Scholar]
- 6.Calabria B, Phillips B, Singleton J, Mathers B, M., Congreve E, Degenhardt L, et al. Searching the grey literature to access information on drug and alcohol research: A resource to identify drug related databases and websites. In National Drug and Alcohol Research Centre Technical Report Number 293. Sydney; 2008. [Google Scholar]
- 7.Degenhardt L, Randall D, Hall W, Butler T, Law M, Burns L. Mortality among clients of a state-wide opioid pharmacotherapy program over 20 years: risk factors and lives saved. Drug Alcohol Depend 2009; 105:9–15. [DOI] [PubMed] [Google Scholar]
- 8.World Bank. The World Bank: country and lending groups. The World Bank Group; http://data.worldbank.org/about/country-and-lending-groups [Accessed 1 February 2014]. [Google Scholar]
- 9.StataCorp. Stata v12.1. Texas: StataCorp; 2011. [Google Scholar]
- 10.Der Simonian R, Laird N. Meta-analysis in clinical trials. Control Clin Trials 1986; 7:177–188. [DOI] [PubMed] [Google Scholar]
- 11.Sharp S, Sterne J. Meta-analysis. Stata Tech Bull 1997; 38:9–14. [Google Scholar]
- 12.Huang YF, Kuo HS, Lew-Ting CY, Tian F, Yang CH, Tsai TI, et al. Mortality among a cohort of drug users after their release from prison: an evaluation of the effectiveness of a harm reduction program in Taiwan. Addiction 2011; 106:1437–1445. [DOI] [PubMed] [Google Scholar]
- 13.Digiusto E, Shakeshaft A, Ritter A, O’Brien S, Mattick R. Serious adverse events in the Australian National Evaluation of Pharmacotherapies for Opioid Dependence (NEPOD). Addiction 2004; 99:450–460. [DOI] [PubMed] [Google Scholar]
- 14.Tait RJN, Hanh Thi T, Hulse Gary K. Mortality in heroin users 3 years after naltrexone implant or methadone maintenance treatment. J Subst Abuse Treat 2008; 35:116–124. [DOI] [PubMed] [Google Scholar]
- 15.Bauer SM, Loipl R, Jagsch R, Gruber D, Risser D, Thau K, et al. Mortality in opioid-maintained patients after release from an addiction clinic. Eur Addict Res 2008; 14:82–91. [DOI] [PubMed] [Google Scholar]
- 16.Miller CL, Kerr T, Strathdee SA, Li K, Wood E. Factors associated with premature mortality among young injection drug users in Vancouver. Harm Reduct J 2007; 4:1. [DOI] [PMC free article] [PubMed] [Google Scholar]
- 17.Lejckova P, Mravcik V. Mortality of hospitalized drug users in the Czech Republic. J Drug Issues 2007; 37:103–118. [Google Scholar]
- 18.Zábransky T, Csémy L, Grohmannová K, Janíková B, Brenza J. Mortality of cohort of very young injecting drug users in Prague, 1996–2010. Central European Journal of Public Health 2011; 19:152–157. [DOI] [PubMed] [Google Scholar]
- 19.Golz J, Moll A, Nzimegne S, Klausen G, Schleehauf D. Comparison of antiretroviral therapy in IVDU and MSM: a retrospective study 1996–2000. Suchtmedizin in Forschung und Praxis 2001; 3:25–33. [Google Scholar]
- 20.Antolini G, Pirani M, Morandi G, Sorio C. Gender difference and mortality in a cohort of heroin users in the Provinces of Modena and Ferrara, 1975–1999. Epidemiologiae Prevenzione 2006; 30:91–99. [PubMed] [Google Scholar]
- 21.Bargagli AM, Sperati A, Davoli M, Forastiere F, Perucci C. Mortality among problem drug users in Rome: An 18-year follow-up study, 1980–97. Addiction 2001; 96:1455–1463. [DOI] [PubMed] [Google Scholar]
- 22.Brancato V, Delvecchio G, Simone P. Survival and mortality in a cohort of heroin addicts in 1985–1994. Minerva Medica 1995; 86:97–99. [PubMed] [Google Scholar]
- 23.Ciccolallo L, Morandi G, Pavarin R, Sorio C, Buiatti E. Mortality risk in intravenous drug users in Emilia Romagna region and its socio-demographic determinants. Results of a longitudinal study. Epidemiologia e Prevenzione 2000; 24:75–80. [PubMed] [Google Scholar]
- 24.Ferri M, Bargagli A, Faggiano F, Belleudi V, Salamina G, Vigna-Taglianti F, et al. Mortality of drug users attending public treatment centers in Italy 1998–2001: a cohort study. Epidemiologia e Prevenzione 2007; 31:276–282. [PubMed] [Google Scholar]
- 25.Galli M, Musicco M. Mortality of intravenous drug users living in Milan, Italy: role of HIV-1 infection. COMCAT Study Group. AIDS 1994; 8:1457–1463. [DOI] [PubMed] [Google Scholar]
- 26.Goedert J, Pizza G, Gritti F, Costigliola P, Boschini A, Bini A, et al. Mortality among drug users in the AIDS era. Int J Epidemiol 1995; 24:1204–1210. [DOI] [PubMed] [Google Scholar]
- 27.Manfredi R, Sabbatani S, Agostini D. Trend of mortality observed in a cohort of drug addicts of the metropolitan area of Bologna, North-Eastern Italy, during a 25-year-period. Collegium Antropologicum 2006; 30:479–488. [PubMed] [Google Scholar]
- 28.Moroni M, Galli M. Causes of death in a cohort of intravenous-drug-users (IVDUs) recruited in Milan. AIDS Res Human Retrovirus 1991; 7:241–242. [Google Scholar]
- 29.Zaccarelli M, Gattari P, Rezza G, Conti S, Spizzichino L, Vlahov D, et al. Impact of HIV infection on non-AIDS mortality among Italian injecting drug users. AIDS 1994; 8:345–350. [DOI] [PubMed] [Google Scholar]
- 30.Van Haastrecht HJA, Van Ameijden EJC, Van Den Hoek JAR, Mientjes GHC, Bax JS, Coutinho RA. Predictors of mortality in the Amsterdam cohort of human immunodeficiency virus (HIV)-positive and HIV-negative drug users. Am J Epidemiol 1996; 143:380–391. [DOI] [PubMed] [Google Scholar]
- 31.Eskild A, Magnus P, Samuelsen SO, Sohlberg C, Kittelsen P. Differences in mortality rates and causes of death between HIV positive and HIV negative intravenous drug users. Int J Epidemiol 1993; 22:315–320. [DOI] [PubMed] [Google Scholar]
- 32.Jarrin I, Lumbreras B, Ferreros I, Perez-Hoyos S, Hurtado I, Hernandez-Aguado I. Effect of education on overall and cause-specific mortality in injecting drug users, according to HIV and introduction of HAART. Int J Epidemiol 2007; 36:187–194. [DOI] [PubMed] [Google Scholar]
- 33.Lumbreras B, Jarrin I, del Amo J, Pérez-Hoyos S, Muga R, Garcia-de la Hera M, et al. Impact of hepatitis C infection on long-term mortality of injecting drug users from 1990 to 2002: differences before and after HAART. AIDS 2006; 20:111–116. [DOI] [PubMed] [Google Scholar]
- 34.Sanchez-Carbonell X, Seus L. Ten-year survival analysis of a cohort of heroin addicts in Catalonia: the EMETYST project. Addiction 2000; 95:941–948. [DOI] [PubMed] [Google Scholar]
- 35.Fugelstad A, Rajs J, Bottiger M, Gerhardsson de Verdier M. Mortality among HIV-infected intravenous drug addicts in Stockholm in relation to methadone treatment. Addiction 1995; 90:711–716. [DOI] [PubMed] [Google Scholar]
- 36.Fugelstad A, Annell A, Rajs J, Agren G. Mortality and causes and manner of death among drug addicts in Stockholm during the period 1981–1992. Acta Psychiatr Scand 1997; 96:169–175. [DOI] [PubMed] [Google Scholar]
- 37.Fugelstad A, Agren G, Romelsjo A. Changes in mortality, arrests, and hospitalizations in nonvoluntarily treated heroin addicts in relation to methadone treatment. Subst Use Misuse 1998; 33:2803–2817. [DOI] [PubMed] [Google Scholar]
- 38.Copeland L, Budd J, Robertson JR, Elton RA. Changing patterns in causes of death in a cohort of injecting drug users, 1980–2001. Arch Internal Med 2004; 164:1214–1220. [DOI] [PubMed] [Google Scholar]
- 39.Frischer M, Goldberg D, Rahman M, Berney L. Mortality and survival among a cohort of drug injectors in Glasgow, 1982–1994. Addiction 1997; 92:419–427. [PubMed] [Google Scholar]
- 40.Hickman M, Carnwath Z, Madden P, Farrell M, Rooney C, Ashcroft R, et al. Drug-related mortality and fatal overdose risk: pilot cohort study of heroin users recruited from specialist drug treatment sites in London. J Urban Health 2003; 80:274–287. [DOI] [PMC free article] [PubMed] [Google Scholar]
- 41.Oppenheimer E, Tobutt C, Taylor C, Andrew T. Death and survival in a cohort of heroin addicts from London clinics: A 22-year follow-up study. Addiction 1994; 89:1299–1308. [DOI] [PubMed] [Google Scholar]
- 42.Fingerhood M, Rastegar DA, Jasinski D. Five year outcomes of a cohort of HIV-infected injection drug users in a primary care practice. J Addict Dis 2006; 25:33–38. [DOI] [PubMed] [Google Scholar]
- 43.Goedert JJ, Fung MW, Feltona S, Battjesb RJ, Engels EA. Cause-specific mortality associated with HIV and HTLV-II infections among injecting drug users in the USA. AIDS 2001; 15:1295–1302. [DOI] [PubMed] [Google Scholar]
- 44.McAnulty JM, Tesselaar H, Fleming DW. Mortality among injection drug users identified as ‘out of treatment’. Am J Public Health 1995; 85:119–120. [DOI] [PMC free article] [PubMed] [Google Scholar]
- 45.Vlahov D, Galai N, Safaeian M, Galea S, Kirk GD, Lucas GM, et al. Effectiveness of highly active antiretroviral therapy among injection drug users with late-stage human immunodeficiency virus infection. Am J Epidemiol 2005; 161:999–1012. [DOI] [PMC free article] [PubMed] [Google Scholar]
- 46.Vlahov D, Wang C, Ompad D, Fuller CM, Caceres W, Ouellet L, et al. Mortality risk among recent-onset injection drug users in five U.S. cities. Subst Use Misuse 2008; 43:413–428. [DOI] [PubMed] [Google Scholar]
- 47.Cardoso MN, Caiaffa WT, Mingoti SA. AIDS incidence and mortality in injecting drug users: the AjUDE-Brasil II Project. Cadernos de Saude Publica 2006; 22:827–837. [DOI] [PubMed] [Google Scholar]
- 48.Solomon S, Celentano D, Srikrishnan A, Vasudevan C, Lucas G, Mehta S, et al. Mortality among injection drug users in Chennai, India (2005–2008). AIDS 2009; 23:997–1004. [DOI] [PMC free article] [PubMed] [Google Scholar]
- 49.Moskalewicz J, Sieroslawski J. Mortality of narcotic addicts using injections. Przeglad Epidemiologiczny 1996; 50:323–332. [PubMed] [Google Scholar]
- 50.Quan VM, Vongchak T, Jittiwutikarn J, Kawichai S, Srirak N, Wiboonnatakul K, et al. Predictors of mortality among injecting and noninjecting HIV-negative drug users in northern Thailand. Addiction 2007; 102:441–446. [DOI] [PubMed] [Google Scholar]
- 51.Quan VM, Minh NL, Ha TV, Ngoc NP, Vu PT, Celentano DD, et al. Mortality and HIV transmission among male Vietnamese injection drug users. Addiction 2010; 106:583–589. [DOI] [PMC free article] [PubMed] [Google Scholar]
- 52.Evans JL, Tsui JI, Hahn JA, Davidson PJ, Lum PJ, Page K. Mortality among young injection drug users in San Francisco: a 10-year follow-up of the UFO study. Am J Epidemiol 2012; 175:302–308. [DOI] [PMC free article] [PubMed] [Google Scholar]
- 53.Davoli M, Bargagli AM, Perucci CA, Schifano P, Belleudi V, Hickman M, et al. Risk of fatal overdose during and after specialist drug treatment: the VEdeTTE study: a national multisite prospective cohort study. Addiction 2007; 102:1954–1959. [DOI] [PubMed] [Google Scholar]
- 54.Mathers BM, Degenhardt L, Ali H, Wiessing L, Hickman M, Mattick RP, et al. HIV prevention, treatment, and care services for people who inject drugs: a systematic review of global, regional, and national coverage. Lancet 2010; 375:1014–1028. [DOI] [PubMed] [Google Scholar]
- 55.Vandenbroucke J, von Elm E, Altman D, Gotzsche P, Mulrow C, Pocock S, et al. Strengthening the reporting of observational studies in epidemiology (STROBE): explanation and elaboration. Epidemiology 2007; 18:805–835. [DOI] [PubMed] [Google Scholar]
- 56.Sumathipala A, Siribaddana S, Patel V. Under-representation of developing countries in the research literature: ethical issues arising from a survey of five leading medical journals. BMC Med Ethics 2004; 5:5. [DOI] [PMC free article] [PubMed] [Google Scholar]
- 57.Falagas ME, Bliziotis IA, Kondilis B, Soteriades ES. Eighteen years of research on AIDS: contribution of and collaborations between different world regions. AIDS Res Human Retrovirus 2006; 22:1199–1205. [DOI] [PubMed] [Google Scholar]
- 58.Kulinskaya E, Morgenthaler S, Staudte R. Meta analysis: a guide to calibrating and combining statistical evidence. Wiley-Interscience; 2008. [Google Scholar]