

Abstract
Objective:
Describe modifications to the latest version of the Joint United Nations Programme on AIDS (UNAIDS) Estimation and Projection Package component of Spectrum (EPP 2013) to improve prevalence fitting and incidence trend estimation in national epidemics and global estimates of HIV burden.
Methods:
Key changes made under the guidance of the UNAIDS Reference Group on Estimates, Modelling and Projections include: availability of a range of incidence calculation models and guidance for selecting a model; a shift to reporting the Bayesian median instead of the maximum likelihood estimate; procedures for comparison and validation against reported HIV and AIDS data; incorporation of national surveys as an integral part of the fitting and calibration procedure, allowing survey trends to inform the fit; improved antenatal clinic calibration procedures in countries without surveys; adjustment of national antiretroviral therapy reports used in the fitting to include only those aged 15–49 years; better estimates of mortality among people who inject drugs; and enhancements to speed fitting.
Results:
The revised models in EPP 2013 allow closer fits to observed prevalence trend data and reflect improving understanding of HIV epidemics and associated data.
Conclusion:
Spectrum and EPP continue to adapt to make better use of the existing data sources, incorporate new sources of information in their fitting and validation procedures, and correct for quantifiable biases in inputs as they are identified and understood. These adaptations provide countries with better calibrated estimates of incidence and prevalence, which increase epidemic understanding and provide a solid base for program and policy planning.
Keywords: antiretroviral therapy, mathematical models, models/projections, people who inject drugs, surveillance
Introduction
Since the mid-1990s, Joint United National Programme on AIDS (UNAIDS) and country partners have periodically produced global estimates of HIV burden for use in both national and global planning processes [1]. These estimates are prepared under the guidance of the UNAIDS Reference Group on Estimates, Modelling and Projections, which continually reviews the quality and availability of epidemiological data, new diagnostic, surveillance and treatment technologies, and evolving statistical and mathematical approaches in order to improve estimates and projections over time [2]. The UNAIDS Estimation and Projections Package (EPP) is the curve-fitting component of the Spectrum suite of tools used for preparing national HIV estimates and collating them globally (the software and documentation are available from http://futuresinstitute.org/spectrum.aspx and http://www.unaids.org/en/dataanalysis/datatools/spectrumepp2013/). EPP regularly implements changes and updates to improve its own methods and technologies as recommended by the Reference Group at its periodic meetings.
The study describes the content of and justification for the key improvements made to EPP 2013 since the previous update in 2011 [3,4]. These improvements include: better choices of the outputs used to represent national prevalence and incidence trends; an expanded selection of models with new calibration procedures; adjustments to the antiretroviral therapy (ART) inputs for ART in those aged 50 years and above; and newly improved estimates of mortality among people who inject drugs (PWID). This study describes the most important changes to provide a better understanding of the tools and techniques being used to project national and global HIV epidemics. The study concludes with a review of ongoing issues under discussion by the Reference Group for possible inclusion in EPP 2015 and subsequent versions.
Methods
Expanded range of models in EPP 2013
The underlying mathematical models for prevalence trends included in EPP have evolved substantially as needs have changed. In 2001, an epidemiologically motivated model was introduced, now referred to as EPP Classic. It remains available in EPP 2013 and is documented in depth in earlier studies [2,5]. EPP Classic is used when the HIV epidemic rises and then settles into a stable prevalence plateau of the type commonly seen in sub-Saharan African or key population epidemics. EPP Classic has a fixed force of infection, r, which is the rate at which susceptible individuals acquire disease. In the real world, this force of infection is determined by the levels, frequency and transmission probabilities of different risk behaviors.
The simple model with a fixed force of infection, however, lacked the flexibility to fit countries such as Uganda, where antenatal clinic (ANC) prevalence fell rapidly as risk behaviors declined in the 1990s [6,7], and then began to rise again between 2005 and 2011 as condom use declined and ART scaled up [8]. Recognizing that risk behaviors might rise and fall over time, which will increase and decrease the force of infection, the variable-r model was introduced in EPP 2011 [3]. In this model, the force of infection r was allowed to vary at each time step, which would allow declines in prevalence followed by resurgences. However, despite attempts to constrain the rates of change, the variable r often produced incidence curves that were quite jagged, rising and falling rapidly over the space of a few years. Many national estimation teams were dissatisfied with the resulting trends, so the attention turned to models that would still allow the force of infection to vary, but which would ensure slower and more believable changes in incidence over time. Two such models were added to EPP 2013: r-spline and r-trend.
The r-spline model allows the force of infection parameter r to vary over time by modeling r(t) as a function of time with splines [9,10]. Smooth curves for r(t) are generated using a Bayesian analog to B-splines in which changes in the slope of r(t)are penalized with a second-degree difference penalty, formulated as prior distributions around changes in adjacent spline coefficients (βi), expressed as [9,11]: βi = βi−1 + (βi−1 − βi−2 + ui)
By allowing u i ∼ Normal(0, τ2)
the amount of smoothness is determined by the variance parameter τ2, which is also estimated, assuming a prior distribution τ2 ∼ [9,11]. The spline basis is comprised of seven evenly spaced basis functions, which results in nine unknown parameters to estimate, namely seven spline coefficients, τ2, and the initial pulse of infection to seed the epidemic [9]. The model is fit via incremental mixture importance sampling [12].
Short-term projections beyond the past year with surveillance data are important outputs from EPP. To facilitate these projections, the r-spline model incorporates a prior distribution for values of r(t) beyond the past year of data that directs the model towards an equilibrium value for prevalence and helps stabilize spline-based trends in r(t) near the data boundary [9]. In a limited number of cases, using the equilibrium prior can lead to rapidly changing, implausible patterns of incidence when projecting beyond the data. To address this, a random-walk approach to projecting with r-spline as described in [10] is implemented. This involves first fitting the spline-based model, including the equilibrium prior for r, to the full projection period (e.g. to 2020), after which the posterior draws for r(t) are truncated at the last year of data, and then for each draw, re-projected beyond the last year of data by modeling changes in r with a random walk. Thus, future projections assume a constant force of infection in expectation. For the random walk, future changes in logr(t) are modeled by drawing from normal distributions to determine new values for r(t) at each time step [i.e. logr(t) ∼ Normal(log r(t), σ2)], using an empirical variance term (σ2) calculated as the mean of the squared differences in adjacent values for r(t) during the in-sample projection period. The variance of the random walk increases proportionally with time since the last year with observed data, modeled as σ2t = σ2t1(t1−t2) where t1, is the last year with observed data, so that variability increases with the duration of the prediction. This approach to projection was validated with out-of-sample posterior predictive checks, and compared favorably to the variable-r model in EPP 2011 [10].
The r-trend model [13] offers a compromise between the variable-r model and the EPP Classic model by summarizing the most likely trends of infection rates in a parsimonious way. For instance, the force of infection starts at a high level to initiate the epidemic, gradually declines as the epidemic spreads out in the general population, and changes less dramatically in the late period, for example, after 2000, compared to the starting period. To acknowledge these commonly observed phenomena, the r-trend model assumes a systematic change of the force of infection on the log scale: log(rt+1) − log(rt)= β1(β0−rt)+ β2ρt+ β3Γt
where ρt is HIV prevalence and Γt is the relative change of prevalence in the late period of the epidemic. In addition to βs, the input parameters include the starting time of epidemic, the initial value of the force of infection, and the bias between ANC data and national population based survey data. Informative prior distributions for those parameters have been derived by summarizing results from 62 datasets, so that information on the dynamics of HIV/AIDS epidemics is pulled together across multiple countries.
Figure 1 shows a comparison of the fits to prevalence and incidence resulting from the three models with varying r(t) described above. The r-trend and r-spline models produce smoother incidence curves than the variable-r model, which better agrees with the expectation that the force of infection will evolve smoothly over time. Given the variety of models available in EPP 2013, UNAIDS ran a careful comparison of the different models on a large variety of country data sets. The two newer ‘smooth-r’ models generally outperformed the variable-r and EPP Classic models, providing closer fits to the data on a number of metrics. This led UNAIDS to develop a set of guidance summarized in the flow chart shown in Fig. 2.
Fig. 1.
Prevalence fits and incidence trends produced by the variable-r, r-trend and r-spline models on the same urban data set from (a) Kenya urban and (b) Rwanda.
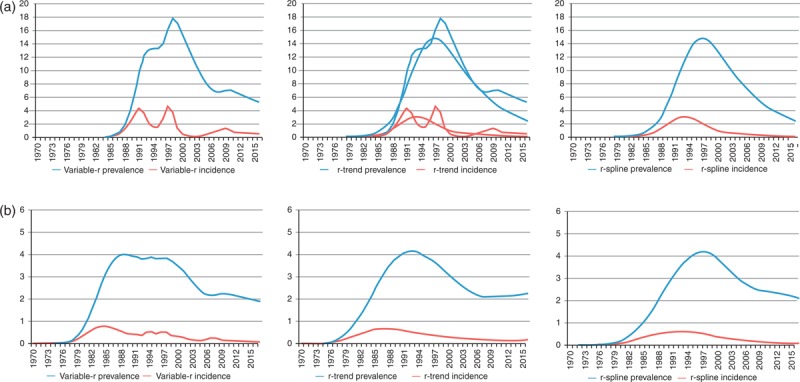
Note how the latter two models produce smoother incidence trends over the time frame of the projection.
Fig. 2.
Flow chart for choice of model to use for fitting.
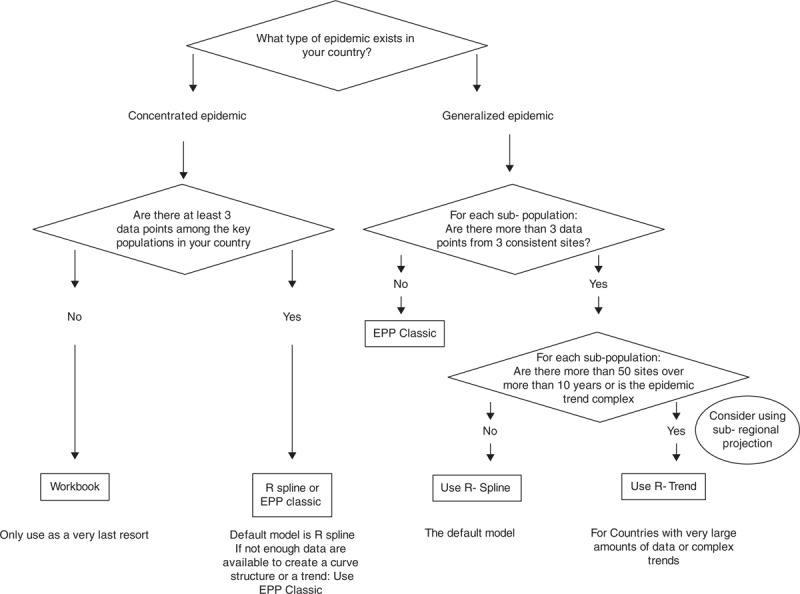
The algorithm above is recommended for deciding which of the three models (r-spline, r-trend or EPP Classic) should be used depending on the type of epidemic, number of sites and number of data points.
It is worth noting, however, that experience with these models in large numbers of countries has shown that the guidance provided should not be strictly followed if there is reason to believe that the character, quality and coverage of surveillance sites have been changing over time. In some cases, the more rigid ‘epidemiological’ structure imposed by EPP Classic may be preferable to allowing those models that vary r over time to follow too closely data with its own problems.
Shifting to the Bayesian median as a better measure of ‘best fit’
Versions of EPP prior to 2013 created the national best fit curve as a sum of the maximum likelihood estimates for each subpopulation. The maximum likelihood estimate was defined as that model-generated curve which maximizes the likelihood of the data given the model. In reviewing the results of the 2009 and 2011 rounds of projections in sparse data settings, two key issues were noted that were substantially altering the national projections in a few countries. The first issue was that where data for a key population are very sparse, which is a common occurrence in concentrated epidemic settings, the maximum likelihood estimate could vary substantially with the addition of just a single data point. The top set of graphs in Fig. 3 shows an example of the variation that sometimes occurred in sparse data situations with the addition of a single point. Such changes in one or more of the maximum likelihood estimates chosen for key subpopulations could substantially alter national fits in regions such as Latin America where data were often limited.
Fig. 3.
Top: an example of major changes in the best fit curve in a sparse data situation when an additional data point is added.
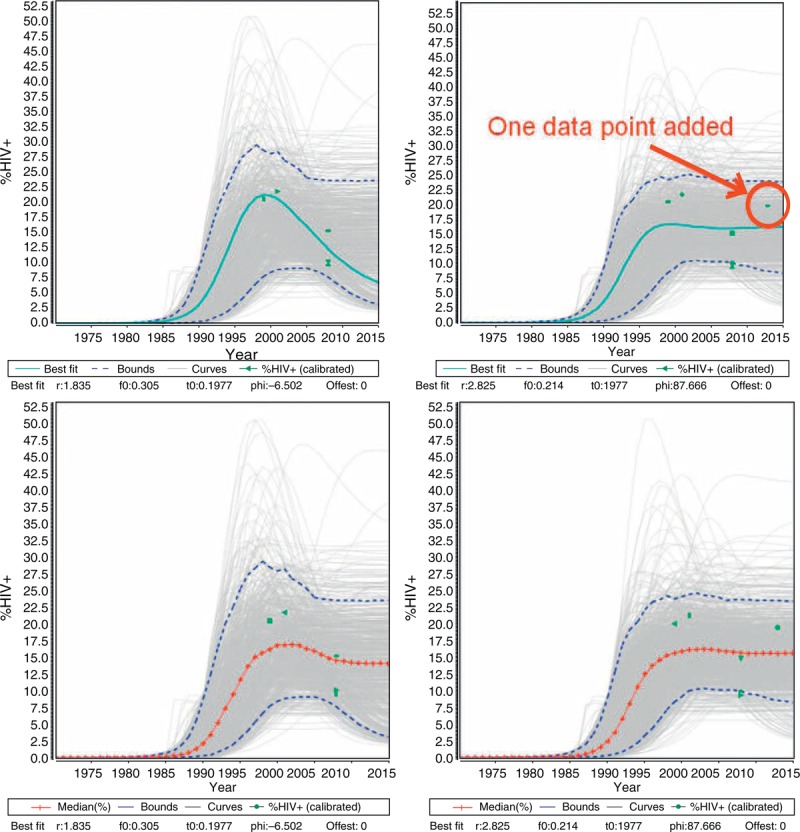
The blue curve is the maximum likelihood estimate before and after the addition of a single additional data point. Bottom: The same data set fit using the Bayesian median as the measure of ‘best fit’ instead of the maximum likelihood estimate. Note the increased stability in the trend.
Using a single curve to represent the fit failed to capture the diversity of possible epidemic curves that were consistent with the data. In Fig. 3, each of the gray curves shown is a possible fit to the data. The dashed blue lines represent the 5th and 95th percentiles of point estimates taken from the 3000 resampled curves in any given year. To better represent the mix of possible curves, EPP 2013 now reports the year-by-year median of those curves resampled during the Bayesian fitting procedure as the summary measure for EPP on prevalence; incidence is estimated the same way, as a median of the resampled incidence curves corresponding to each prevalence curve. These are referred to as the Bayesian medians. As the bottom set of graphs in Fig. 3 shows, this produces a much more stable curve when minimal additional data are added. This greatly improved the stability of fits, especially in sparse data situations.
Better assessing the early stages of the epidemic
The second issue that often altered both fitted prevalence curves and the resulting mortality estimates was the shape of the curve during early years of the epidemic. Some countries had relatively little data before the natural history peak of the prevalence curve; in such situations the earlier phases of the epidemic could vary greatly depending on the model chosen. The models vary in the way in which they initiate the epidemic. EPP Classic and r-trend create a specified low prevalence of HIV infection (0.0025%) in a start year that varies over a specified range of possible years, whereas r-spline allows the prevalence level of this initial pulse of infection to vary, but uses a fixed start year. In limited early data situations this often led to substantial differences in the shape of the prevalence curves during the earliest stages of the epidemic.
In order to address this, a Data Check page was added which allowed countries to compare the trend in early reported AIDS cases and HIV infections with the trends predicted by the model. With assistance from WHO, a database for AIDS cases was developed and is included with the Spectrum/EPP software. For each country the database contains the number of reported AIDS cases between 1979 and 2001. Alternatively, countries can enter their own reported AIDS or HIV infection data. The EPP Data Check page then allows comparison of the trends in the reported cases with the model predictions; the reported cases can also be adjusted to put them on the same scale as the model predictions. This provides feedback on whether the epidemic is starting too early or too late, and allows a return to the fitting page to adjust epidemic start times and rates of growth. Figure 4 shows two examples comparing against AIDS cases. On the top, the model predicts too early a start compared to the rate of growth in AIDS cases, whereas the trend on the bottom looks reasonable. Of course, interpretation of the reported trends must be informed by an understanding of the AIDS and HIV reporting systems in the country and how capture rates and reporting fractions have evolved over time.
Fig. 4.
The EPP Data Check page allows users to compare reported AIDS case and HIV infection trends with those predicted by the model.
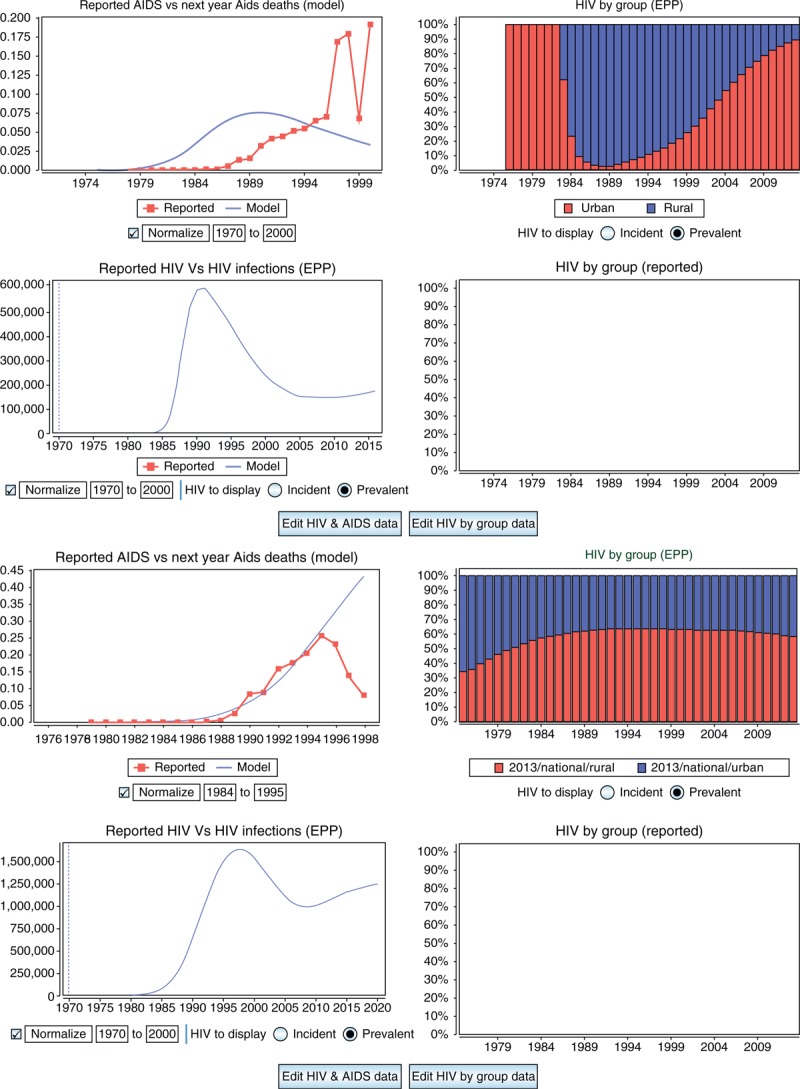
In cases when there is no early surveillance data, this can help countries to set a reasonable start time and early trend for their epidemics. The projection on the top is starting too early, while the one on the bottom gives a reasonable fit through the period when AIDS case reporting dropped off. EPP, Estimation and Projection Package component of Spectrum.
National surveys in the fitting and calibration procedures
In the earlier versions of EPP, fitting was first done to the ANC data alone excluding any national survey data. Normally, these curves would come out high relative to the national surveys. After a set of curves was resampled in a Bayesian framework, a subsequent step calculated an average downward calibration for these resampled curves across all national survey years. Once this calibration was applied to each ANC curve, the likelihood of each down-calibrated curve relative to the national survey data in the country was combined with the ANC likelihood to estimate the overall likelihood. Then a final resampling step on the combined likelihoods was taken to get the final sample of curves displayed in the EPP interface. This procedure evolved incrementally as survey data became more readily available.
In EPP 2013, the decision was made to rethink this approach holistically. Instead of down-calibrating after fitting, it was decided to treat the surveys as the ‘gold standard’ to which the model should be fit. Thus, an additional calibration parameter for the ANC data was added to the set of model parameters, recognizing that ANC data were generally higher than the national prevalence estimates. The likelihood is calculated based on the probit-transformed prevalence for ANC data, Wst, and survey data, Wt, respectively: 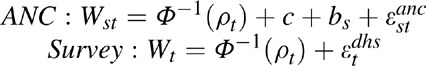
where Φ−1 (ρt) is the probit-transformed model prevalence at time t;c is the calibration constant for the ANC data, expressed as a probit-offset; bs is a random effect for site s; and εtanc and εtdhs are error terms for the ANC and national survey, respectively. Φ−1 is the inverse of the cumulative standard normal distribution. A prior distribution for the calibration parameter, c, was specified by a normal distribution with mean of 0.15 and an SD of 1.0, and samples from this distribution were used to calibrate the ANC data during the likelihood calculation. The national survey likelihoods are therefore calculated based on uncalibrated curves and combined with the down-calibrated ANC likelihoods during the fitting process. The outcome then is a set of curves with different calibration parameters for the ANC data which tries to fit the shape of both the ANC and survey data. These calibration parameters are then averaged to give the overall adjustment required for the ANC data relative to the surveys.
The advantages to this approach include: surveys, which are considered more representative than the ANC data and are at the core of the fitting process; in countries with multiple surveys, the trend in the surveys themselves inform the shape of the prevalence curve; and a wider range of curves is considered than was the case with the older method, which might reject curves that were good fits to the survey data during the initial ANC data only resampling.
Improvements to ANC calibration in countries without surveys
There are a limited number of generalized epidemic countries without national surveys: Angola, Eritrea, Gambia, Namibia and Togo. In order to estimate the ANC calibrations needed in these countries, a review was undertaken using the methodology first developed by Gouws et al.[14] with an updated set of 48 population prevalence surveys in 24 countries. This analysis calculated median survey : ANC ratios (CCr) and mean probit offsets (CCp) for application to postfitting calibrations in urban and rural settings. The CCr is the median of ratios of the survey prevalence to the ANC prevalence across available countries and survey years in the specified region, whereas the CCp is the median of the difference between the probit-transformed prevalence for each survey, Φ−1(ρtdhs), and that year's probit-transformed fitted ANC prevalence, Φ−1(ρtans).
Table 1 presents these results as calculated for 3 regions in Africa: Eastern, Southern and Western/Central. This work is discussed in more depth in Marsh et al. elsewhere in this volume [15]. The key findings of this study included recognizing that substantial variation in the calibrations was required from country to country. As such, the single urban/rural adjustment used in past versions of EPP may have distorted the levels of previous curves in some countries without surveys. The results agreed fairly well with the previous downward urban adjustments, but found a larger downward adjustment was needed for rural epidemics. However, as fewer and fewer generalized epidemic countries are without surveys, these results should not substantially alter global estimates.
Table 1.
Values of the ANC ratios (CCr) and mean probit offsets (CCp) used for calibration of ANC data.
| Urban | Rural | |||
| Data source/region | CCr | CCp | CCr | CCp |
| ANC-fitted data (all surveys) | ||||
| Eastern Africa | 1.023 | 0.012 | 0.940 | −0.027 |
| Southern Africa | 0.841 | −0.142 | 0.937 | −0.038 |
| Western/Central Africa | 0.699 | −0.165 | 0.594 | −0.236 |
| All countries | 0.810 | −0.112 | 0.675 | −0.171 |
These are calculated for urban and rural settings in three regions of Africa.
ANC, antenatal clinic.
Adjusting numbers on antiretroviral therapy to include only 15–49-year-old adults
Spectrum and EPP incorporate national data about the number of adults on ART to account for the increased survival for those on treatment when inferring trends in HIV incidence from the HIV prevalence data to which the model is calibrated. National data inputted into Spectrum report the total number of adults over the age of 15 years who are on ART. In the past, these data were passed directly to EPP from Spectrum. However, because the EPP population model represents only the population aged 15–49 years, EPP 2013 includes an adjustment of the number of adults on ART from Spectrum to account for the proportion who are over 50 years. Failing to adjust the number of adults on ART to represent only the population aged 15–49 years will result in underestimating HIV incidence and overestimating the decline in incidence rate during the ART period. This is because assuming that too large a fraction of 15–49-year-old adults are on ART will result in fewer HIV deaths and thus fewer new infections required to produce the observed HIV prevalence.
As ART programs mature, HIV patients on treatment survive to older ages, increasing the proportion of adults on ART who are over the age of 50 years. A study of the fraction of adult ART patients who are over 50 years from 2005 to 2010 in Rwanda, Kenya, Mozambique, and Tanzania based on patient data from clinics supported by International Center for AIDS Care and Treatment Programs (Columbia University) (ICAP) found 10% of adult ART patients were over the age of 50 years with the number increasing over time [16]. This increase is projected to continue as ART programs mature (Fig. 5). Future changes in ART eligibility towards earlier initiation could increase the share of younger adults on treatment for a time, but the long-term trend will be towards an increasing proportion of older adults on treatment, especially in settings of declining incidence. Figure 5 shows several trends as projected by the age-structured model for those on ART in Spectrum.
Fig. 5.
Percentage of population on ART over age 50 for 2005 to 2020 for various countries.
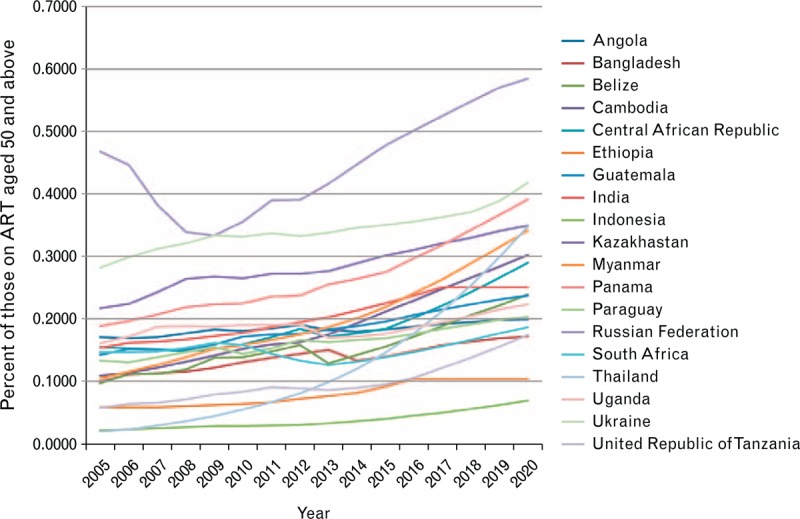
These trends were generated by Spectrum based on epidemic patterns, eligibility criteria, and trends in antiretroviral therapy (ART) uptake.
EPP 2013 has been revised to adjust for the percentage of adults on ART who are 15–49 years old dynamically accounting for the maturity of the ART program and ART eligibility. The Spectrum model initiates HIV-positive adults on treatment according to their eligibility and ART need to achieve the number of adults on ART at the end of the year in national reporting (Stover et al., this volume) [17]. These persons are removed according to age and duration-specific mortality rates for people on ART, allowing calculation of the percentage of ART patients who are less than 50 years of age. This is passed to EPP for incidence estimation in a Spectrum-generated database.
Improved mortality estimates for people who inject drugs
Compared to their nondrug-using peers, PWID experience higher rates of mortality from non-AIDS-related causes, most commonly due to fatal drug overdose [18]. This excess non-AIDS mortality was previously accounted for in EPP by applying a higher per-capita mortality rate for this key population, set as the additional mortality attributed to being an injecting drug user added to the mortality rate of the general population [19]. The default value for injecting drug use-specific additional mortality was set as 1.08% per year on the basis of a 2006 review of 31 studies (all from high-income countries) measuring mortality in cohorts of PWID [20].
A more recent systematic review and meta-analysis which included a greater number of studies from a more diverse range of settings [21] was updated to derive revised estimates of non-AIDS mortality among PWID (see Mathers et al. in this supplement for further details) [22]. The pooled crude mortality rate for non-AIDS mortality of 2.51 [95% confidence interval (CI) 1.96, 3.05] per 100 person-years of follow-up among HIV-positive injecting drug users derived from this analysis has now been applied in EPP as the default additional mortality rate for PWID, whereas a somewhat lower 1.6 per 100 person-years is used for HIV-negative PWID.
The continued lack of data from low and middle-income countries and the substantial heterogeneity of the cohorts available for inclusion in this analysis prevented the derivation of suitably robust estimates of non-AIDS mortality specific to geographic regions, country income level, or the availability of interventions (namely opioid substitution therapy) that are known reduce drug use related mortality (Mathers et al., this supplement) [22].
Other improvements to speed fitting
The variable-r model used in EPP 2011 was extremely slow in fitting countries with large numbers of surveillance sites. A number of changes and recommendations have been made to speed this. First, the algorithms for r-spline and r-trend are substantially faster because they have fewer overall parameters to be fit relative to the variable-r model. Second, EPP 2013 can take advantage of the multiple compute cores available in new processors. On the Model Parameters page, the number of cores to be used can be set, which will generally produce a speed-up comparable to the number of cores used. Finally, the Reference Group is strongly encouraging those countries with large numbers of sites to move from national urban/rural models to subnational regional models, taking advantage of the large amount of data they have to provide more local information to guide local responses. Together, these have resulted in much faster fitting and improved user experiences.
Results and discussion
The changes described above have led to substantial improvements in the user experience with EPP. Fitting with the new models is substantially faster and the resulting curves are generally smoother than was the case with the earlier variable-r model. The shift from a maximum likelihood estimate to the Bayesian median of resampled curves has provided less variability and more stability to country models from round to round, while simultaneously encouraging more focus on the range of possible fits to the data in sparse data settings. Encouraging use of early AIDS case data in setting presurveillance trends improves the early stages of the fits, providing more realistic start years and early epidemic trends. Updates in the use of national surveys, improved calibration for generalized epidemics without surveys, and better handling of the impacts of ART in those aged 50 years and above and of mortality among PWID bring EPP's projections closer to reality. The revised models in EPP 2013 allow closer fits to observed prevalence trend data and correct for improving understanding of HIV epidemics and associated data.
As always, EPP is, however, a work in progress. In the very near future, a number of key issues are likely to require further improvements and modifications. The dynamic model in EPP reconstructs the HIV prevalence, incidence and mortality in the past. However, only prevalence datasets from ANCs, other surveillance sources, and national surveys have been used to validate the model outputs so far. Today, new information on HIV incidence, for example, incidence assays based on biomarkers, and HIV mortality, for example, vital registration data in Latin America have become available. Those datasets may be used by the EPP model to gain more insight into the epidemics. For instance, Bao et al. 2014 (current supplement) [23] incorporate incidence assays into the EPP framework by introducing an additional likelihood term.
Work is also underway to explore the potential of using r-trend to develop a hierarchical model for its input parameters. Empirical results suggest that some model parameters are more similar between regions (e.g. urban and rural) within a country than between similar regions in different countries. Therefore, r-trend can be used to inform appropriate model development in sparser data situations, for example, in rural areas with less surveillance data, by assuming that the starting years of HIV/AIDS epidemics or the biases between ANC data and survey data are similar for urban and rural regions of the same country.
Another substantial challenge that must be faced soon is the shift in many countries from ANC-based surveillance to the use of Prevention of Mother To Child Transmission (PMTCT) datasets. There are several potential challenges that come with these new datasets. Although ANC datasets and PMTCT datasets are both collected from ANCs, there may be substantial differences in test quality and data reporting completeness between them, especially considering that such issues continue to plague national ART data reporting, another large programmatically generated dataset. Those factors must be taken into consideration when transitioning from ANC data to PMTCT data. The PMTCT datasets may have much larger sample sizes and cover more clinics than ANC datasets, so that they may dominate the likelihood in EPP models. This may require modified algorithms to adjust for this dominance and avoid numerical underflow/overflow problems. PMTCT sites may have different geographical distributions than ANC sites. Using the same set of EPP parameters to fit the combined PMTCT and ANC datasets for the whole country might be problematic if the epidemics are heterogeneous across geographical regions.
One final major challenge arising is the issue of what level of incidence reduction to use for those on ART. Whereas the HIV Prevention Trials Network 052 study (HPTN 052) trial reported a 96% reduction in transmission [24], ART programs in the field are not as strong or as comprehensive as the care provided to people in the trial. Some programs have a hard time achieving high levels of viral suppression given problems with late initiation of ART, poor support systems, low adherence and high loss to follow-up. In these situations, it is unlikely that the full levels of incidence reduction observed in clinical trials will be achieved in real-world programs. Moreover, using current assumptions the rapid ART scale-up in many countries creates ‘bumps’ in the EPP-projected prevalence and incidence curves, which country experts find to be unrealistic. Efforts are currently underway to see if the level of incidence reduction should be fit as another parameter in EPP.
These issues, which are already under active discussion by the Reference Group, demonstrate that Spectrum and EPP will continue to adapt to meet new challenges, evolving surveillance methodologies, and availability of new sources of data. In doing so, they will continue to be valuable tools to countries in planning future needs and improving programs to deal with an ever changing HIV epidemic.
Acknowledgements
T.B. and R.P. are responsible for algorithmic development, the implementation of EPP in the Java language and its integration with Spectrum. L.B. and D.H. developed the r-trend and r-spline models, respectively, whereas D.H. developed the new calibration approach for incorporating surveys directly into the fitting. J.W.E. first recognized the issue with ART in those aged 50 years and above and the need to adapt as it changes over time. M.M. developed the original guidance on use of the different models, whereas K.M. analyzed the survey data to estimate calibration constants in nonsurvey countries. B.M. analyzed data on people who inject drugs to update the mortality estimates used in EPP. Each author contributed to the respective sections of the study, whereas T.B. organized and edited the final draft. All EPP work is conducted under the guidance of the UNAIDS Reference Group on Estimates, Modelling and Projections.
The authors wish to thank UNAIDS for ongoing support for the development of Spectrum and EPP. J.W.E. wishes to thank the Bill and Melinda Gates Foundation for funding through a grant to the HIV Modelling Consortium. We also thank Dr Matthew Lamb and Dr Batya Elul (ICAP at Columbia University, Mailman School of Public Health) for providing data about the fraction of adult ART patients over age 50 in ICAP supported clinics in Kenya, Mozambique, Rwanda, and Tanzania. The Identifying Optimal Models of HIV Care and Treatment in Sub-Saharan Africa Consortium is supported by funding from the CDC (#5U2GPS001537-03).
Conflicts of interest
There are no conflicts of interest.
References
- 1.Schwartlander B, Stanecki KA, Brown T, Way PO, Monasch R, Chin J, et al. Country-specific estimates and models of HIV and AIDS: methods and limitations. AIDS 1999; 13:2445–2458. [DOI] [PubMed] [Google Scholar]
- 2.The UNAIDS Reference Group on Estimates Modelling and Projections. Improved methods and assumptions for estimation of the HIV/AIDS epidemic and its impact: Recommendations of the UNAIDS Reference Group on Estimates, Modelling and Projections. AIDS 2002; 16:W1–W14. [DOI] [PubMed] [Google Scholar]
- 3.Bao L, Salomon JA, Brown T, Raftery AE, Hogan DR. Modelling national HIV/AIDS epidemics: revised approach in the UNAIDS Estimation and Projection Package 2011. Sex Transm Infect 2012; 88 Suppl 2:i3–i10. [DOI] [PMC free article] [PubMed] [Google Scholar]
- 4.Stover J, Brown T, Marston M. Updates to the Spectrum/Estimation and Projection Package (EPP) model to estimate HIV trends for adults and children. Sex Transm Infect 2012; 88 Suppl 2:i11–i16. [DOI] [PMC free article] [PubMed] [Google Scholar]
- 5.Brown T, Grassly NC, Garnett G, Stanecki K. Improving projections at the country level: the UNAIDS Estimation and Projection Package 2005. Sex Transm Infect 2006; 82 Suppl 3:iii34–iii40. [DOI] [PMC free article] [PubMed] [Google Scholar]
- 6.Kirby D. Changes in sexual behaviour leading to the decline in the prevalence of HIV in Uganda: confirmation from multiple sources of evidence. Sex Transm Infect 2008; 84 Suppl 2:ii35–ii41. [DOI] [PMC free article] [PubMed] [Google Scholar]
- 7.Kirungi WL, Musinguzi J, Madraa E, Mulumba N, Callejja T, Ghys P, et al. Trends in antenatal HIV prevalence in urban Uganda associated with uptake of preventive sexual behaviour. Sex Transm Infect 2006; 82 Suppl 1:i36–i41. [DOI] [PMC free article] [PubMed] [Google Scholar]
- 8.Uganda AIDS Commission. HIV and AIDS Uganda Country Progress Report, 2013. Kampala, Uganda: Uganda AIDS Commission; 2013. [Google Scholar]
- 9.Hogan DR, Zaslavsky AM, Hammitt JK, Salomon JA. Flexible epidemiological model for estimates and short-term projections in generalised HIV/AIDS epidemics. Sex Transm Infect 2010; 86 Suppl 2:ii84–ii92. [DOI] [PMC free article] [PubMed] [Google Scholar]
- 10.Hogan DR, Salomon JA. Spline-based modelling of trends in the force of HIV infection, with application to the UNAIDS Estimation and Projection Package. Sex Transm Infect 2012; 88 Suppl 2:i52–i57. [DOI] [PMC free article] [PubMed] [Google Scholar]
- 11.Lang S, Brezger A. Bayesian P-Splines. J Comput Graph Stat 2004; 13:183–212. [Google Scholar]
- 12.Raftery AE, Bao L. Estimating and projecting trends in HIV/AIDS generalized epidemics using incremental mixture importance sampling. Biometrics 2010; 66:1162–1173. [DOI] [PMC free article] [PubMed] [Google Scholar]
- 13.Bao L. A new infectious disease model for estimating and projecting HIV/AIDS epidemics. Sex Transm Infect 2012; 88 Suppl 2:i58–i64. [DOI] [PMC free article] [PubMed] [Google Scholar]
- 14.Gouws E, Mishra V, Fowler TB. Comparison of adult HIV prevalence from national population-based surveys and antenatal clinic surveillance in countries with generalised epidemics: implications for calibrating surveillance data. Sex Transm Infect 2008; 84 Suppl 1:i17–i23. [DOI] [PMC free article] [PubMed] [Google Scholar]
- 15.Marsh K, Mahy M, Saloman JA, Hogan DR. Assessing and adjusting for differences between HIV prevalence estimates derived from national population-based surveys and antenatal care surveillance, with applications for Spectrum 2013. AIDS 2014; 28 Suppl 4:S497–S505. [DOI] [PMC free article] [PubMed] [Google Scholar]
- 16.Eduardo E, Lamb MR, Kandula S, Howard A, Mugisha V, Kimanga D, et al. Characteristics and Outcomes among Older HIV-Positive Adults Enrolled in HIV Programs in Four Sub-Saharan African Countries. PloS One 2014; 9:e103864. [DOI] [PMC free article] [PubMed] [Google Scholar]
- 17.Stover J, Andreev K, Slaymaker E, Gopalappa C, Sabin K, Velasquez C, et al. Updates to the Spectrum model to estimate key HIV indicators for adults and children. AIDS 2014; 28 Suppl 4:S427–S434. [DOI] [PMC free article] [PubMed] [Google Scholar]
- 18.Darke S, Degenhardt L, Mattick RP. Mortality amongst illicit drug users. Cambridge: Cambridge University Press; 2006. [Google Scholar]
- 19.UNAIDS. Development of the software packages, EPPv2 and Spectrum, and measuring and tracking the epidemic in countries where HIV is concentrated among populations at high risk of HIV: report of a meeting of the UNAIDS reference group for estimates, modelling and projections held in Sintra, 8–10 December 2004. Geneva: UNAIDS Reference Group for Estimates, Modelling and Projections; 2005. [Google Scholar]
- 20.Degenhardt L, Hall W, Warner-Smith M. Using cohort studies to estimate mortality among injecting drug users that is not attributable to AIDS (review) (110 refs.). Sexual Transm Infect 2006; 82 Suppl 3:56–63. [DOI] [PMC free article] [PubMed] [Google Scholar]
- 21.Mathers BM, Degenhardt L, Bucello C, Lemon J, Wiessing L, Hickman M. Mortality among people who inject drugs: a systematic review and meta-analysis. Bull World Health Organ 2013; 91:102–123. [DOI] [PMC free article] [PubMed] [Google Scholar]
- 22.Mathers BM, Degenhardt L. Examining non-AIDS mortality among people who inject drugs. AIDS 2014; 28 Suppl 4:S435–S444. [DOI] [PMC free article] [PubMed] [Google Scholar]
- 23.Bao L, Ye J, Hallett TB. Incorporate incidence information within the UNAIDS Estimation and Projection Package framework: a study based on simulated incidence assay data. AIDS 2014; 28 Suppl 4:S515–S522. [DOI] [PMC free article] [PubMed] [Google Scholar]
- 24.Cohen MS, Chen YQ, McCauley M, Gamble T, Hosseinipour MC, Kumarasamy N, et al. Prevention of HIV-1 infection with early antiretroviral therapy. N Engl J Med 2011; 365:493–505. [DOI] [PMC free article] [PubMed] [Google Scholar]