

Abstract
BACKGROUND/OBJECTIVES
Youth with type 1 diabetes (T1DM) are at substantially increased risk for adverse vascular outcomes, but little is known about the influence of dietary behavior on cardiovascular disease (CVD) risk profile. We aimed to identify dietary intake patterns associated with CVD risk factors and evaluate their impact on arterial stiffness (AS) measures collected thereafter in a cohort of youth with T1DM.
SUBJECTS/METHODS
Baseline diet data from a food frequency questionnaire and CVD risk factors (triglycerides, LDL-cholesterol, systolic BP, HbA1c, C-reactive protein and waist circumference) were available for 1,153 youth aged ≥10 years with T1DM from the SEARCH for Diabetes in Youth Study. A dietary intake pattern was identified using 33 food-groups as predictors and six CVD risk factors as responses in reduced rank regression (RRR) analysis. Associations of this RRR-derived dietary pattern with AS measures [augmentation index(AIx75), n=229; pulse wave velocity(PWV), n=237; and brachial distensibility(BrachD), n=228] were then assessed using linear regression.
RESULTS
The RRR-derived pattern was characterized by high intakes of sugar-sweetened beverages (SSB) and diet soda, eggs, potatoes and high-fat meats, and low intakes of sweets/desserts and low-fat dairy; major contributors were SSB and diet soda. This pattern captured the largest variability in adverse CVD risk profile and was subsequently associated with AIx75 (β=0.47; p<0.01). The mean difference in AIx75 concentration between the highest and the lowest dietary pattern quartiles was 4.3% in fully adjusted model.
CONCLUSIONS
Intervention strategies to reduce consumption of unhealthful foods and beverages among youth with T1DM may significantly improve CVD risk profile and ultimately reduce the risk for AS.
Keywords: type 1 diabetes, arterial stiffness, CVD risk factors, dietary intake pattern, reduced rank regression
INTRODUCTION
Type 1 diabetes (T1DM) is one of the leading chronic diseases in childhood. According to the SEARCH for Diabetes in Youth Study, approximately 15,000 cases of T1DM are newly diagnosed each year in the United States1. Individuals with T1DM are at increased risk for cardiovascular disease (CVD) morbidity and mortality. High blood pressure, dyslipidemia, poor glycemic control, abdominal obesity, and markers of inflammation, have been associated with an increased risk for CVD morbidity and mortality among individuals with T1DM2-7. Longitudinal studies have shown that childhood measures of these CVD risk factors predict coronary artery disease (CAD) development during young adulthood.3,8 The largest population based study from the United States has recently documented adverse CVD risk profiles and various early-life CVD complications among youth with diabetes.6,9-11 Particularly among youth with T1DM, the atherogenic process start early in life and proceeds at a rapid rate thus leading to early CAD.2 Hence, it is critically important to identify modifiable risk factors such as dietary intake that can contribute to, and be used to ameliorate, an already adverse CVD risk profile.
Studies on dietary intake and CVD risk outcomes among youth with T1DM have suggested negative health influence of poor dietary behaviors.12 Adherence to the Dietary Approaches to Stop Hypertension (DASH) dietary pattern was inversely associated with blood pressure,12 low density lipoprotein to high density lipoprotein (LDL/HDL) cholesterol ratio,13 and haemoglobin A1c (HbA1c)13 among youth with T1DM. Similarly, percent energy from complex carbohydrates was inversely associated with HDL-C and positively associated with triglyceride (TG) concentrations among youth with T1DM.14 These studies, however, are limited due to their focus on the associations of specific nutrients or derived diet scores with health outcomes without considering the types of food consumed in the population of interest. Furthermore, reported studies considered only one risk factor at a time rather than multiple outcomes that may jointly capture future risk for CVD.
Recently, reduced rank regression (RRR) has been employed in nutritional epidemiology to identify dietary pattern/s by including multiple intermediate variables simultaneously, which have known associations with outcome(s) of interest.15-17 Given the important role of CVD risk factors in the natural history of CAD development, our primary objective was to identify dietary patterns that explained the maximum possible variation in CVD risk profile of youth with T1DM, and subsequently evaluate the associations of the identified baseline dietary pattern/s with markers of arterial stiffness (AS): augumentation index (AIx), pulse wave velocity (PWV) and brachial distensibility (Brach D) measured thereafter in a subset of cohort of youth with T1DM.
MATERIALS AND METHODS
Study procedures were reviewed and approved by the institutional review boards of the participating institutions, including compliance with the Health Insurance Portability and Accountability Act (HIPAA).
Study sample
The SEARCH for Diabetes in Youth Study is a multi-center observational study that began conducting population-based ascertainment of non-gestational cases of diabetes in youth <20 years of age in 2001 and is continuing through the present. Details of the SEARCH study design have been published.18 All eligible cases of diabetes are ascertained based on networks of pediatric and adult endocrinologists, existing pediatric diabetes databases, hospitals, databases of health plans, and other health care providers. Data were collected during the initial patient survey and in-person clinic visits.
For this study, we obtained data on 1,347 T1DM individuals aged ≥ 10 years who had diabetes duration ≥3 months, were positive for ≥ 1 diabetes autoantibody, and had baseline FFQ data. Of these individuals, 194 had missing baseline information on some CVD risk factors selected for dietary pattern analysis and were excluded. Hence, the dietary pattern analysis using RRR included a total of 1,153 individuals with T1DM. Data on AS measures was available only on the subset of the study participants from the SEARCH CVD pilot study. Hence, the final sample to explore the associations of dietary pattern/s with the AS measures included: 229 (for AIx75 measure), 237 (for PWV measure) and 228 (for BrachD measure) in the multivariate models.
Dietary intake assessment
Centrally trained interviewers assessed usual dietary intake in SEARCH participants aged 10-19 years during the baseline study visit, using a modified version of the Block Kid’s Food Frequency Questionnaire (FFQ).19 The FFQ included approximately 85 food items for which information on consumption in the past week (“yes”/“no”) was collected. For participants responding “yes”, further information on number of days consumed along with the typical portion size was collected. The nutrient and portion-size databases were modified from the respective Diabetes Prevention Program databases, using the Nutrition Data System for Research (database 3 version 4.05/33, 2002, Nutrition Coordinating Center, University of Minnesota, Minneapolis) and industry sources. Of 85 line items on the FFQ, we created a total of 33 food groups (Supplementary Table 1) on the basis of similarities in food and nutrition composition.
Socio-demographic, behavioral and clinical characteristics of cases
Self-reported variables included age at diabetes diagnosis, gender, race/ethnicity, parental education, smoking, physical activity, television viewing, insulin regimen, and insulin dose. Race/ethnicity was categorized as Non-Hispanic White, African American or others. Parental education (parent with the highest education) was categorized as less than high school or high school education or more. Smoking status was classified as current, former or never smoked. Participants were classified as physically active 0-2 days per week or physically active 3-7 days per week based on number of days they participated in activity that made them breathe hard or sweat for at least 20 minutes in a typical week. Television viewing was categorized as 0-2 hours per day or 2 or more hours per day.
A physical examination included measurement of height, weight, waist circumference (WC), and systolic and diastolic blood pressure (SBP and DBP). WC was measured using the National Health and Nutrition Examination Survey protocol.20 Weight and height information were used to calculate normalized BMI z-scores based on CDC growth chart.21
Blood drawn after an overnight fast among the participants with no episode of diabetic ketoacidosis in the past month was used to measure diabetes autoantibodies (GAD65 and IA-2), lipids [total cholesterol (TC), HDL-C, LDL-C and TG], HbA1c and C-reactive protein (CRP). The assessments were performed at the Central laboratory (Northwest Lipid Metabolism and Diabetes Research Laboratories, University of Washington, Seattle, WA) using standard lab methods which have been described previously.9,22
Measures of arterial stiffness
Measures of AS included AIx, PWV and BrachD. These were collected only in a subset of participants from two of the SEARCH clinical sites (Colorado and Ohio) as a part of the SEARCH CVD pilot study 2005/2006. Eligibility criteria for CVD pilot study included age at study visit ≥ 10 years and diabetes duration > 9 months. The CVD visit took place on average 18.9 ± 7.1 months after the baseline SEARCH diet assessment visit.
Measures of AS were performed after 5 minutes of resting and the details have been published.6,11 AIx, a composite measure of systemic AS and wave reflections, and PWV, a measure of pulse propagation representing central AS, were assessed using a SphygmoCor Vx System (AtCor Medical, Sydney, Australia). A higher AIx and PWV indicate increased AS. Since AIx is affected by heart rate, values were adjusted to a standard heart rate of 75 beats/min (AIx75).6,11 BrachD, a measure of vascular function of a peripheral muscular artery representing peripheral AS, was assessed using a DynaPulse Pathway instrument (Pulse Metric, San Diego, CA). Lower BrachD indicates increased AS.
Statistical analysis
Dietary intake pattern analysis
For the present analysis, we used RRR approach23 to derive dietary pattern/s that maximized the explained variation in a set of CVD risk factors known to be associated with CVD. The RRR model was constructed using the SAS Partial Least Squares (PLS) procedure with six response variables: TG, LDL-C, SBP, HbA1c, CRP and WC, and intake of 33 food groups as predictor variables which were adjusted for energy intake using the residual method.24
Several prospective studies have shown that higher LDL-C,7 TG,4,7 SBP,4 HbA1c level,2 central adiposity.6 and CRP5 are significant risk factors for vascular disease among individuals with T1DM. We thus chose the set of six response variables for RRR analysis in order to capture different physiological domains including lipid, blood pressure, glycemic control, central adiposity and inflammation, similar to a study of Canadian children.25
By virtue of the RRR method, we identified six dietary patterns, equal to the number of CVD risk factors included as response variables. Because the first dietary pattern explained the highest proportion of variation in the set of CVD risk factors (4.3%; as compared to 0.68%, 0.53%, 0.39%, 0.35% and 0.24% of total variation in the set of CVD risk factors by five remaining dietary patterns), we focused our analyses primarily on the effects of the first dietary pattern. Using the approach suggested in few previous studies,17,23,26 we calculated a simplified score by summing the energy-adjusted intake of the eight food groups (each standardized to have mean=0 and SD=1) with modest to high factor loadings (≥ 0.20)17 while retaining the direction of the factor loading.17,23,26 The simplified score was then used to examine the associations of dietary intake pattern with markers of AS.
Association of dietary intake pattern and arterial stiffness
We ran generalized linear regression models to assess the relationships of the simplified baseline dietary pattern score with subsequent markers of AS: AIx75, PWV and BrachD measured on average after 18.9±7.1 months from baseline diet assessment.
Potential confounders such as age at diagnosis of diabetes, duration of diabetes at CVD pilot study visit, gender, race/ethnicity, parental education, duration between baseline diet assessment and subsequent AS assessment, insulin dose and regimen, HLA risk type, smoking status, physical activity, television viewing, and study sites were evaluated sequentially in models assessing the relationship of the dietary pattern with the three markers of AS. We also tested for an interaction between simplified dietary pattern score, and duration between diet and AS assessments. Covariates that were non-significant or did not change the point estimate by ≥10% were excluded in order to derive the most parsimonious model for each outcome. Since the interaction term was non-significant, we removed this from our final model but retained the main effects in the model. Variables such as duration of diabetes, and duration between diet and AS assessments were retained in final parsimonious models despite being non-significant to improve the interpretation of the associations of outcomes with other covariates. Thus, the final model for AIx75 included covariates such as age at diagnosis of diabetes, gender, duration of diabetes, duration between diet and AS assessments, and television viewing. The final models for PWV and BrachD included: age at diagnosis of diabetes, duration of diabetes, duration between diet and AS assessments, insulin dose, and study site. All analyses were conducted in SAS (version 9.3; SAS Institute, Cary, NC).
RESULTS
Dietary intake pattern analysis
The first RRR-derived dietary pattern explained 5.4% of TG, 1.6% of LDL-C, 3.0% of SBP, 3.4% of HbA1c, 4.2% of CRP, 8.3% of WC variation, and 4.3% of the total variation of all six metabolic markers.
Table 1 illustrates the characteristics of the eight food groups which were the major contributors (factor loadings ≥ 0.20) to the first RRR-derived dietary pattern. Intake of eggs, sweetened coffee and tea, sweetened soda/fruit-flavored drinks, diet soda, potatoes, and high-fat meats were positively associated with the overall score shown by positive score parameters and positive correlations; whereas, intake of sweets/desserts, and low-fat dairy were inversely associated with the score with negative score parameters and negative correlations. Diet soda, and sweetened soda/fruit-flavored drink explained the largest variation in the pattern score. In total, the eight food groups explained 79.0% of the dietary pattern score variation. Details about the food items included in eight food groups and factor loadings of 33 food groups for the first dietary pattern can be found in Supplementary Table 1.
Table 1.
Food groups strongly associated with the first dietary pattern identified by reduced rank regression among youth with type 1 diabetes participating in the SEARCH for Diabetes in Youth Study (n=1,153)
| Food groupsa | Factor loadingb | Standard score parameterc | Pearson’s correlationd | Explained variation in scoree |
|---|---|---|---|---|
| Diet soda | 0.51 | 0.58 | 0.62 | 36.30 |
| Sweetened soda and fruit-flavored drink | 0.40 | 0.30 | 0.48 | 14.26 |
| Sweets and desserts | -0.29 | -0.29 | -0.36 | 10.48 |
| Low-fat dairy | -0.29 | -0.18 | -0.35 | 6.33 |
| Sweetened coffee and tea | 0.23 | 0.15 | 0.27 | 4.17 |
| Eggs | 0.20 | 0.15 | 0.24 | 3.65 |
| Potatoes | 0.21 | 0.10 | 0.25 | 2.65 |
| High-fat meat (other than processed) | 0.24 | 0.04 | 0.30 | 1.18 |
Abbreviation: RRR, reduced rank regression.
We included a total of 33 food groups adjusted for total energy intake in our analysis. Only eight food groups which loaded highly (factor loadings ≥ 0.20) and strongly contributed to the first RRR-derived dietary pattern are presented here (The factor loadings for all food groups are presented in Supplementary Table 1).
Factor loadings are directly obtained from RRR analysis.
Standard score parameters are obtained from multiple linear regression of food groups on original dietary pattern score.
Pearson’s correlation coefficient obtained from correlating individual food groups with the dietary pattern score.
Explained variation is calculated by multiplying standardized parameters with the Pearson’s correlation coefficient ×100.
In our study population, the mean of the simplified diet pattern score was 0 (due to the standardization of the food groups) and the SD was 3.63 (min= -12.38 and max= 24.90). Table 2 shows that the mean intake of the eight most important contributing food groups varied significantly across the quartiles of the simplified diet pattern score (P<0.0001). Intakes of diet soda, sweetened soda/fruit-flavored drink, sweetened coffee and tea, eggs, potatoes and high-fat meats increased with increasing diet pattern score. Whereas, intakes of sweets/desserts and low-fat dairy decreased with increasing diet pattern score. For instance, individuals in the highest quartile of the simplified score consumed 1.25 more servings of diet soda and 1.61 fewer servings of low-fat dairy when compared to individuals in the lowest quartile. Similarly concentrations of all six CVD risk factors (TG, LDL-C, SBP, HbA1c, CRP and WC) were largest at the highest quartiles of the simplified dietary pattern score (P<0.01; Table 2).
Table 2.
Food intake and metabolic markers concentrations according to quartiles of the simplified dietary pattern score among youth with type 1 diabetes participating in the SEARCH for Diabetes in Youth Study (n=1,153)
| Food group and metabolic markers | Quartiles of simplified dietary pattern score
|
||||
|---|---|---|---|---|---|
| 1 | 2 | 3 | 4 | p-trend | |
| Food group (servings/day) | |||||
| Diet soda | 0.76±0.81 | 0.97±0.91 | 1.44±1.13 | 2.01±1.31 | <0.0001 |
| Sweetened soda and fruit-flavored drink | 0.30±0.59 | 0.31±0.51 | 0.44±0.72 | 1.02±1.44 | <0.0001 |
| Sweets and desserts | 2.23±1.54 | 1.34±0.88 | 1.09±0.83 | 1.05±0.90 | <0.0001 |
| Dairy (low fat) | 2.36±0.97 | 1.51±0.93 | 1.05±0.83 | 0.75±0.74 | <0.0001 |
| Sweetened coffee and tea | 0.01±0.05 | 0.02±0.09 | 0.04±0.13 | 0.20±0.51 | <0.0001 |
| Eggs | 0.21±0.22 | 0.25±0.27 | 0.31±0.30 | 0.52±0.45 | <0.0001 |
| Potato | 0.32±0.32 | 0.37±0.36 | 0.43±0.38 | 0.72±0.58 | <0.0001 |
| Meat (high fat other) | 0.49±0.44 | 0.52±0.48 | 0.66±0.60 | 1.02±0.86 | <0.0001 |
| Metabolic markers | |||||
| Triglycerides (mg/dl) | 69.2±43.7 | 72.5±38.2 | 88.1±74.1 | 92.8±107.0 | <0.0001 |
| LDL (mg/dl) | 92.6±22.6 | 99.1±26.4 | 102.2±31.8 | 100.9±28.5 | 0.0001 |
| SBP (mmHg) | 104.3± 10.0 | 105.1±9.9 | 105.5±10.4 | 107.9±10.7 | <0.0001 |
| HbA1c (%) | 7.9±1.3 | 7.9±1.4 | 8.3±1.9 | 8.4±1.9 | <0.0001 |
| CRP (mg/dl) | 0.1±0.3 | 0.1±0.2 | 0.2±0.5 | 0.2±0.3 | 0.0025 |
| Waist circumference (cm) | 75.0±10.8 | 77.8±11.8 | 80.4±10.8 | 83.0±13.6 | <0.0001 |
Abbreviations: CRP, C-Reactive protein; HbA1c, Hemoglobin A1c; LDL, low-density lipoprotein cholesterol; SBP, systolic blood pressure. Values presented in the table are mean ± SD.
Participants who were older when diagnosed with diabetes, were Non-Hispanic black or other race, were current or former smokers, had diabetes for longer durations, had higher BMI z-score, watched TV for 2 or more hours per day, and required higher doses of insulin were more likely to be in the highest compared to the lowest quartile of the simplified dietary pattern score (all p-value <0.05; Table 3). No significant differences were observed for physical activity and insulin regimen by dietary intake quartiles (Table 3).
Table 3.
Baseline characteristics of type 1 diabetes participants according to quartiles of the simplified dietary pattern score (n=1,153)
| Characteristics | Quartiles of simplified dietary pattern score
|
||||
|---|---|---|---|---|---|
| 1 | 2 | 3 | 4 | p-trend | |
| Age at diagnosis (years) | 9.5±3.5 | 10.1±3.5 | 10.6±3.4 | 10.7±3.6 | <0.0001 |
| Diabetes duration (months) | 40.4±36.8 | 43.6±41.7 | 47.3±44.6 | 54.9±47.6 | <0.0001 |
| BMI z-score | 0.5±0.9 | 0.6±0.9 | 0.7±0.8 | 0.7±1.0 | 0.0010 |
| Insulin dose | 44.3±25.4 | 46.9±25.1 | 50.1±27.7 | 55.8±31.5 | <0.0001 |
| Gender | |||||
| Male | 54.5 | 44.8 | 46.7 | 54.9 | |
| Female | 45.5 | 55.2 | 53.3 | 45.1 | 0.024 |
| Race/ethnicity | |||||
| Non-Hispanic white | 88.5 | 83.3 | 77.8 | 71.9 | |
| Non-Hispanic black | 1.4 | 6.6 | 8.0 | 14.2 | |
| Other | 10.1 | 10.1 | 14.2 | 13.9 | <0.0001 |
| Smoking | |||||
| Never | 89.2 | 84.6 | 74.8 | 67.7 | |
| Former | 8.0 | 10.8 | 18.2 | 15.8 | |
| Current | 2.8 | 4.6 | 7.0 | 16.5 | <0.0001 |
| Physical activity | |||||
| 0-2 days | 37.1 | 36.7 | 37.3 | 40.2 | |
| 3-7 days | 62.8 | 63.3 | 62.7 | 59.8 | 0.817 |
| Television viewing | |||||
| 0-2 hrs per day | 53.8 | 54.9 | 42.9 | 33.9 | |
| 2 hrs or more per day | 46.2 | 45.1 | 57.1 | 66.1 | <0.0001 |
| Insulin Regimen | |||||
| Pump | 20.1 | 23.0 | 21.8 | 21.9 | |
| Long + short/rapid, ≥ 3 injections/day | 28.8 | 31.2 | 24.2 | 27.8 | |
| Other | 50.7 | 45.4 | 52.6 | 49.3 | 0.321 |
Abbreviation: BMI, body mass index. Values presented in table are mean ± SD or %.
Association of dietary intake pattern and arterial stiffness
The average values of AIx75, PWV and BrachD in our study population were 1.20±9.57, 5.39±0.84 and 5.96±1.23, respectively (data not shown).
Pearson correlation analysis showed significant positive associations of the simplified dietary pattern score with AIx75 and PWV, and significant negative associations with BrachD (all p-value <0.05, data not shown).
Unadjusted simplified dietary pattern score was significantly associated with all three measures of AS (Table 4). For every 1-unit increase in dietary score, the AIx75 increased by 0.42% and the PWV increased by 0.05 m/sec, while the BrachD decreased by 0.05% per mm Hg. However, after adjustment for confounding variables in the final models, the dietary pattern score only remained significantly positively associated with AIx75 (a mixed measure representing systemic AS and wave reflection; Table 4). Associations of the dietary pattern with the other two measures of AS, PWV (representing central AS) and BrachD (representing peripheral stiffness), were attenuated and became non-significant after adjustment for confounders.
Table 4.
Associations of simplified dietary pattern score with arterial stiffness measures among youth with type 1 diabetes participating in SEARCH CVD Pilot Study
| Models | AIx-75a (higher=stiffer) n=229 | PWVb (higher=stiffer) n=237 | BrachDc (lower=stiffer) n=228 |
|---|---|---|---|
|
| |||
| Beta (SE) | Beta (SE) | Beta (SE) | |
| Unadjusted model | 0.42 (0.17)f | 0.05 (0.01)e | -0.05 (0.02)f |
| Adjusted modeld | 0.47 (0.18)e | 0.01 (0.01) | -0.001 (0.02) |
Abbreviations: AIx, augmentation index; BrachD, brachial distensibility; CVD, cardiovascular disease; PWV, pulse wave velocity; SE, standard error.
Normalized to heart rate of 75 beats/minute (%).
Carotid-femoral (m/sec).
Percent change per mm Hg.
For AIX:Model with age at diagnosis of diabetes, gender, duration of diabetes, duration between assessment of diet (SEARCH initial visit) and arterial stiffness (CVD pilot study visit), and television viewing. For PWV and BrachD: Model with age at diagnosis of diabetes, duration of diabetes, duration between assessment of diet (SEARCH initial visit) and arterial stiffness (CVD pilot study visit), insulin dose, and study site.
p<0.01,
p<0.05.
Figure 1 shows the mean levels of AIx75 by quartiles of the simplified dietary pattern score. When compared to the lowest quartile of the simplified dietary pattern score, individuals in the highest quartiles had higher concentration of AIx75 both in unadjusted (Figure 1 A) and adjusted (Figure 1 B) models. Once adjusted for potential confounders, the mean difference in AIx75 between the highest and lowest quartiles was 4.30%.
Figure 1.
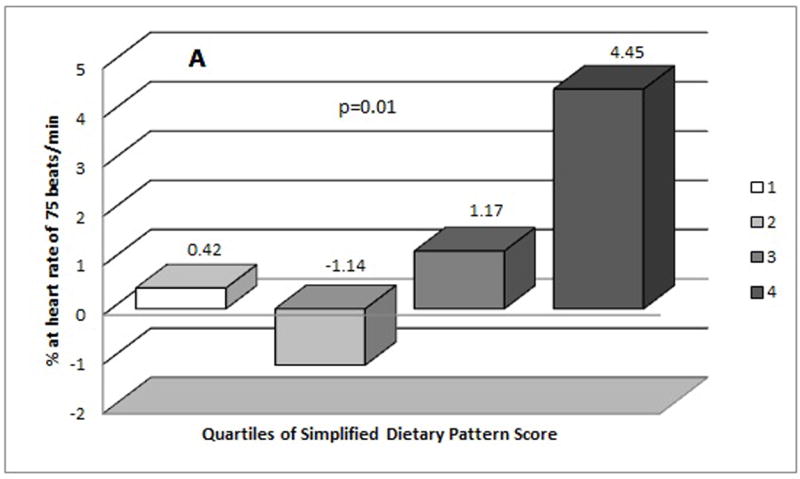
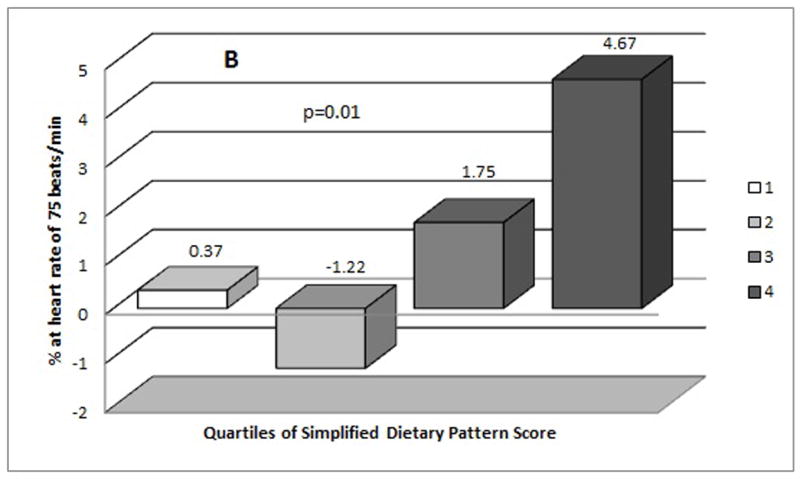
Mean distribution of Augumentation Index (AIx75 %) by quartiles of simplified dietary pattern score (A) mean values from unadjusted model (B) mean values from adjusted model (adjusted for age at diagnosis of diabetes, gender, duration of diabetes, duration between assessment of diet and arterial stiffness, and television viewing).
DISCUSSION
We found that a specific dietary pattern representing a combination of foods and beverages was associated with increased AS among youth with T1DM. Recent findings from the SEARCH study have also suggested that factors such as HbA1c, WC, cholesterol and blood pressure are among the major risk factors for AS among youth with T1DM.6,11 Our study thus expands and strengthens our knowledge of the relationship between diet and vascular dysfunction by identifying a major dietary pattern that captured the maximum possible variability in the set of CVD risk factors in our study population and was ultimately associated with AS.
The pattern we identified was somewhat different than patterns reported in previous studies exploring the associations between dietary intake and cardiometabolic risk factors or sub-clinical CVD outcomes.15,16,27,28 This difference can be attributed to the different diet analysis methods,27-29 or different biomarkers used to derive these dietary patterns.15,16 Given the actual reported dietary intake in the study population, our goal was to find the dietary pattern that captured the greatest possible variation in the set of CVD risk factors in this study population. This pattern could then potentially provide insight regarding variation in diet that is important for the development of sub-clinical vascular disease among youth with T1DM. We were not interested in deriving dietary pattern that represented just the combination of foods and drinks that were commonly eaten together by T1DM youth, and may not necessarily predict sub-clinical CVD outcomes. To our knowledge, our study is the first one to focus on children and youth population with diabetes, hence different dietary patterns can be expected as compared to previous studies conducted in adult populations.
Confirming the health-relevance of this dietary pattern, we found a significant positive association of the baseline dietary pattern with the AIx outcome measured afterwards, even after adjustment for the confounders. SSBs and diet soda together contributed to about half of the variability of the dietary pattern. The positive relationship of SSBs with obesity, type 2 diabetes and cardiometabolic dysfunction is well known.30,31 Recently, several studies have also suggested adverse metabolic effects of diet soda.29,30,32 Furthermore, positive associations of SSBs and diet beverages with CVD risk factors have been reported among T1DM youth participating in the SEARCH study;33 thus the negative impact on AS we observed is plausible.
Intake of eggs, high-fat meats, and potatoes was also positively associated with the dietary pattern identified in this analysis. The scientific evidence linking eggs to CVD risk is equivocal. A strong positive association between egg consumption and CVD morbidity and mortality was observed among individuals with diabetes34, potentially due to the adverse effect of egg consumption on lipoprotein profile and glycemic control35. However, only a modest or no association was observed for CVD morbidity and mortality among individuals without diabetes34. In three prospective cohort studies in the US, red meat consumption was associated with weight gain and risk for type 2 diabetes (T2DM) over time36. A positive association of red meat consumption and cardio-metabolic risk factors has also been reported among individuals with diabetes37. Potato contains rapidly absorbable starch and may increase the risk for insulin resistance and T2DM38.
Consistent with our finding regarding the beneficial effect of low-fat dairy products, several studies have shown an inverse relationship between dairy products and blood-pressure/hypertension39,40. Further evaluation of the relationship between dairy products and holistic markers of CVD including AS has been recommended39. The adverse effect of added sugar on lipoproteins and CVD is well established41. However, participants scoring high on the RRR-derived dietary pattern had lower intakes of sweets and desserts. When considered in the context of this sample population, this result may suggest that youth with T1DM are balancing their sugar intake from SSBs by reducing intake of sweets and desserts.
AIx measured using pulse wave analysis (PWA) techniques in our study provides a composite measure of systemic AS and wave reflections.42,43 Furthermore, decline in endothelial function has been suggested to lead to enhanced wave reflections and rise in AIx.42. Hence, one possible mechanism for the observed positive associations of the dietary pattern with AIx can be through endothelial dysfunction. The mean differences in AIx75 concentration between the highest and the lowest dietary pattern quartiles from our fully adjusted model was 4.3% and are likely to be clinically significant. In a recent meta-analysis, it was estimated that, for every 10% increase in central AIx, there were age- and risk-factor-adjusted increases of total CVD events by 31.8% and all-cause mortality by 38.4%.44
Our study like others has several limitations. One major limitation of our study is the use of dietary data from a self-reported instrument, the FFQ, hence the possibility for measurement error. Another limitation was small sample size to explore the associations of RRR-derived dietary pattern with AS measures. This may have provided us less power to assess the influence of the dietary pattern on the markers of AS particularly PWV and BrachD, which had less variability in the data. Comparison of PWV and BrachD between T1DM and non-diabetic control youth in our study population have shown significant differences, however, the magnitude of the differences were small.45 It is possible that these measures were unaffected by diet early in the course of T1DM. Data collection on AS measures is currently ongoing as part of the SEARCH Cohort Study and will be available in approximately 3,000 T1DM youth. Hence, we will be able to explore the associations of dietary pattern with AS measures using a larger sample size followed for longer period of time in the future. Finally, it is possible that other pathways are involved in diet-AS association that were not captured by the metabolic markers included in our study, and this may help explain the low biomarker variability captured by the first RRR-derived dietary pattern in this analysis.
This study has a number of strengths. To our knowledge, this is the first study to use RRR, a novel and powerful method, to derive a specific dietary pattern associated with various markers of AS among youth with T1DM. Given the high prevalence of adverse CVD risk profile and various early-life CVD complications in this population, the finding is extremely useful for the development of dietary recommendations. The dietary pattern identified in our study is robust since we were able to draw upon dietary intake data for larger samples of youth with T1DM. Furthermore, given the RRR-derived dietary patterns were highly driven by underlying CVD risk factors, the dietary pattern identified and found to be significantly associated with AS in this study can provide directions for future dietary interventions that can substantially reverse the adverse CVD risk profile and further interrupt the pathogenesis of vascular complications in this population.
In conclusion, we identified that a specific dietary pattern characterized by high intakes of SSBs and diet soda, and also including high intakes of eggs, potatoes and high-fat meats, and low intakes of sweets/deserts and low-fat dairy, captured the largest possible variability in adverse CVD risk profile among a sample of youth with T1DM and was subsequently associated with higher AIx. Future studies with larger T1DM samples are needed to explore the associations of the derived dietary pattern with other measures of AS (PWV and BrachD), which can provide further insights into possible pathways linking diet to AS in this high risk population. Nonetheless, the results from our study provide support for potential dietary intervention strategies to reduce consumption of unhealthful foods and beverages among youth with T1DM that may significantly improve CVD risk profile and ultimately reduce the risk for AS and prevent premature vascular events.
Supplementary Material
Acknowledgments
The SEARCH Nutrition Ancillary Study and the SEARCH for Diabetes in Youth Study are indebted to the many youth and their families, and their health care providers, whose participation made this study possible.
Sources of funding
The SEARCH Nutrition Ancillary Study (R01 DK 077949, PI Mayer-Davis) is funded by the NIDDK. SEARCH for Diabetes in Youth is funded by the Centers for Disease Control and Prevention (PA numbers 00097, DP-05-069, and DP-10-001) and supported by the National Institute of Diabetes and Digestive and Kidney Diseases (NIDDK). The SEARCH AIR Ancillary study (R01 ES 019168, PI Puett) is funded by the National Institute of Environmental Health Sciences. The SEARCH CVD study (R01DK078542, PI Dabelea) is funded by NIDDK.
Footnotes
CONFLICT OF INTEREST
The authors declare no conflict of interest.
Supplementary information is available at the European Journal of Clinical Nutrition’s website.
References
- 1.Dabelea D, Bell RA, D’Agostino RB, Jr, Imperatore G, Johansen JM, Linder B, et al. Incidence of diabetes in youth in the United States. JAMA. 2007;297:2716–2724. doi: 10.1001/jama.297.24.2716. [DOI] [PubMed] [Google Scholar]
- 2.Snell-Bergeon JK, Hokanson JE, Jensen L, MacKenzie T, Kinney G, Dabelea D, et al. Progression of coronary artery calcification in type 1 diabetes: the importance of glycemic control. Diabetes Care. 2003;26:2923–2928. doi: 10.2337/diacare.26.10.2923. [DOI] [PubMed] [Google Scholar]
- 3.Orchard TJ, Olson JC, Erbey JR, Williams K, Forrest KY, Smithline KL, et al. Insulin resistance-related factors, but not glycemia, predict coronary artery disease in type 1 diabetes: 10-year follow-up data from the Pittsburgh Epidemiology of Diabetes Complications Study. Diabetes Care. 2003;26:1374–1379. doi: 10.2337/diacare.26.5.1374. [DOI] [PubMed] [Google Scholar]
- 4.Soedamah-Muthu SS, Chaturvedi N, Toeller M, Ferriss B, Reboldi P, Michel G, et al. Risk factors for coronary heart disease in type 1 diabetic patients in Europe: the EURODIAB Prospective Complications Study. Diabetes Care. 2004;27:530–537. doi: 10.2337/diacare.27.2.530. [DOI] [PubMed] [Google Scholar]
- 5.Xu Y, Whitmer K. C-reactive protein and cardiovascular disease in people with diabetes: high-sensitivity CRP testing can help assess risk for future cardiovascular disease events in this population. Am J Nurs. 2006;106:66–72. doi: 10.1097/00000446-200608000-00027. [DOI] [PubMed] [Google Scholar]
- 6.Wadwa RP, Urbina EM, Anderson AM, Hamman RF, Dolan LM, Rodriguez BL, et al. Measures of arterial stiffness in youth with type 1 and type 2 diabetes: the SEARCH for diabetes in youth study. Diabetes Care. 2010;33:881–886. doi: 10.2337/dc09-0747. [DOI] [PMC free article] [PubMed] [Google Scholar]
- 7.Grauslund J, Jorgensen TM, Nybo M, Green A, Rasmussen LM, Sjolie AK. Risk factors for mortality and ischemic heart disease in patients with long-term type 1 diabetes. J Diabetes Complications. 2010;24:223–228. doi: 10.1016/j.jdiacomp.2009.05.003. [DOI] [PubMed] [Google Scholar]
- 8.Raitakari OT, Juonala M, Kahonen M, Taittonen L, Laitinen T, Maki-Torkko N, et al. Cardiovascular risk factors in childhood and carotid artery intima-media thickness in adulthood: the Cardiovascular Risk in Young Finns Study. JAMA. 2003;290:2277–2283. doi: 10.1001/jama.290.17.2277. [DOI] [PubMed] [Google Scholar]
- 9.Kershnar AK, Daniels SR, Imperatore G, Palla SL, Petitti DB, Pettitt DJ, et al. Lipid abnormalities are prevalent in youth with type 1 and type 2 diabetes: the SEARCH for Diabetes in Youth Study. J Pediatr. 2006;149:314–319. doi: 10.1016/j.jpeds.2006.04.065. [DOI] [PubMed] [Google Scholar]
- 10.Petitti DB, Klingensmith GJ, Bell RA, Andrews JS, Dabelea D, Imperatore G, et al. Glycemic control in youth with diabetes: the SEARCH for diabetes in Youth Study. J Pediatr. 2009;155:668–672. doi: 10.1016/j.jpeds.2009.05.025. [DOI] [PMC free article] [PubMed] [Google Scholar]
- 11.Urbina EM, Wadwa RP, Davis C, Snively BM, Dolan LM, Daniels SR, et al. Prevalence of increased arterial stiffness in children with type 1 diabetes mellitus differs by measurement site and sex: the SEARCH for Diabetes in Youth Study. J Pediatr. 2010;156:731–7. 737. doi: 10.1016/j.jpeds.2009.11.011. [DOI] [PubMed] [Google Scholar]
- 12.Gunther AL, Liese AD, Bell RA, Dabelea D, Lawrence JM, Rodriguez BL, et al. Association between the dietary approaches to hypertension diet and hypertension in youth with diabetes mellitus. Hypertension. 2009;53:6–12. doi: 10.1161/HYPERTENSIONAHA.108.116665. [DOI] [PMC free article] [PubMed] [Google Scholar]
- 13.Liese AD, Bortsov A, Gunther AL, Dabelea D, Reynolds K, Standiford DA, et al. Association of DASH diet with cardiovascular risk factors in youth with diabetes mellitus: the SEARCH for Diabetes in Youth study. Circulation. 2011;123:1410–1417. doi: 10.1161/CIRCULATIONAHA.110.955922. [DOI] [PMC free article] [PubMed] [Google Scholar]
- 14.Wiltshire EJ, Hirte C, Couper JJ. Dietary fats do not contribute to hyperlipidemia in children and adolescents with type 1 diabetes. Diabetes Care. 2003;26:1356–1361. doi: 10.2337/diacare.26.5.1356. [DOI] [PubMed] [Google Scholar]
- 15.Hoffmann K, Zyriax BC, Boeing H, Windler E. A dietary pattern derived to explain biomarker variation is strongly associated with the risk of coronary artery disease. Am J Clin Nutr. 2004;80:633–640. doi: 10.1093/ajcn/80.3.633. [DOI] [PubMed] [Google Scholar]
- 16.Nettleton JA, Steffen LM, Schulze MB, Jenny NS, Barr RG, Bertoni AG, et al. Associations between markers of subclinical atherosclerosis and dietary patterns derived by principal components analysis and reduced rank regression in the Multi-Ethnic Study of Atherosclerosis (MESA) Am J Clin Nutr. 2007;85:1615–1625. doi: 10.1093/ajcn/85.6.1615. [DOI] [PMC free article] [PubMed] [Google Scholar]
- 17.Liese AD, Weis KE, Schulz M, Tooze JA. Food intake patterns associated with incident type 2 diabetes: the Insulin Resistance Atherosclerosis Study. Diabetes Care. 2009;32:263–268. doi: 10.2337/dc08-1325. [DOI] [PMC free article] [PubMed] [Google Scholar]
- 18.SEARCH Study Group. SEARCH for Diabetes in Youth: a multicenter study of the prevalence, incidence and classification of diabetes mellitus in youth. Control Clin Trials. 2004;25:458–471. doi: 10.1016/j.cct.2004.08.002. [DOI] [PubMed] [Google Scholar]
- 19.Mayer-Davis EJ, Nichols M, Liese AD, Bell RA, Dabelea DM, Johansen JM, et al. Dietary intake among youth with diabetes: the SEARCH for Diabetes in Youth Study. J Am Diet Assoc. 2006;106:689–697. doi: 10.1016/j.jada.2006.02.002. [DOI] [PubMed] [Google Scholar]
- 20.Centers for Disease Control and Prevention. The Third National Health and Nutrition Examination Survey (NHANES III 1988–94) Reference Manuals and Reports. Bethesda, MD: National Center for Health Statistics; 2005. [Google Scholar]
- 21.Kuczmarski RJ, Ogden CL, Guo SS, Grummer-Strawn LM, Flegal KM, Mei Z, et al. 2000 CDC Growth Charts for the United States: methods and development. Vital Health Stat. 2002;11:1–190. [PubMed] [Google Scholar]
- 22.Mayer-Davis EJ, Ma B, Lawson A, D’Agostino RB, Jr, Liese AD, Bell RA, et al. Cardiovascular disease risk factors in youth with type 1 and type 2 diabetes: implications of a factor analysis of clustering. Metab Syndr Relat Disord. 2009;7:89–95. doi: 10.1089/met.2008.0046. [DOI] [PMC free article] [PubMed] [Google Scholar]
- 23.Hoffmann K, Schulze MB, Schienkiewitz A, Nothlings U, Boeing H. Application of a new statistical method to derive dietary patterns in nutritional epidemiology. Am J Epidemiol. 2004;159:935–944. doi: 10.1093/aje/kwh134. [DOI] [PubMed] [Google Scholar]
- 24.Willett W, Stampfer MJ. Total energy intake: implications for epidemiologic analyses. Am J Epidemiol. 1986;124:17–27. doi: 10.1093/oxfordjournals.aje.a114366. [DOI] [PubMed] [Google Scholar]
- 25.Retnakaran R, Zinman B, Connelly PW, Harris SB, Hanley AJ. Nontraditional cardiovascular risk factors in pediatric metabolic syndrome. J Pediatr. 2006;148:176–182. doi: 10.1016/j.jpeds.2005.08.025. [DOI] [PubMed] [Google Scholar]
- 26.Schulze MB, Hoffmann K, Kroke A, Boeing H. An approach to construct simplified measures of dietary patterns from exploratory factor analysis. Br J Nutr. 2003;89:409–419. doi: 10.1079/BJN2002778. [DOI] [PubMed] [Google Scholar]
- 27.Kesse-Guyot E, Vergnaud AC, Fezeu L, Zureik M, Blacher J, Peneau S, et al. Associations between dietary patterns and arterial stiffness, carotid artery intima-media thickness and atherosclerosis. Eur J Cardiovasc Prev Rehabil. 2010;17:718–724. doi: 10.1097/HJR.0b013e32833a197f. [DOI] [PubMed] [Google Scholar]
- 28.van de Laar RJ, Stehouwer CD, van Bussel BC, Prins MH, Twisk JW, Ferreira I. Adherence to a Mediterranean dietary pattern in early life is associated with lower arterial stiffness in adulthood: the Amsterdam Growth and Health Longitudinal Study. J Intern Med. 2013;273:79–93. doi: 10.1111/j.1365-2796.2012.02577.x. [DOI] [PubMed] [Google Scholar]
- 29.Lutsey PL, Steffen LM, Stevens J. Dietary intake and the development of the metabolic syndrome: the Atherosclerosis Risk in Communities study. Circulation. 2008;117:754–761. doi: 10.1161/CIRCULATIONAHA.107.716159. [DOI] [PubMed] [Google Scholar]
- 30.Giammattei J, Blix G, Marshak HH, Wollitzer AO, Pettitt DJ. Television watching and soft drink consumption: associations with obesity in 11- to 13-year-old schoolchildren. Arch Pediatr Adolesc Med. 2003;157:882–886. doi: 10.1001/archpedi.157.9.882. [DOI] [PubMed] [Google Scholar]
- 31.Malik VS, Popkin BM, Bray GA, Despres JP, Willett WC, Hu FB. Sugar-sweetened beverages and risk of metabolic syndrome and type 2 diabetes: a meta-analysis. Diabetes Care. 2010;33:2477–2483. doi: 10.2337/dc10-1079. [DOI] [PMC free article] [PubMed] [Google Scholar]
- 32.Nettleton JA, Lutsey PL, Wang Y, Lima JA, Michos ED, Jacobs DR., Jr Diet soda intake and risk of incident metabolic syndrome and type 2 diabetes in the Multi-Ethnic Study of Atherosclerosis (MESA) Diabetes Care. 2009;32:688–694. doi: 10.2337/dc08-1799. [DOI] [PMC free article] [PubMed] [Google Scholar]
- 33.Bortsov AV, Liese AD, Bell RA, Dabelea D, D’Agostino RB, Jr, Hamman RF, et al. Sugar-sweetened and diet beverage consumption is associated with cardiovascular risk factor profile in youth with type 1 diabetes. Acta Diabetol. 2011;48:275–282. doi: 10.1007/s00592-010-0246-9. [DOI] [PMC free article] [PubMed] [Google Scholar]
- 34.Djousse L, Gaziano JM. Egg consumption in relation to cardiovascular disease and mortality: the Physicians’ Health Study. Am J Clin Nutr. 2008;87:964–969. doi: 10.1093/ajcn/87.4.964. [DOI] [PMC free article] [PubMed] [Google Scholar]
- 35.Rong Y, Chen L, Zhu T, Song Y, Yu M, Shan Z, et al. Egg consumption and risk of coronary heart disease and stroke: dose-response meta-analysis of prospective cohort studies. BMJ. 2013;346:e8539. doi: 10.1136/bmj.e8539. [DOI] [PMC free article] [PubMed] [Google Scholar]
- 36.Pan A, Sun Q, Bernstein AM, Manson JE, Willett WC, Hu FB. Changes in red meat consumption and subsequent risk of type 2 diabetes mellitus: three cohorts of US men and women. JAMA Intern Med. 2013;173:1328–1335. doi: 10.1001/jamainternmed.2013.6633. [DOI] [PMC free article] [PubMed] [Google Scholar]
- 37.Kumar S, Dutt A, D’Souza N, Bhat S, Hemraj S. A study of meat consumption on cardiometabolic risk factors in pre-menopausal type-2 diabetes patients. National Journal of Physioplogy, Pharmacy and Pharmacology. 2011;1:57–62. [Google Scholar]
- 38.Halton TL, Willett WC, Liu S, Manson JE, Stampfer MJ, Hu FB. Potato and french fry consumption and risk of type 2 diabetes in women. Am J Clin Nutr. 2006;83:284–290. doi: 10.1093/ajcn/83.2.284. [DOI] [PubMed] [Google Scholar]
- 39.Givens DI. Milk in the diet: good or bad for vascular disease? Proc Nutr Soc. 2012;71:98–104. doi: 10.1017/S0029665111003223. [DOI] [PubMed] [Google Scholar]
- 40.Kris-Etherton PM, Grieger JA, Hilpert KF, West SG. Milk products, dietary patterns and blood pressure management. J Am Coll Nutr. 2009;28(Suppl 1):103S–119S. doi: 10.1080/07315724.2009.10719804. [DOI] [PubMed] [Google Scholar]
- 41.Howard BV, Wylie-Rosett J. Sugar and cardiovascular disease: A statement for healthcare professional from the committee on nutrition of the council on nutrition, physical activity, and metabolism of the american heart association. Circulation. 2002;106:523–527. doi: 10.1161/01.cir.0000019552.77778.04. [DOI] [PubMed] [Google Scholar]
- 42.McEniery CM, Wallace S, Mackenzie IS, McDonnell B, Yasmin, Newby DE, et al. Endothelial function is associated with pulse pressure, pulse wave velocity, and augmentation index in healthy humans. Hypertension. 2006;48:602–608. doi: 10.1161/01.HYP.0000239206.64270.5f. [DOI] [PubMed] [Google Scholar]
- 43.Laurent S, Cockcroft J, Van BL, Boutouyrie P, Giannattasio C, Hayoz D, et al. Expert consensus document on arterial stiffness: methodological issues and clinical applications. Eur Heart J. 2006;27:2588–2605. doi: 10.1093/eurheartj/ehl254. [DOI] [PubMed] [Google Scholar]
- 44.Vlachopoulos C, Aznaouridis K, Stefanadis C. Prediction of cardiovascular events and all-cause mortality with arterial stiffness: a systematic review and meta-analysis. J Am Coll Cardiol. 2010;55:1318–1327. doi: 10.1016/j.jacc.2009.10.061. [DOI] [PubMed] [Google Scholar]
- 45.Wadwa RP, Urbina EM, Talton J, D’Agostino R, Jaiswal M, Shah AS, et al. Arterial Stiffness in Youth and Young Adults with and without Type 1 Diabetes: The SEARCH CVD Study. Presented at American Diabetes Association 71st Scientific Sessions; San Diego, CA. June 27, 2011; abstract 506-P. [Google Scholar]
Associated Data
This section collects any data citations, data availability statements, or supplementary materials included in this article.