Abstract
Hypertrophic olivary degeneration is a trans-synaptic neuronal degeneration associated with hypertrophy of the inferior olivary nucleus due to a lesion in the triangle of Guillain-Mollaret. Familiarity with this entity on magnetic resonance imaging (MRI) is essential to avoid other erroneous ominous diagnoses. We present a case of bilateral hypertrophic olivary degeneration and discuss the etiopathogenesis and MRI findings in this entity. The contributory role of MR tractography in the diagnosis is also highlighted.
Keywords: Hypertrophic olivary degeneration, magnetic resonance imaging, tractography
Introduction
Hypertrophic olivary degeneration (HOD) is a rare trans-synaptic neuronal degeneration associated with hypertrophy of the inferior olivary nucleus due to a lesion in the dentato-rubro-olivary pathway (triangle of Guillain-Mollaret). It is an unusual entity as degeneration is accompanied by hypertrophy instead of the more commonly encountered atrophy.[1,2] It is often associated with symptomatic palatal myoclonus and presents a potentially confusing appearance on magnetic resonance imaging (MRI). Awareness of this entity on MRI is essential to avoid other erroneous ominous diagnoses.
Case Report
A 60-year-old lady, a known patient of diabetes mellitus and primary hypertension for the last 15 years, was brought with history of loose motions over last 3 days followed by altered sensorium over last 24 h. Her general physical examination revealed a pulse of 100/min which was regular but low in volume, blood pressure of 100/76 mm of Hg, and respiratory rate of 18/min, along with pallor. On neurological examination, the patient was drowsy with a Glasgow Coma Scale (GCS) of E3M5V4. She had right-sided hemiparesis (muscle power around the shoulder was grade 3 and the power around the elbow was grade 4 with 40% power on hand grip; the right lower limb revealed grade 3-4 power). The deep tendon jerks were exaggerated on the right side. The right plantar was extensor. Sensory examination did not reveal any abnormality. There was evidence of third nerve palsy on the left side as indicated by ptosis, pupillary dilatation and external strabismus. The rest of the cranial nerves appeared normal. Tremor was noted on the right side. There was history of a stroke-like episode about a year ago; however, no imaging was performed at that time. Laboratory investigations revealed microcytic hypochromic anemia (hemoglobin 10 g/dl) and hyponatremia (130 mEq/l). The rest of the biochemical tests were normal.
MRI of the brain (performed on Avanto 1.5T scanner; Siemens, Erlangen, Germany) revealed a lacunar infarct in the superior pons (at the ponto-mesencephalic junction) on the left side in an anterior paramedian location [Figure 1]. Both inferior olives were diffusely enlarged, and were hyperintense on Fluid Attenuation Inversion Recovery (FLAIR) and T2W images and isointense on T1W images [Figure 2]. There was no restriction of diffusion or abnormal contrast enhancement. Diffusion Tensor Imaging (DTI) was performed by obtaining diffusion-weighted images (DWI) along 25 different directions with a b-value of 1000 s/mm.[2] Seed regions of interest (ROIs) were placed on both red nuclei and fiber tractography maps were generated. Fractional anisotropy values were also calculated for both sides by placing ROIs on either side [Figure 3]. There was decreased volume of the central tegmental tract on the left side without any displacement or deformation and there was suboptimal visualization of the central decussation [Figure 4]. The fractional anisotropy (FA) value was also lower on the left side (0.142 on the left vs. 0.439 on the right).
Figure 1(A and B).
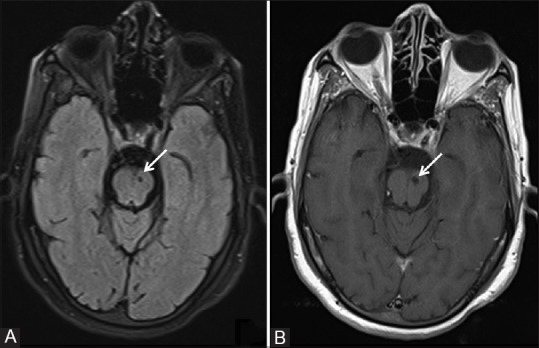
A panel of (A) axial FLAIR and (B) T1W MRI images showing a lacunar infarct in the superior part of the pons on the left side (white arrows)
Figure 2(A-C).
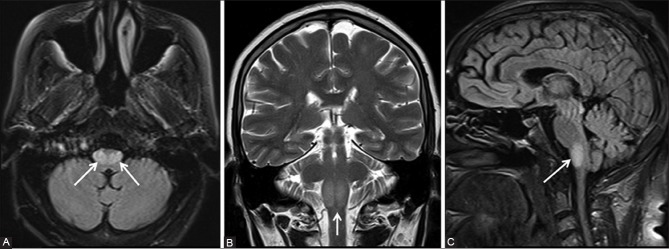
A panel of (A) FLAIR axial (B) T2-weighted coronal, and (C) FLAIR sagittal MRI images showing the hypertrophy of bilateral medullary olives (arrows). Hyperintensity is also noted in the enlarged olives
Figure 3(A and B).
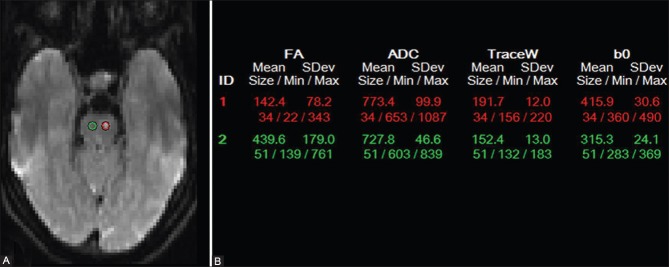
Seed regions of interest (ROIs) were placed on both red nuclei (A) and fractional anisotropy (FA) values were generated (B)
Figure 4.
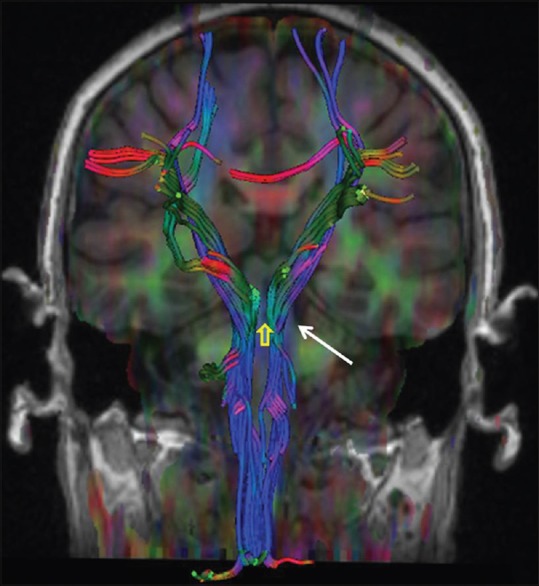
Tractography image showing decreased volume of the left central tegmental tract (white arrow) without any displacement or deformation and non-visualization of the central decussation (yellow arrow)
The location of the infarct in the region of the central decussating fibers, which form a part of the triangle of Guillain-Mollaret, would explain the non-visualization of the central decussation, decreased volume of the left central tegmental tract, and bilateral olivary abnormality, thus confirming a diagnosis of bilateral HOD. The absence of displacement or deformation of the central tegmental tract ruled out similar appearing brain stem tumors or masses. The patient was treated with intravenous fluids and her dyselectrolytemia was corrected. Her diabetic control was adequate and she was discharged after a week with residual right-sided hemiparesis, ptosis and tremor.
Discussion
HOD is a rare and unusual trans-synaptic neuronal degeneration in which degeneration is accompanied by hypertrophy. The perceived rarity of the condition may be partly ascribed to the lack of awareness of this entity. In this condition, the inferior olivary nucleus appears swollen and the normal convolutions are obscured.[1] This phenomenon follows deafferentiation of the inferior olivary nucleus due to injury to the dentato-rubro-olivary pathway or the triangle of Guillain-Mollaret that connects the ipsilateral red nucleus and inferior olivary nucleus with the contralateral dentate nucleus.[2] Efferent fibers from the dentate nucleus traverse in the superior cerebellar peduncle and connect to the contralateral red nucleus after decussating in the brachium conjunctivum. From the red nucleus, efferent fibers traverse through the central tegmental tract to the ipsilateral inferior olivary nucleus and thence to the contralateral cerebellum via the inferior cerebellar peduncle to complete the triangular circuit [Figure 5].
Figure 5.
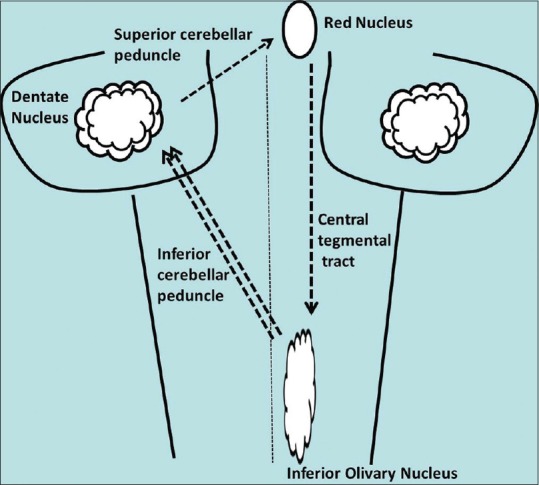
Schematic line diagram depicting the triangle of Guillain- Mollaret
HOD usually appears at around 3 weeks following an injury to the afferent pathway.[3] On histopathology, the neurons appear large, deformed, and show vacuolation, with marked astroglial reaction.[1] Numerous etiological factors can damage the dentato-rubro-olivary pathway leading to HOD, like infarction, trauma, tumors and vascular malformations, demyelination, infection, hemorrhage, or surgery.[3,4] This entity has been reported in both adults and children.
Patients usually present with dentato-rubral or Holmes’ tremor, palatal myoclonus, and ocular myoclonus. These abnormal involuntary motor movements are thought to arise from failure of inhibition of the inferior olive as many of the supplying nerve fibers from the dentate nucleus are primarily inhibitory or GABAergic. Holmes’ tremor is defined as a slow (2-5 Hz) rest and intentional tremor (and possible postural tremor) that occurs after a variable delay following injury to the aforementioned pathway. Palatal tremor is a rhythmic involuntary movement that appears mainly in the soft palate. Palatal tremors are not always seen in patients with HOD, but HOD is always found in patients with palatal myoclonus.[2,5]
Depending on the location of the offending lesion, the pattern of HOD might have one of the following features: (a) lesion in the brainstem - HOD unilateral and ipsilateral to the lesion, (b) lesion in the cerebellum or cerebellar peduncle - HOD unilateral and contralateral to the lesion, (c) midline lesion in the region of brachium conjunctivum affecting both central tegmental tracts - bilateral HOD, and (d) lesion in unilateral brainstem and cerebellum - bilateral HOD. [Table 1].[2,3,4,6]
Table 1.
Pattern of HOD depending on location of the offending lesion

Goto et al. have described six phases of pathological changes in chronological order from the onset: (a) no change within 24 h, (b) degeneration of olivary amiculum (peripheral white matter) after 2-7 days, (c) mild olivary hypertrophy due to neuronal enlargement at 3 weeks, (d) olivary enlargement due to neuronal enlargement and astrogliosis at 8.5 months, (e) olivary pseudohypertrophy due to neuronal chromatolysis and swollen, reactive astrocytes (gemistocytes) at and beyond 9.5 months, and (f) olivary atrophy due to neurolysis and degeneration of the amiculum in a few years.[7]
A meta-analysis of MRI findings in 45 patients by Goyal et al. showed that increased olivary signal on T2W images first appeared 1 month after the inciting lesion and persisted for at least 3-4 years. Olivary hypertrophy initially appeared on imaging studies obtained 6 months after the acute event, and resolved by 3-4 years. They also demonstrated three distinct MR stages in HOD and established specific time intervals for these changes: (a) Stage 1 shows increased signal on T2W and proton density-weighted images without hypertrophy of the olive and occurs within the first 6 months of ictus, (b) Stage 2 shows both increased signal intensity and hypertrophy and ends when hypertrophy resolves at approximately 3-4 years after ictus, and (c) Stage 3 only shows increased signal intensity and begins at the time hypertrophy resolves. This stage persists indefinitely.[8] These MRI findings correlate with the pathologic changes described by Goto et al. Proliferation of mitochondria in the glial cells in the early stages of HOD shows up as increased metabolic activity on positron emission tomography.[9]
Focal high signal intensity on T2W images on MRI within the anterolateral medulla is not pathognomonic of HOD. Similar signal changes may also be noted in demyelination, infections such as tuberculosis or AIDS, inflammatory conditions like sarcoidosis, infarction, Wernicke-Korsakoff syndrome, and malignant conditions like metastases, lymphoma, or gliomas. The presence of an inciting lesion in the brainstem or cerebellum, signal changes confined to the olivary nucleus with or without enlargement, and absence of contrast-enhancement correlating with the temporal profile should suggest the diagnosis of HOD.[2,6]
MRI fiber tractography can demonstrate disruption of the triangle of Guillain-Mollaret and can be useful in the diagnosis of HOD when findings on conventional MRI imaging are equivocal.[10] Dincer et al., apart from documenting disruptions in the triangle of Guillain-Mollaret in HOD, showed increase in radial and axial diffusivity in the inferior olives, representing demyelination and neuronal hypertrophy, respectively.[11]
In our patient, a lacunar infarct was present in the superior pons (at the ponto-mesencephalic junction) on the left side in an anterior paramedian location. This can be an asymptomatic and innocuous finding in an elderly patient. The finding of enlarged hyperintense inferior olives is also not specific to HOD as discussed earlier. The demonstration of an offending lesion in the vicinity of the pathway of Guillain-Mollaret on conventional MRI and neuronal tract abnormalities without displacement/deformity depicted on fiber tractography played a complementary role in the diagnosis of this entity.
We have to be, however, mindful of the fact that tractography using DTI only provides a Gaussian distribution of diffusion along neuronal fibers in limited directions and may be prone to biases. DTI does not depict crossing fibers as well as Diffusion Spectrum Imaging; however, the latter demands higher hardware and longer acquisition times.[12]
Conclusion
HOD is a rare trans-synaptic degeneration of the inferior olives that presents as hypertrophy rather than atrophy due to a lesion in the triangle of Guillain-Mollaret. The condition may be associated with palatal myoclonus or other movement disorders. It may present a potentially confusing appearance on imaging, and knowledge of the condition and its MRI characteristics can prevent erroneous diagnoses of more sinister diseases.
Footnotes
Source of Support: Nil
Conflict of Interest: None declared.
References
- 1.Anderson JR, Treip CS. Hypertrophic olivary degeneration and purkinje cell degeneration in a case of long-standing head injury. J Neurol Neurosurg Psychiatry. 1973;36:826–32. doi: 10.1136/jnnp.36.5.826. [DOI] [PMC free article] [PubMed] [Google Scholar]
- 2.Gatlin JL, Wineman R, Schlakman B, Buciuc R, Khan M. Hypertrophic olivary degeneration after resection of a pontine cavernous malformation: A case report. J Radiol Case Rep. 2011;5:24–9. doi: 10.3941/jrcr.v5i3.603. [DOI] [PMC free article] [PubMed] [Google Scholar]
- 3.Sanverdi SE, Oguz KK, Haliloglu G. Hypertrophic olivary degeneration in children: Four new cases and a review of the literature with an emphasis on the MRI findings. Br J Radiol. 2012;85:511–6. doi: 10.1259/bjr/60727602. [DOI] [PMC free article] [PubMed] [Google Scholar]
- 4.Conforto AB, Smid J, Marie SK, Ciríaco JG, Santoro PP, Leite Cda C, et al. Bilateral olivary hypertrophy after unilateral cerebellar infarction. Arq Neuropsiquiatr. 2005;63:321–3. doi: 10.1590/s0004-282x2005000200022. [DOI] [PubMed] [Google Scholar]
- 5.Rieder CR, Rebouças RG, Ferreira MP. Holmes tremor in association with bilateral hypertrophic olivary degeneration and palatal tremor: Chronological considerations. Case report. Arq Neuropsiquiatr. 2003;61:473–7. doi: 10.1590/s0004-282x2003000300028. [DOI] [PubMed] [Google Scholar]
- 6.Vaidhyanath R, Thomas A, Messios N. Bilateral hypertrophic olivary degeneration following surgical resection of a posterior fossa epidermoid cyst. Br J Radiol. 2010;83:e211–5. doi: 10.1259/bjr/27446907. [DOI] [PMC free article] [PubMed] [Google Scholar]
- 7.Goto N, Kaneko M. Olivary enlargement: Chronological and morphometric analyses. Acta Neuropathol. 1981;54:275–82. doi: 10.1007/BF00697000. [DOI] [PubMed] [Google Scholar]
- 8.Goyal M, Versnick E, Tuite P, Cyr JS, Kucharczyk W, Montanera W, et al. Hypertrophic olivary degeneration: Metaanalysis of the temporal evolution of MR findings. AJNR Am J Neuroradiol. 2000;21:1073–7. [PMC free article] [PubMed] [Google Scholar]
- 9.Dubinsky RM, Hallett M, Di Chiro G, Fulham M, Schwankhaus J. Increased glucose metabolism in the medulla of patients with palatal myoclonus. Neurology. 1991;41:557–62. doi: 10.1212/wnl.41.4.557. [DOI] [PubMed] [Google Scholar]
- 10.Shah R, Markert J, Bag AK, Curé JK. Diffusion tensor imaging in hypertrophic olivary degeneration. AJNR Am J Neuroradiol. 2010;31:1729–31. doi: 10.3174/ajnr.A1911. [DOI] [PMC free article] [PubMed] [Google Scholar]
- 11.Dinçer A, Özyurt O, Kaya D, Koşak E, Öztürk C, Erzen C, et al. Diffusion tensor imaging of Guillain-Mollaret triangle in patients with hypertrophic olivary degeneration. J Neuroimaging. 2011;21:145–51. doi: 10.1111/j.1552-6569.2009.00461.x. [DOI] [PubMed] [Google Scholar]
- 12.Hagmann P, Jonasson L, Maeder P, Thiran JP, Wedeen VJ, Meuli R. Understanding diffusion MR imaging techniques: From scalar diffusion-weighted imaging to diffusion tensor imaging and beyond. Radiographics. 2006;26(Suppl 1):S205–23. doi: 10.1148/rg.26si065510. [DOI] [PubMed] [Google Scholar]


