

Abstract
The 2010 Dietary Guidelines recommended that Americans increase potassium and decrease sodium intakes to reduce the burden of hypertension. One reason why so few Americans meet the recommended potassium or sodium goals may be perceived or actual food costs. This study explored the monetary costs associated with potassium and sodium intakes using national food prices and a representative sample of US adults. Dietary intake data from the 2001-2002 National Health and Nutrition Examination Survey were merged with a national food prices database. In a population of 4,744 adults, the association between the energy-adjusted sodium and potassium intakes and the sodium-to-potassium ratio (Na:K), and energy-adjusted diet cost was evaluated. Diets that were more potassium-rich or had lower sodium-potassium ratios were associated with higher diet costs, while sodium intakes were not related to cost. The difference in diet cost among participants with highest and lowest potassium intakes was $1.49 (95% CI 1.29, 1.69). A food-level analysis showed that beans, potatoes, coffee, milk, bananas, citrus juices and carrots are frequently consumed and low-cost sources of potassium. Based on existing dietary data and current American eating habits, a potassium-dense diet was associated with higher diet costs, while sodium was not. Price interventions may be an effective approach to improve potassium intakes and reduce the Na:K ratio of the diet. The present methods helped identify some alternative low-cost foods that were effective in increasing potassium intakes. The identification and promotion of lower-cost foods to help individuals meet targeted dietary recommendations could accompany future dietary guidelines.
Keywords: sodium, potassium, diet, socioeconomic position, dietary surveillance
Introduction
Elevated blood pressure is among the leading risk factors for cardiovascular disease (CVD) and all-cause mortality.1 Decreasing dietary sodium intakes lowers blood pressure and reduces CVD risk.2-4 Increasing potassium intakes may partially blunt the impact of a high-sodium diet on the development of high blood pressure.5, 6 The 2010 Dietary Guidelines for Americans recommended that Americans increase potassium and simultaneously reduce sodium intakes.7
There is evidence that the recommended dietary goals will prove to be a challenge for public health.8 Based on 2003-2008 data, fewer than 0.015% of American adults jointly met the current dietary guidelines for potassium and sodium.9 Over the past 30-40 years no segment of the population has simultaneously approached the recommended sodium and potassium intakes.9
Current efforts have focused on reformulating the sodium content of processed and prepared foods, the largest contributors to sodium intakes in the US.10-12 Population-wide efforts to increase potassium intakes remain elusive. Substituting potassium chloride for sodium chloride in processed foods is not a feasible option, given the bitter taste of potassium salts.13 Further, persons with chronic kidney disease, end stage renal disease or those taking angiotensin-converting enzyme inhibitors and angiotensin receptor blockers that impair potassium excretion, may be adversely affected by excessive dietary potassium, limiting the utility of population-wide fortification or re-formulation.14
The promotion of foods that are naturally high in potassium may be another way to lower the sodium-to-potassium ratio (Na:K) of the diet.7 Increasing the consumption of fresh fruits, fruit juices, vegetables, dried fruits and nuts and seeds may help increase dietary potassium, while keeping sodium consumption low. However, many of the foods identified by the Dietary Guidelines as good sources of potassium, such as dark green vegetables and fresh fish,7 tend to carry a price premium, that might make them less accessible to lower-income groups.15 Past studies have shown that potassium-rich diets were relatively more expensive than potassium-poor diets.16 Furthermore, some of the foods identified as good sources of potassium are so infrequently consumed that they contribute minimal amounts of potassium to the population.
Evaluating the behavioral and economic feasibility of Dietary Guidelines is an important step in facilitating their implementation. Lower-income groups who suffer disproportionately from hypertension, other CVD risk factors, and heart disease may have limited social and economic resources.17, 18 This study explored the economic dimension of potassium and sodium intakes among US adults, with an emphasis on identifying affordable food sources of dietary potassium as previous research characterized potassium as a comparatively more expensive nutrient of concern.16
Subjects and Methods
The National Health and Nutrition Examination Survey
The source of dietary intake data in the 2001-02 National Health and Nutrition Examination Survey (NHANES) was a single 24-hour dietary recall, where respondents reported all foods and beverages consumed the previous day, from midnight to midnight. The examination protocol and data collection methods are fully documented elsewhere.19 The 24-hour recall data includes the portion and description of each individual food and beverage consumed. In addition to dietary data, NHANES includes in-depth demographic, health behavior and health outcome questionnaires. The use of this existing, publicly available data set did not qualify as “human subjects research” and was exempt from human subjects review by the University of Washington institutional review board.
Estimating Diet Cost
Methods used to merge the food prices database with the individual foods file of the NHANES data are provided in Rehm et al 2011.20 Briefly, the Center for Nutrition Policy and Promotion (CNPP) price database, released in May of 2008, provided the cost per 1 gram edible portion of all foods and beverages reported in NHANES dietary recalls, excluding alcoholic beverages and water. 21 The prices were based on retail prices paid by members of the Nielsen Homescan Consumer Panel during the same period of 2001-2002 NHANES data collection and reflected the average prices paid by households across the US. In creating the database CNPP assumed that all foods and beverages were obtained from stores. Accordingly the database did not permit estimations of actual food expenditures. Rather, merging the CNPP database with the NHANES provided estimates of the monetary value of foods consumed, which can be used in assessing the “economic accessibility” of a healthy diet. Thus far, CNPP has only released food price databases corresponding to NHANES 2001-02 and 2003-04. More recent data is not available.
The estimated cost of the diet was computed from each individual’s dietary recall by multiplying the price per gram with the portion of each food consumed and then summing these values for each participant. Diet cost was estimated for all foods and beverages including alcohol. Tap and bottled water were excluded from the price estimation.
Since the cost of the diet was highly correlated with the total quantity of food and energy consumed (r=0.65 for energy and r=0.49 for grams) and with each nutrient of interest (r=0.75 for sodium and r=0.71), energy-adjusted diet cost was computed and expressed per 2,000 kcal. The energy-adjusted cost variable is more meaningful when comparing sub-populations that may have different energy requirements or intakes.
Analytic Approach
Survey-weighted means and 95% confidence intervals of the nutrient density values and the Na:K ratio, and energy adjusted diet cost were estimated for each independent variable. Age-adjusted means were calculated using direct standardization. Primary stratification variables from the demographic questionnaire were age (20-29, 30-44, 45-64, 65-74, ≥75), gender, race/ethnicity (Mexican-American/Other Hispanic, Non-Hispanic White and Non-Hispanic Black), family income-to-poverty ratio (<2, 2-3.99 and ≥4) and education (<high school, high school graduate/equivalent, some college and college graduate). The Mexican-American/other Hispanic groups were combined due to small numbers in the other Hispanic group.
Family income-to-poverty ratio (IPR) adjusted for the number of adults and children in each family and is the ratio of the family income to the federal poverty level. For example, given the 2001 federal poverty level of $17,650 for a family of four, an IPR of 1.5 would correspond to an income of $26,476 for a family of this size. Analyses of education were limited to adults 25 years-old or greater, since most have completed their education by this point. Household food security was included as an additional independent variable. Individuals were dichotomized as being either fully food secure or food insecure.
Statistical heterogeneity in diet cost, Na:K ratio and sodium and potassium densities were assessed with a survey-weighted Wald test and trends in ordinal variables were assessed using a survey-weighted linear regression model with price as the outcome of interest, a categorical covariate to adjust for age and a grouped linear variable for the independent variable of interest (e.g., family income-to-poverty ratio (IPR) < 2 = 1, IPR 2-3.99 = 2, IPR ≥ 4 = 3).
Analyses of the association between energy-adjusted diet costs, potassium and sodium density, and the Na:K ratio, used survey-weighted linear regression models, with energy-adjusted diet cost as the outcome and quintiles of the dietary factors of interest as the independent variable. Quintiles were constructed for each dietary variable using survey weights so that each quintile corresponds to 20% of the United States adult population. The initial models (Model 1) adjusted for age group, race/ethnicity and gender. A second model (Model 2) adjusted for family IPR in addition to previous noted variables, while a final model (Model 3) evaluated the additional inclusion of education (limited to adults aged ≥25y). Survey-weighted marginal means, representing the mean value at the average covariate distribution for the population of interest, were estimated after each model. The weighted median and inter-quartile range for energy-adjusted diet cost was estimated by sodium and potassium density and Na:K quintiles.
Pairwise comparisons were made between each quintile and the third quintile (reference group) for each analysis using a survey-weighted Wald test. Linear trends were evaluated by including a grouped linear variable for sodium and potassium density and the Na:K. Given concerns that the linear trend in diet cost by sodium quintile was influenced by the higher costs observed in the highest quintile, we conducted sensitivity analysis of the trend tests by omitting the highest quintile. Additional secondary analyses evaluated whether the association between sodium and potassium density and the Na:K varied by population sub-group (e.g., age group, gender, race/ethnicity, family income and education).
Identifying Low-cost sources of Potassium
A secondary food-based analysis was conducted with the goal of identifying the lowest-cost sources of 10% daily value for potassium (i.e., 350 mg) using food/beverage groups previously developed by the National Cancer Institute (NCI) for evaluating sources of key nutrients in the US. There were 96 food/beverage groupings. Examples of groups include yeast breads, onions, 100% orange/grapefruit juice and whole milk.22 Authors of this study coded the NCI food groups using the Food and Nutrition Database for Dietary Studies 1.0. Potassium was the focus of this secondary analysis because we observed that potassium was highly cost-sensitive, but sodium was not. Therefore, decreasing sodium intakes is unlikely to have an economic component, but increasing potassium may. This analysis was restricted to foods/beverages groups that provided at least modest amounts of potassium per median serving size (>87.5 mg or 2.5% of the recommended daily allowance [RDA]), provided 10% of potassium RDA for less than 400 calories and that had an Na:K ratio less than or equal to 1.36 (the population mean). These food/beverages were selected because any amount of consumption would tend to lower the Na:K ratio. These analyses were performed for foods as reported by participants so they account for the frequency with which salt is added during preparation of foods (but not added at the table). Therefore these results may over-estimate the potential benefit of cooked vegetables or other foods where salt is added at the table on the Na:K ratio.
Identifying Foods Associated with favorable Na:K Ratio
In order to better understand what food groups were associated with the Na:K ratio a secondary analysis was conducted using the previously described food groups. The outcome of this analysis was the log-transformed Na:K ratio and covariates for age group, gender and energy were included. A partial least squares (PLS) regression model was fit which included a continuous variable scaled to the inter-quartile range (IQR) of grams consumed for that food group amongst those consuming that food group, and adjustment variables for total energy, age group and gender. For example, for reduced fat milks, the inter-quartile range was 335.5 grams (25th%ile=122.0 g/day and 75th%ile=457.5 g/day). This approach was used as opposed to survey-weighted least squares because the PLS regression can account for the correlations between food groups.23 A PLS model was used since the consumption of many foods are highly correlated with each other (e.g., fried potato and hamburger) and a standard regression model can only accommodate a limited set of covariates. The Wald statistic was estimated by dividing the regression coefficient and standard error and results are presented for foods significantly (p<0.05) associated with a lower Na:K ratio.
All analyses of the association between nutrient intakes and diet cost were survey-weighted to account for the complex sampling scheme of NHANES and were conducted using Stata 12.0 (College Station, TX, 2011). The secondary PLS analysis used SIMCA-P (UMETRICS, Umeå, Sweden).
Results
Diet cost, potassium and sodium density, and the Na:K ratio by socio-demographic group
In descriptive analyses, on a per-calorie basis, older adults tended to consume more potassium and sodium, but had lower Na:K ratios (Table 1). Women consumed more potassium than men (2715 mg/d, 95% confidence interval [CI] 2641, 2790 vs. 2562 mg/d, 95% CI 2499, 2625), but no difference was observed for sodium or Na:K ratio. The Mexican-American/other Hispanic group consumed the most potassium (2704 mg/d, 95% CI 2625, 2780) and least sodium (2997 mg/d, 95% CI 2883, 3111), while non-Hispanic whites had the most expensive diets on a per-calorie basis ($4.53/d, 95% CI 4.39, 4.68). The non-Hispanic black population consumed the least potassium (2294 mg/d, 95% CI 2239, 2349) and had the most unfavorable (highest) Na:K ratio (1.52, 95% CI 1.46, 1.58) and lowest energy-adjusted diet costs. High family income to poverty ratio was associated with higher potassium intake (p-trend<0.001), lower Na:K ratio (p-trend=0.003) and higher energy-adjusted diet costs (p-trend<0.001). Individuals with less education tended to consume less potassium (p-trend=0.001) and had marginally higher Na:K ratios (p-trend=0.009) and lower-cost diets (p-trend<0.001). However, adults with higher education tended to consume more sodium than those with less education (p-trend=0.023). Individuals living in households with any degree of food insecurity consumed less potassium, and had higher Na:K ratio and lower-cost diets than individuals living in fully food secure households.
Table 1.
Age-adjusted mean energy-adjusted daily diet cost, potassium and sodium density, and sodium-to-potassium ratio by socio-demographic strata among US adults
|
|
|||||||||
|---|---|---|---|---|---|---|---|---|---|
| n | Mean $ per 2000 kcal | 95% CI | Mean K (mg) per 2000 kcal | 95% CI | Mean Na (mg) per 2000 kcal | 95% CI | Mean Na:K ratio | 95% CI | |
| Total | 4,744 | 4.45 | 4.34, 4.56 | 2623 | 2570, 2675 | 3169 | 3125, 3213 | 1.37 | 1.34, 1.40 |
| Age-Group1 | |||||||||
| 20-29 | 916 | 4.14 | 3.91, 4.37 | 2176 | 2082, 2271 | 3032 | 3946, 3119 | 1.62 | 1.55, 1.69 |
| 30-44 | 1,256 | 4.40 | 4.26, 4.53 | 2517 | 2447, 2587 | 3171 | 2081, 3261 | 1.41 | 1.34, 1.47 |
| 45-64 | 1,417 | 4.61 | 4.48, 4.74 | 2779 | 2691, 2867 | 3176 | 3088, 3265 | 1.27 | 1.21, 1.33 |
| 65-74 | 584 | 4.81 | 4.66 4.95 | 3108 | 2984, 3232 | 3288 | 3159, 3417 | 1.15 | 1.09, 1.18 |
| ≥75 | 571 | 4.41 | 4.22, 4.59 | 3039 | 2930, 3148 | 3366 | 3259, 3473 | 1.21 | 1.15, 1.27 |
| P-trend2 | <0.001 | <0.001 | <0.001 | <0.001 | |||||
| Gender | |||||||||
| Male | 2,250 | 4.48 | 4.35, 4.61 | 2562 | 2499, 2625 | 3142 | 3091, 3193 | 1.35 | 1.31, 1.40 |
| Female | 2,494 | 4.44 | 4.33, 4.55 | 2715 | 2641, 2790 | 3212 | 3139, 3285 | 1.37 | 1.32, 1.41 |
| P-difference3 | 0.5 | 0.005 | 0.11 | 0.40 | |||||
| Race/ethnicity | |||||||||
| Non-Hispanic White | 2,494 | 4.53 | 4.39, 4.68 | 2670 | 2597, 2744 | 3206 | 3155, 3257 | 1.36 | 1.32, 1.40 |
| Mexican-American/Other Hispanic | 1,200 | 4.16 | 4.08, 4.24 | 2704 | 2628, 2780 | 2997 | 2883, 3111 | 1.25 | 1.20, 1.30 |
| Non-Hispanic Black | 890 | 4.12 | 4.01, 4.22 | 2294 | 2239, 2349 | 3056 | 2972, 3139 | 1.52 | 1.46, 1.58 |
| P-difference3 | <0.001 | <0.001 | 0.017 | <0.001 | |||||
| Family Income to Poverty Ratio | |||||||||
| <2 | 1,879 | 4.11 | 4.00, 4.21 | 2512 | 2413, 2610 | 3167 | 3084, 3250 | 1.46 | 1.40, 1.53 |
| 2-3.99 | 1,259 | 4.42 | 4.26, 4.57 | 2636 | 2571, 2700 | 3150 | 3036, 3263 | 1.34 | 1.28, 1.39 |
| ≥4.0 | 1,291 | 4.78 | 4.63, 4.94 | 2751 | 2689, 2814 | 3228 | 3145, 3311 | 1.30 | 1.22, 1.38 |
| P-trend2 | <0.001 | <0.001 | 0.185 | 0.003 | |||||
| Educational Attainment (age ≥ 25) | |||||||||
| < High school/equivalent | 1,247 | 4.25 | 4.07, 4.43 | 2559 | 2428, 2690 | 3075 | 2950, 3201 | 1.38 | 1.27, 1.49 |
| High school/equivalent | 949 | 4.32 | 4.20, 4.43 | 2592 | 2505, 2680 | 3173 | 3078, 3269 | 1.36 | 1.31, 1.42 |
| Some college | 1,056 | 4.51 | 4.38, 4.64 | 2716 | 2624, 2808 | 3190 | 3105, 3275 | 1.32 | 1.27, 1.37 |
| College graduate | 920 | 4.83 | 4.63, 5.04 | 2867 | 2771, 2963 | 3261 | 3174, 3348 | 1.24 | 1.19, 1.29 |
| P-trend2 | <0.001 | 0.001 | 0.023 | 0.009 | |||||
| Household food security | |||||||||
| Fully food secure | 3,529 | 4.52 | 4.40, 4.63 | 2678 | 2625, 2732 | 3173 | 3129, 3217 | 1.34 | 1.30, 1.37 |
| Any food insecurity | 930 | 4.11 | 3.99, 4.22 | 2531 | 2409, 2653 | 3176 | 3019, 3334 | 1.42 | 1.35, 1.50 |
| P-difference3 | <0.001 | 0.006 | 0.97 | 0.052 | |||||
Values in this table correspond to the survey-weighted age-adjusted mean diet cost, sodium density, potassium density and sodium-to-potassium ratio. Age-adjustment was undertaken using direct standardization by age group using weights from the 2000 US Standard Population.
Age group results are not age-adjusted.
P-values for trend were obtained from a survey-weighted linear regression model treating ordered variables as continuous variables.
P-values for difference were obtained from a Wald test from a survey-weighted linear regression and indicate any overall significant difference.
The association between diet costs, sodium and potassium density, and the Na:K ratio
In survey-weighted linear regression models, higher potassium density was systematically associated with higher energy-adjusted diet costs. Persons consuming more than 3350 mg or potassium per 2,000 kcal had diets that cost on average +39% (95% CI 35, 42) or $1.50/d (95% confidence interval [CI] 1.33, 1.66) more than those consuming fewer than 1814 mg of potassium/2000 kcal (Table 2). The association between potassium density and diet costs was robust, as adjusting for family income-to-poverty ratio and education did not alter the association.
Table 2.
Adjusted mean energy-adjusted diet cost ($/2000 kcal) by Na:K ratio quintile, potassium (mg) per 2,000 calories and sodium (mg) per 2,000 calories among US adults
| Model 11 | Model 22 | Model 33 | ||||||||
|---|---|---|---|---|---|---|---|---|---|---|
|
| ||||||||||
| n | Adjusted Mean $ per 2000 kcal | 95% CI | n | Adjusted Mean $ per 2000 kcal | 95% CI | n | Adjusted Mean $ per 2000 kcal | 95% CI | Median (IQR) | |
| K (mg) per 2,000 kcal | ||||||||||
| Q1 (<1814) | 923 | 3.90‡ | 3.78, 4.03 | 873 | 3.96† | 3.79, 4.12 | 679 | 3.92† | 3.80, 4.06 | 3.49 (2.95, 4.54) |
| Q2 (1814-2289) | 947 | 4.03‡ | 3.86, 4.20 | 890 | 4.03‡ | 3.90, 4.16 | 761 | 4.08† | 3.91, 4.25 | 3.79 (3.13, 4.59) |
| Q3 (2290-2746) [ref] | 919 | 4.35 | 4.22, 4.37 | 858 | 4.32 | 4.18, 4.47 | 766 | 4.36 | 4.20, 4.52 | 4.08 (3.36, 5.14) |
| Q4 (2747-3349) | 938 | 4.58 | 4.36, 4.80 | 874 | 4.55 | 4.33, 4.77 | 808 | 4.61¶ | 4.42, 4.79 | 4.38 (3.64, 5.35) |
| Q5 (≥3350) | 1017 | 5.40‡ | 5.24, 5.56 | 934 | 5.36‡ | 5.19, 5.53 | 883 | 5.42‡ | 5.25, 5.58 | 5.05 (4.17, 6.31) |
| P trend | <0.001 | <0.001 | <0.001 | - | ||||||
| Na (mg) per 2,000 kcal | ||||||||||
| Q1 (<2291) | 1003 | 4.45 | 4.26, 4.65 | 928 | 4.46 | 4.26, 4.66 | 800 | 4.46 | 4.27, 4.65 | 4.05 (3.21, 5.21) |
| Q2 (2291-2794) | 947 | 4.25 | 4.15, 4.36 | 885 | 4.25 | 4.14, 4.35 | 781 | 4.31 | 4.18, 4.44 | 3.97 (3.26, 5.04) |
| Q3 (2795-3289) [ref] | 993 | 4.34 | 4.22, 4.46 | 933 | 4.34 | 4.22, 4,47 | 820 | 4.45 | 4.31, 4.58 | 4.04 (3.34, 5.06) |
| Q4 (3290-3923) | 899 | 4.41 | 4.20, 4.65 | 835 | 4.37 | 4.17, 4.58 | 736 | 4.70 | 4.25, 4.66 | 4.10 (3.35, 5.15) |
| Q5 (≥3927) | 902 | 4.80‡ | 4.64, 4.96 | 848 | 4.78‡ | 4.61, 4.95 | 760 | 4.85‡ | 4.73, 4.97 | 4.60 (3.73, 5.65) |
| P trend4 | 0.002 | 0.003 | 0.001 | - | ||||||
| Na:K quintile | ||||||||||
| Q1 (<0.84) | 1029 | 4.95‡ | 4.76, 5.14 | 946 | 4.96‡ | 4.77, 5.16 | 871 | 4.97‡ | 4.79, 5.15 | 4.69 (3.73, 5.82) |
| Q2 (0.84-1.10) | 976 | 4.59¶ | 4.38, 4.78 | 909 | 4.56† | 4.36, 4.75 | 830 | 4.63† | 4.45, 4.82 | 4.32 (3.49, 5.41) |
| Q3 (1.11-1.36) [ref] | 897 | 4.34 | 4.20, 4.48 | 838 | 4.32 | 4.19, 4.46 | 739 | 4.39 | 4.25, 4.52 | 4.04 (3.39, 5.08) |
| Q4 (1.37-1.78) | 956 | 4.34 | 4.20, 4.48 | 898 | 4.32 | 4.18, 4.46 | 779 | 4.40 | 4.25, 4.55 | 3.98 (3.27, 5.15) |
| Q5 (≥1.79) | 886 | 4.04‡ | 3.91, 4.17 | 838 | 4.06‡ | 3.92, 4.20 | 678 | 4.12† | 3.97, 4.26 | 3.70 (3.07, 4.65) |
| P trend | <0.001 | <0.001 | <0.001 | - | ||||||
Results presented in this table were derived from a series of survey-weighted linear regression models.
Adjusted for age group, race/ethnicity and gender.
Adjusted for factors in Model 1 and income-to-poverty ratio.
Adjusted for factors in Model 2 and education. This model is restricted to adults age≥25.
P-values for trend were obtained from a survey-weighted linear regression model treating ordered variables as a continuous.
P-trend in sodium density model was driven entirely by the higher energy-adjusted diet costs in the highest quintile. P-trend omitting fifth quintile was 0.93 for Model 1, 0.70 for Model 2 and 0.72 for Model 3. Pairwise comparisons using the third quintile as the reference group.
P-values indicated by symbol in superscript as follows:
0.01 < p < 0.05;
0.001< p < 0.01;
p<0.001
Lower Na:K ratio was systematically associated with diet cost. Persons with Na:K ratios <0.84 had diets that cost on average +21% (95% CI 17, 25) or $0.91/d (95% CI 0.75, 1.08) more than those with a Na:K ratio of more than 1.79 (Table 2). The association between Na:K ratio and diet cost was statistically robust. Adjusting for IPR and education did not alter the observed association.
The association between low Na:K ratio and higher diet costs was not driven by sodium. There was evidence that diet cost increased at higher levels of sodium intakes. Individuals in the highest sodium quintile (≥3927 mg per 2000 kcal) had mean diet costs that were approximately +9% (95% CI 5, 14%) or $0.35 (95% CI 0.15, 0.55) more costly than individuals in the lowest sodium quintile. The relation between the Na:K ratio and diet costs was driven largely by the strong relation between potassium and diet cost. Secondary analyses adjusting for both measures of nutrient density simultaneously yielded similar results to those presented here.
The association between diet costs and the Na:K ratio and sodium and potassium density did not differ by age group, race/ethnicity, family income, or education. Table S1 describes the gender-specific association between diet cost and the dietary outcomes of interest adjusted for age group and race/ethnicity. The association between diet cost and potassium density varied by gender (p-value for interaction term=0.019), while sodium density did not vary significantly by gender (p-value for interaction term=0.09). Women consuming greater than 3350 mg potassium per 2,000 kcal had diet costs that were $1.77/d (95% CI 1.51, 2.02) higher or 46% (95% CI 40, 52) more costly per day than those women consuming less than 1814 mg of potassium per 2,000 kcal. For men, a positive association was also observed, but it was weaker (+$1.14/d [95% CI 0.95, 1.33] or +30% [95% CI 24, 35] comparing those with the most potassium rich diets to those consuming the least potassium). The association between diet cost and the Na:K ratio did not vary by gender (p-value for interaction term = 0.59).
Lowest cost potassium sources
A food-based analysis (Table 3) was conducted to identify the lowest-cost sources of potassium. The cheapest sources of dietary potassium were dried beans, followed by white potatoes and coffee. Milk, bananas, fried potatoes, and sweet potatoes were also inexpensive sources of potassium. Foods that would have the lowest-cost impact on Na:K ratio would be coffee, bananas, dried fruit, fruits juices and melon, because these items contain negligible amounts of sodium. Various varieties of milk were also inexpensive sources of potassium.
Table 3.
Lowest-cost sources of potassium, NHANES 2001-02
| Food/beverage group | % Consuming | $ Per 350 mg of Potassium | Na (mg) per 350 mg serving of potassium | Na:K ratio per serving |
|---|---|---|---|---|
| Dried beans | 6.3 | $0.099 | 193 | 0.55 |
| Other white potatoes | 17.3 | $0.137 | 303 | 0.87 |
| Coffee | 60.0 | $0.154 | 15 | 0.04 |
| Skim milk | 12.0 | $0.154 | 94 | 0.27 |
| Bananas | 14.6 | $0.159 | 1 | <0.01 |
| Fried white potatoes | 19.7 | $0.162 | 127 | 0.36 |
| Reduced fat milk | 25.2 | $0.170 | 100 | 0.29 |
| Whole milk | 13.5 | $0.183 | 100 | 0.29 |
| Sweet potatoes | 1.2 | $0.207 | 208 | 0.59 |
| Coleslaw | 1.9 | $0.220 | 476 | 1.36 |
| Avocado | 2.4 | $0.235 | 61 | 0.17 |
| Vegetable juice | 1.3 | $0.278 | 312 | 0.89 |
| Dried fruit | 3.5 | $0.279 | 5 | 0.01 |
| 100% orange/grapefruit juice | 19.3 | $0.282 | 4 | 0.01 |
| Carrots | 12.6 | $0.282 | 167 | 0.48 |
| 100% fruit juice, not citrus juice | 8.3 | $0.296 | 8 | 0.02 |
| Spinach | 2.6 | $0.337 | 108 | 0.31 |
| Hot cereal | 7.3 | $0.337 | 441 | 1.26 |
| Nuts/seeds and nut/seed mixed dishes | 15.5 | $0.369 | 222 | 0.63 |
| Melon | 6.5 | $0.388 | 20 | 0.06 |
Results in this table were derived from a descriptive food-level analysis where only the percent consuming was derived from 2001-2002 NHANES data.
The association between Na-K ratio and food groups
Forty-one food/beverage groups were significantly associated with a decreased Na:K ratio. Consuming approximately 187g (i.e., 0.33 cups) of 100% orange/grapefruit juice was associated with a 10.5% decrease (95 CI 8.6, 12.5) in the Na:K ratio. Consumption of 444 g of coffee (coffee + water) was associated with a 8.4% decrease (95% CI 5.3, 11.5) in the Na:K ratio, while 335.5 g of reduced fat milk was associated with a 5.6% decrease (95% CI 3.9, 7.2) in the Na:K ratio. Additional foods associated with a lower Na:K ratios are provided in Figure 1 and Supplemental Table 2.
Figure 1.
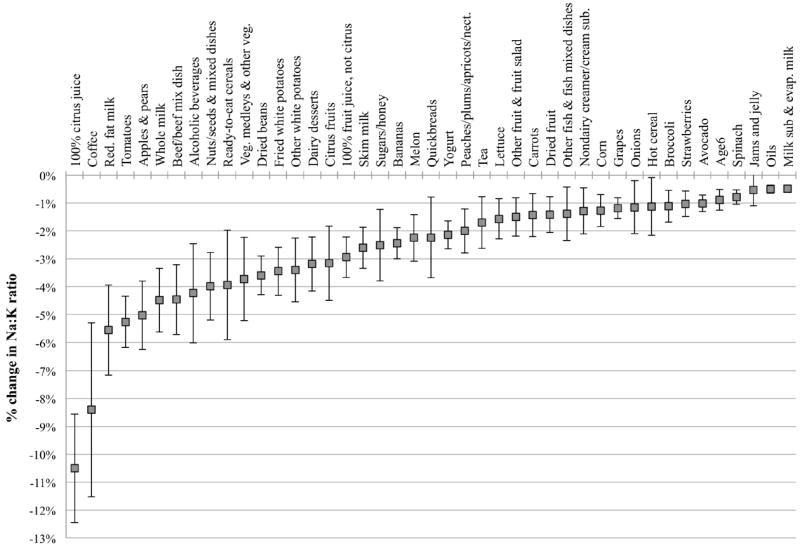
Food groups associated with decreased Na:K ratio, NHANES 2001-02. Error bars correspond to 95% confidence interval.
Discussion
This is the first report to characterize the monetary cost of diets based on potassium, sodium and Na:K ratios in a nationally representative sample of US adults. Given the growing body of poor adherence to recommended intakes of sodium and potassium, evaluations of potential barriers to increasing potassium intake and reducing sodium intake are warranted 9, 24. Here, diets with more potassium and lower Na:K ratios were associated with higher energy-adjusted diet costs. The association remained after adjusting socioeconomic status and was not sensitive to adjustment for additional factors such as body mass index. Higher intake of sodium was related to higher diet costs, though the significant linear trend was driven by high diet costs in the highest sodium density group.
In other analyses, we found that some individuals are able to achieve higher potassium density and lower Na:K ratios at relatively low cost. For example, one-quarter of US adults were able to achieve a lower Na:K ratio for less than $3.73/d, which is comparable to the median cost estimate for those consuming the highest Na:K ratio diets. While the overall direction of the relationship observed here is consistent, there is much individual variability in the relation between diet cost, nutrient density and Na:K ratio. Future work should identify those population sub-groups or dietary patterns associated with achievement of more healthful diets for lower cost.25 Such information may facilitate the provision of dietary recommendations that account for potential economic constraints.
While our results are robust, some discussion of the absolute and relative size of the observed associations is warranted. The observed absolute difference between the extreme quintiles was $1.4-1.50/d for potassium density and $0.85-0.91/d for Na:K ratio. While these amounts may seem trivial, placing them in context is key. First, the differences in diet cost presented here are per-person per-day and would correspond to approximately $511-547.50 per-person per-year or $1022-1095 for a two-adult household for potassium density. Furthermore, the prices here are in 2001-2002 dollars and would be much greater today. In relative terms, increasing potassium intake from the lowest to highest quartile corresponds to a 36-39% increase in diet cost. The lack of a positive association between higher diet costs and higher dietary sodium density costs suggests, under current eating patterns, that reducing sodium can likely be done without an increase in diet costs.
Implications for practice and policy
The 2010 Dietary Guidelines identified the most potassium-rich foods in the US food supply.7 However, these potassium-rich foods were not ranked by cost or consumer acceptance. The present analyses, based on observed consumption patterns, identified the most acceptable and affordable foods that were linked with favorable Na:K ratios. Among the fruits, vegetables, and milk products associated with lower Na:K ratios were bananas, citrus fruit and juices, and other juices but also coffee, milk (whole and skim), fried potatoes and dried beans. While some of these foods have been previously identified as good potassium sources,7, 26 the relative ranking of these foods based on their association with a lower Na:K ratio, while respecting actual dietary habits of the population is novel (Figure 1). While vegetables are often recommended as a means to improve diet quality,7 they may be less effective in reducing the Na:K ratio than fruits, since sodium is often added during preparation or at the table.
The present analyses make a unique contribution in identifying affordable sources of dietary potassium that can be incorporated into practical dietary advice. Arguably milk, fruit juice, beans and potatoes are more affordable and will appeal to a broader cross section of consumers than beet greens, carrot juice, canned clams or halibut, all foods highlighted in the Dietary Guidelines.3 Listings of relative cost and frequency of consumption of the recommended foods may help nutrition and medical professionals offer more effective and practical dietary advice.
Limitations and methodological considerations
This study had important limitations. First, deriving diet costs using a national food prices database may not reflect the actual prices for food paid by individual NHANES participants. This is similar to the weakness inherent in deriving nutrient intakes from nutrient composition databases, which do not reflect potential heterogeneity in the nutrient levels of foods actually consumed. Despite limitations in the use of standard prices database, it represents a meaningful source of information on food prices that can be linked to individual data on diets and health.27 A related concern leading us to interpret these results cautiously is that actual consumer behavior and the importance of cost to consumers was unmeasured. While we did observe a robust association between diet cost and potassium density and Na:K ratio, we could not ascertain that price was a key motivator of food choice in this sample of adults. Previous research has indicated that food costs trail only taste as a the main determinants of food choice,28 and a recent trials in the US, Europe and New Zealand have indicated that price promotions on healthier foods, including fruits and vegetables, increases the purchasing and consumption of these foods.29-31 In addition, between 2008 and 2012, the combination of rising food costs and falling real incomes in the United Kingdom coincided with increases in purchasing of energy-dense foods and reductions in fruit purchasing.32 Second, a single 24-h recall does not measure an individual’s habitual intake. However, data from a single 24-h recall are useful for examining population-level means and provide useful information on the association between diet cost and dietary constituents in a single-day. Third, the NHANES 24-hour recall does not directly assess salt added at the table, but does evaluate the regularity of salt use in cooking or at the table.19 The reported sodium intakes suffer from a definite underestimate and the reported Na:K ratio may be an under-estimate of the true Na:K ratio in the population. The absence of accurate data on salt added at the table may lead to an over-stating of the benefits of some foods as they relate to the Na:K ratio, including cooked vegetables and beans. Sodium had little impact on diet costs and it is unlikely that dramatic differences in the use of table salt explain the robust association between the Na:K ratio and diet costs. Lastly, while the Na:K ratio, and sodium and potassium density, represent important components of a healthful diet, they should not be viewed in isolation of other components of diet quality. With regards to the association between Na:K ratio, potassium density and diet costs, there appears to be a consistent association between higher diet costs and multiple indicators of diet quality, including the 2005 Healthy Eating Index, Alternative Healthy Eating Index, adherence to Dietary Approaches to Stopping Hypertension (DASH) diet pattern and energy density of the diet.20, 25, 33, 34 The secondary analyses identifying the lowest cost sources of potassium and foods associated with lower Na:K ratios did not account for factors that may be negatively associated with diet quality, including trans fatty acids and added sugars. For example, consumption of coffee may be associated with use of added sugars or fats, so universal advice to increase coffee intake based on these results alone is not warranted.
Identifying those foods and beverages that provide optimal nutrition at lowest cost remains an important avenue of research. The higher cost of healthful diets may be one mechanism contributing to diet-related disparities.35 The potential role of diet costs as they relate to disparities in CVD risk factors, especially among lower income groups, is an important topic for further research. Data such as these can also be used to identify components of diets that deviate from the observed cost and quality gradient.
Conclusion
Improving diet is a critical component of population-level strategies to reduce the burden of chronic diseases.36 We observed that diets beneficial for blood pressure and cardiovascular health tended to be more costly. Future work should focus on identifying lower-cost and socially acceptable foods that can be part of a dietary pattern supportive of a diet that reduce the burden of hypertension and CVD. The identification of the lowest-cost sources of potassium may be particularly useful in the provision of advice to patients or individuals with limited resources. Dietary guidelines intended for individuals and populations could consider issues of food accessibility, acceptability, preparation challenges, and economic constraints – though data, such as these, can be used to place guidelines and recommendations within the proper context.
Supplementary Material
What is known about this topic
A diet high in potassium and low in sodium is recommended to control hypertension, but too few US adults consume the recommended amounts of either nutrient.
Food cost is an established determinant of food choices and previous observational research has shown that individuals consuming higher-cost diets are likely to have higher quality diets.
Less is known regarding the association between diet cost and specific hypertension-related nutrients of concern.
What this study adds
Using nationally representative data, we observed that high potassium diets tended to be more costly than a low potassium diets. Sodium intakes were not uniformly related to diet costs, but adults consuming diets with a low sodium-to-potassium ratio also had higher cost diets.
In a food-level analysis we identified frequently consumed and lowest cost sources of potassium, including dried beans, white potatoes, coffee, milk and bananas.
Acknowledgments
AD, CR and PM designed and conducted the research. CR analyzed the data and MM modeled the indicator foods. AD, CR, MM and PM wrote the paper. AD and CR had primary responsibility for final content. All authors read and approved the final manuscript.
Funding sources: NIH grants R21 DK085406 and R01 DK 076608.
Footnotes
Supplementary information is available at JHH’s website.
Conflict of Interest
None of the authors have any conflicts of interest to declare.
References
- 1.Lim SS, Vos T, Flaxman AD, Danaei G, Shibuya K, Adair-Rohani H, et al. A comparative risk assessment of burden of disease and injury attributable to 67 risk factors and risk factor clusters in 21 regions, 1990-2010: a systematic analysis for the Global Burden of Disease Study 2010. Lancet. 2012;380(9859):2224–60. doi: 10.1016/S0140-6736(12)61766-8. [DOI] [PMC free article] [PubMed] [Google Scholar]
- 2.Cook NR, Cutler JA, Obarzanek E, Buring JE, Rexrode KM, Kumanyika SK, et al. Long term effects of dietary sodium reduction on cardiovascular disease outcomes: observational follow-up of the trials of hypertension prevention (TOHP) BMJ. 2007;334(7599):885–8. doi: 10.1136/bmj.39147.604896.55. [DOI] [PMC free article] [PubMed] [Google Scholar]
- 3.He FJ, MacGregor GA. Effect of longer-term modest salt reduction on blood pressure. The Cochrane Database of Systematic Reviews. 2004;(3) doi: 10.1002/14651858.CD004937. CD004937. [DOI] [PubMed] [Google Scholar]
- 4.Appel LJ, Frohlich ED, Hall JE, Pearson TA, Sacco RL, Seals DR, et al. The importance of population-wide sodium reduction as a means to prevent cardiovascular disease and stroke: a call to action from the American Heart Association. Circulation. 2011;123(10):1138–43. doi: 10.1161/CIR.0b013e31820d0793. [DOI] [PubMed] [Google Scholar]
- 5.Cook NR, Obarzanek E, Cutler JA, Buring JE, Rexrode KM, Kumanyika SK, et al. Joint effects of sodium and potassium intake on subsequent cardiovascular disease: the Trials of Hypertension Prevention follow-up study. Arch Int Med. 2009;169(1):32–40. doi: 10.1001/archinternmed.2008.523. [DOI] [PMC free article] [PubMed] [Google Scholar]
- 6.Whelton PK, He J, Cutler JA, Brancati FL, Appel LJ, Follmann D, et al. Effects of oral potassium on blood pressure. Meta-analysis of randomized controlled clinical trials. JAMA. 1997;277(20):1624–32. doi: 10.1001/jama.1997.03540440058033. [DOI] [PubMed] [Google Scholar]
- 7.US Department of Agriculture and US Department of Health and Human Services. Dietary Guidelines for Americans, 2010. 7. Washington, DC: US Government Printing Office; 2010. [Google Scholar]
- 8.Centers for Disease C, Prevention. Usual sodium intakes compared with current dietary guidelines --- United States, 2005-2008. MMWR Morb Mortal Wkly Rep. 2011;60(41):1413–7. [PubMed] [Google Scholar]
- 9.Drewnowski A, Maillot M, Rehm C. Reducing the sodium-potassium ratio in the US diet: a challenge for public health. Am J Clin Nutr. 2012;96(2):439–44. doi: 10.3945/ajcn.111.025353. [DOI] [PMC free article] [PubMed] [Google Scholar]
- 10.IOM (Institute of Medicine) Strategies to Reduce Sodium Intake in the United States. Washington, DC: The National Academies Press; 2010. [DOI] [PMC free article] [PubMed] [Google Scholar]
- 11.Anderson CA, Appel LJ, Okuda N, Brown IJ, Chan Q, Zhao L, et al. Dietary sources of sodium in China, Japan, the United Kingdom, and the United States, women and men aged 40 to 59 years: the INTERMAP study. J Am Diet Assoc. 2010;110(5):736–45. doi: 10.1016/j.jada.2010.02.007. [DOI] [PMC free article] [PubMed] [Google Scholar]
- 12.Brown IJ, Tzoulaki I, Candeias V, Elliott P. Salt intakes around the world: implications for public health. Int J Epidemiol. 2009;38(3):791–813. doi: 10.1093/ije/dyp139. [DOI] [PubMed] [Google Scholar]
- 13.Beauchamp GK, Stein LJ. Salt taste. In: Basbaum AI, editor. The senses: A comprehensive reference 6 vols. Vol. 4. New York: Elsevier; 2008. pp. 401–408. [Google Scholar]
- 14.Dietary Guidelines Advisory Committee. Report of the Dietary Guidelines Advisory Committee on the Dietary Guidelines for Americans, 2010, to the Secretary of Agriculture and the Secretary of Health and Human Services. Washington, DC: US Department of Agriculture, Agricultural Research Service; 2010. [Google Scholar]
- 15.Drewnowski A. The cost of US foods as related to their nutritive value. Am J Clin Nutr. 2010;92(5):1181–8. doi: 10.3945/ajcn.2010.29300. [DOI] [PMC free article] [PubMed] [Google Scholar]
- 16.Monsivais P, Aggarwal A, Drewnowski A. Following federal guidelines to increase nutrient consumption may lead to higher food costs for consumers. Health Aff (Millwood) 2011;30(8):1471–7. doi: 10.1377/hlthaff.2010.1273. [DOI] [PMC free article] [PubMed] [Google Scholar]
- 17.Kaplan GA, Keil JE. Socioeconomic factors and cardiovascular disease: a review of the literature. Circulation. 1993;88(4 Pt 1):1973–98. doi: 10.1161/01.cir.88.4.1973. [DOI] [PubMed] [Google Scholar]
- 18.Mensah GA, Mokdad AH, Ford ES, Greenlund KJ, Croft JB. State of disparities in cardiovascular health in the United States. Circulation. 2005;111(10):1233–41. doi: 10.1161/01.CIR.0000158136.76824.04. [DOI] [PubMed] [Google Scholar]
- 19.Centers for Disease Control and Prevention. [February 15, 2012];National Health and Nutrition Examination Survey. MEC In-person dietary interviewers procedures manual. 2002 Jan; http://www.cdc.gov/nchs/data/nhanes/nhanes_01_02/dietary_year_3.pdf.
- 20.Rehm CD, Monsivais P, Drewnowski A. The quality and monetary value of diets consumed by adults in the United States. Am J Clin Nutr. 2011;94(5):1333–9. doi: 10.3945/ajcn.111.015560. [DOI] [PMC free article] [PubMed] [Google Scholar]
- 21.Carlson A, Lino M, Juan WY, Marcoe K, Bente L, Hiza HAB, Guenther PM, Leibtag E. Development of the CNPP Prices Database. Washington, DC: Center for Nutrition Policy and Promotion, US Dept of Agriculture; 2008. [Google Scholar]
- 22.National Cancer Institute. [December 14, 2011];Risk Factor Monitorting and Methods. Figure 1. List of specific foods: Result of grouping like foods reported in 2003-2006 NHANES. http://riskfactor.cancer.gov/diet/foodsources/food_groups/figure1.html.
- 23.Hoffmann K, Schulze MB, Schienkiewitz A, Nothlings U, Boeing H. Application of a new statistical method to derive dietary patterns in nutritional epidemiology. Am J Epidemiol. 2004;159(10):935–44. doi: 10.1093/aje/kwh134. [DOI] [PubMed] [Google Scholar]
- 24.Cogswell ME, Zhang Z, Carriquiry AL, Gunn JP, Kuklina EV, Saydah SH, et al. Sodium and potassium intakes among US adults: NHANES 2003-2008. Am J Clin Nutr. 2012;96(3):647–57. doi: 10.3945/ajcn.112.034413. [DOI] [PMC free article] [PubMed] [Google Scholar]
- 25.Monsivais P, Rehm CD, Drewnowski A. The DASH diet and diet costs among ethnic and racial groups in the United States. JAMA Internal Medicine. 2013;173(20):1922–4. doi: 10.1001/jamainternmed.2013.9479. [DOI] [PMC free article] [PubMed] [Google Scholar]
- 26.American Heart Association. [August 9, 2012];Potassium and High Blood Pressure. http://www.heart.org/HEARTORG/Conditions/HighBloodPressure/PreventionTreatmentofHighBloodPressure/Potassium-and-High-Blood-Pressure_UCM_303243_Article.jsp.
- 27.Monsivais P, Perrigue MM, Adams SL, Drewnowski A. Measuring diet cost at the individual level: a comparison of three methods. Eur J Clin Nutr. 2013;67(11):1220–5. doi: 10.1038/ejcn.2013.176. [DOI] [PMC free article] [PubMed] [Google Scholar]
- 28.Glanz K, Basil M, Maibach E, Goldberg J, Snyder D. Why Americans eat what they do: taste, nutrition, cost, convenience, and weight control concerns as influences on food consumption. J Am Diet Assoc. 1998;98(10):1118–26. doi: 10.1016/S0002-8223(98)00260-0. [DOI] [PubMed] [Google Scholar]
- 29.Waterlander WE, Steenhuis IH, de Boer MR, Schuit AJ, Seidell JC. The effects of a 25% discount on fruits and vegetables: results of a randomized trial in a three-dimensional web-based supermarket. The International Iournal of Behavioral Nutrition and Physical Activity. 2012;9:11. doi: 10.1186/1479-5868-9-11. [DOI] [PMC free article] [PubMed] [Google Scholar]
- 30.Ni Mhurchu C, Blakely T, Jiang Y, Eyles HC, Rodgers A. Effects of price discounts and tailored nutrition education on supermarket purchases: a randomized controlled trial. Am J Clin Nutr. 2010;91(3):736–47. doi: 10.3945/ajcn.2009.28742. [DOI] [PubMed] [Google Scholar]
- 31.Geliebter A, Ang IY, Bernales-Korins M, Hernandez D, Ochner CN, Ungredda T, et al. Supermarket discounts of low-energy density foods: effects on purchasing, food intake, and body weight. Obesity. 2013;21(12):E542–8. doi: 10.1002/oby.20484. [DOI] [PubMed] [Google Scholar]
- 32.Griffith R, O’Connell M, Smith K. IFS Briefing Note. Institute for Fiscal Studies; London: Food expenditure and nutritional quality over the great recession. document number BN143. [Google Scholar]
- 33.Bernstein AM, Bloom DE, Rosner BA, Franz M, Willett WC. Relation of food cost to healthfulness of diet among US women. Am J Clin Nutr. 2010;92(5):1197–203. doi: 10.3945/ajcn.2010.29854. [DOI] [PMC free article] [PubMed] [Google Scholar]
- 34.Townsend MS, Aaron GJ, Monsivais P, Keim NL, Drewnowski A. Less-energy-dense diets of low-income women in California are associated with higher energy-adjusted diet costs. Am J Clin Nutr. 2009;89(4):1220–6. doi: 10.3945/ajcn.2008.26916. [DOI] [PubMed] [Google Scholar]
- 35.Monsivais P, Aggarwal A, Drewnowski A. Are socio-economic disparities in diet quality explained by diet cost? J Epidemiol Community Health. 2012;66(6):530–5. doi: 10.1136/jech.2010.122333. [DOI] [PMC free article] [PubMed] [Google Scholar]
- 36.Mozaffarian D, Afshin A, Benowitz NL, Bittner V, Daniels SR, Franch HA, et al. Population approaches to improve diet, physical activity, and smoking habits: a scientific statement from the American Heart Association. Circulation. 2012;126(12):1514–63. doi: 10.1161/CIR.0b013e318260a20b. [DOI] [PMC free article] [PubMed] [Google Scholar]
Associated Data
This section collects any data citations, data availability statements, or supplementary materials included in this article.