Abstract
Cathodic reactions in biofilms employed in sediment microbial fuel cells is generally studied in the bulk phase. However, the cathodic biofilms affected by these reactions exist in microscale conditions in the biofilm and near the electrode surface that differ from the bulk phase. Understanding these microscale conditions and relating them to cathodic biofilm performance is critical for better-performing cathodes. The goal of this research was to quantify the variation in oxygen, hydrogen peroxide, and the pH value near polarized surfaces in river water to simulate cathodic biofilms. We used laboratory river-water biofilms and pure culture biofilms of Leptothrix discophora SP-6 as two types of cathodic biofilms. Microelectrodes were used to quantify oxygen concentration, hydrogen peroxide concentration, and the pH value near the cathodes. We observed the correlation between cathodic current generation, oxygen consumption, and hydrogen peroxide accumulation. We found that the 2e− pathway for oxygen reduction is the dominant pathway as opposed to the previously accepted 4e− pathway quantified from bulk-phase data. Biofouling of initially non-polarized cathodes by oxygen scavengers reduced cathode performance. Continuously polarized cathodes could sustain a higher cathodic current longer despite contamination. The surface pH reached a value of 8.8 when a current of only −30 μA was passed through a polarized cathode, demonstrating that the pH value could also contribute to preventing biofouling. Over time, oxygen-producing cathodic biofilms (Leptothrix discophora SP-6) colonized on polarized cathodes, which decreased the overpotential for oxygen reduction and resulted in a large cathodic current attributed to manganese reduction. However, the cathodic current was not sustainable.
Keywords: cyclic voltammetry, electrochemistry, electron transfer, fuel cells, oxygen
Introduction
The oxygen reduction reaction (ORR) is the primary source of cathodic current used by sediment microbial fuel cells (SMFCs). Combined with electrochemical reactions inside the sediment at an anode, SMFCs can generate usable power.[1] However, the power that is generated is typically small relative to traditional power sources. For SFMCs in which the power is limited by the cathode,[2] one way to enhance the power generated is to use biocathodes.[3] Biocathodes utilize micro-organisms to facilitate ORR or generate cathodic reactants available to the electrode. Biofilms, such as Leptothrix discophora, that generate oxidized manganese, a cathodic reactant that increases cathodic current, are known examples of cathodic biofilms used in biocathodes.[4] Although there is interest in using biocathodes, little is known about the variations in oxygen concentration, hydrogen peroxide concentration, and pH value near cathode surfaces during ORR. Knowledge of these variations could improve our mechanistic understanding of the limitations of cathodic reactions in SMFCs, how they impact the cathodic biofilms, and their sustainability leading to potentially better-performing cathodes.
Micro-organisms have been shown to increase or decrease the cathodic current in microbial fuel cells (MFCs) and polarized cathodes on both stainless steel and graphite.[3b, 5] Yet there is no clear consensus on the exact mechanism of microbial catalysis of ORR.[5a] One study did not observe microbial catalysis of ORR or found that biofilms on the cathode hindered cathode performance.[6] Other studies observed increased cathode performance.[3a,c,d,f] Often, it is believed that inoculating with the correct selection of micro-organisms determines the development and performance of biocathodes. Because the results are often dependent on experimental conditions, cathode limitations associated with ORR at neutral pH may be easier to address by using precious metal electrocatalysts (i.e., Pt) or increasing the cathode surface area until the performance of MFCs becomes limited by the anode.[1b, 7] Such options may not be viable for all MFC applications. Biocathodes are a promising alternative simply because the formation of biofilms on cathodic surfaces is a natural process and providing the correct conditions to promote microbial catalysis of ORR is the only requirement. Finding these conditions is dependent upon understanding the microscale conditions inside these biofilms, which have not been explored yet.
Herein, the cathodic reaction studied is the ORR. Generally, cathodes in SMFCs consist of cheap noncatalyzed carbonaceous materials, such as graphite or carbon fibers.[7a] Therefore, ORR leads to the production of hydrogen peroxide, a side reaction known to occur in MFCs.[8] For our purposes, we consider the following reaction in Equation (1), in which oxygen is directly reduced to hydrogen peroxide. A secondary reaction is shown in Equation (2), in which hydrogen peroxide could be further reduced to water. We refer to Equation (1) as the 2e− pathway and to the combination of both Equation (1) and (2) as the 4e− pathway.
| (1) |
| (2) |
From Equations (1) and (2), we expect that, if ORR occurs at cathodes in the absence of cathodic biofilms, hydrogen peroxide will tend to accumulate and the pH value near the cathode surface will increase.
Although ORR at cathodes in MFCs and SMFCs has been described previously,[3a] there is a lack of direct comparison between cathodic current production and oxygen flux towards cathode surfaces. The lack of relevant data has often led to the speculation and assumption that ORR proceeds directly through the direct 4e− pathway. Several reports have ignored the potential for hydrogen peroxide to exist within their systems. [3d,e,7c,9] Despite the fact that the generation of hydrogen peroxide can be ignored under certain circumstances, it has already been shown to be a major factor in delaying biofilm growth on stainless steel.[10] The presence of hydrogen peroxide on biocathodes could help explain increases or decreases in biocathode performance. Thus, it is critical to quantify the role of hydrogen peroxide for biocathodes that utilize ORR catalyzed by cathodic biofilms. Herein, we directly measured the generation of hydrogen peroxide near cathodes. Because such changes are often undetectable in the bulk, microscale measurements near cathode surfaces are necessary to understand such a dynamic system and the reaction mechanisms involved.
The goal was to quantify the variation in oxygen, hydrogen peroxide, and pH value near polarized surfaces in river water and simulate cathodic biofilms. These freshwater cathodic biofilms were grown in the laboratory. Well-known oxygen microelectrodes and modified hydrogen peroxide and pH microelectrodes were used to quantify oxygen concentration, hydrogen peroxide concentration, and pH value near polarized electrodes. We also grew Leptothrix discophora SP-6 biofilms, known to facilitate cathodic reaction mechanisms in microbial fuel cells. This allowed us to generate data demonstrating microbial catalysis of ORR through the presence of biogenic manganese in a defined system and compare them with the cathodic response in freshwater cathodic biofilms.
Results and Discussion
The experimental results presented herein took two years to obtain with replicates. The microelectrode measurements were performed at least three times at different locations leading to identical conclusions; we show selected representative measurements. We first present combined microelectrode measurements with cyclic voltammetry (CV) to correlate cathodic current with ORR. These combined measurements are termed stationary profiles of either oxygen or hydrogen peroxide. Stationary profiles show the variation of oxygen or hydrogen peroxide near the electrode surface as the electrode potential was changed. We then quantified stationary profiles in biofilms of L. discophora SP-6 to demonstrate a known microbial catalysis of ORR through biogenic manganese. Similarly, stationary profiles were quantified for the characterization of ORR in river-water biofilms formed naturally, which we also refer to as cathodic biofilms. This revealed the ORR mechanism in the presence of cathodic biofilms. In some selected cases we also quantified how oxygen and/or hydrogen peroxide concentrations changed with the distance from the bottom of the biofilm or from the surface of the electrode. These measurements showing concentration versus distance are termed depth profiles. They are used to compare the steady-state transport of oxygen, hydrogen peroxide, and protons from the bulk to the cathode surface. The depth profiles of hydrogen peroxide, or oxygen, or pH value reveal the differences in chemistry between bulk and near surfaces and allowed us to determine reaction mechanisms near the electrode surface, which were not possible to determine in the bulk phase.
The biofilms and microelectrode experiments were all grown/measured inside a continuous open-channel flat-plate reactor with recycle, modified slightly to insert electrodes at the base of the open channel. The microelectrode measurements were performed under operating conditions (i.e., while biofilms generated cathodic current). Fresh river water was obtained every other day without modification for the biofilm reactor. Over time, suspended solids tended to settle onto the cathodic surfaces/biofilms. During weeks of heavy rain, the amount of suspended solids increased, whereas in dry weather the amount of suspended solids decreased. We considered this deposition as part of the natural biofilm process and, as such, refer to them collectively (cells + settled solids) as biofilm. However, because the result of this deposition was generally negative for biocathodes studied herein, we refer to it as contamination. Information on river-water constituents can be found in the Supporting Information.
Relating cathodic current to oxygen reduction
One of the difficulties working in open environments with electrochemical methods is to confirm that the cathodic current originates from a particular cathodic reactant. For biocathodes, it is necessary to directly relate the cathodic current to a cathodic reactant to elucidate cathode reaction mechanisms. In our case, to relate the increase in cathodic current with ORR reactions near the surface, we placed oxygen and hydrogen peroxide microelectrodes at a distance of 100 μm from the surface and measured their respective local concentrations. Figure 1A and B shows that the onset of oxygen consumption, hydrogen peroxide generation, and cathodic current was at approximately −180 mVAg/AgCl. Consecutive CV spectra also showed that cathodic current only decreased when the oxygen concentration reached a value of <4 mgL−1 (results not shown), although this may be specific to our system. That suggested that a stable CV spectrum could not predict the oxygen concentration near the cathode surface because there was a net change (ΔO2, Figure 1C). The detection of hydrogen peroxide near the cathode surface also verified that Equation (1) was occurring. The decrease in oxygen concentration (2.4 mgL−1, 75 μM) and increase in hydrogen peroxide concentration (80 μM) corresponded approximately to the stoichiometry in Equation (1). Not only was this confirmatory of ORR in Equation (1), but also implied that Equation (1) was the predominant pathway. By plotting oxygen concentration versus current (Figure 1C) and hydrogen peroxide concentration versus current (Figure 1D), a straight line and a parabola-like curve were observed, respectively. Thus, ORR appeared to be a first-order response, in which the reaction rate (current) was linearly related to oxygen concentration by a constant of 0.0146 mgL−1 μA−1 (red regression line in Figure 1C); this conclusion applies only under our experimental conditions as the trend may become nonlinear under different conditions, such as low oxygen concentrations, when diffusion becomes important. Further reduction of hydrogen peroxide displayed a more complex relationship, probably caused by side reactions with unknown chemicals in river water. For example, trace metals such as copper or iron tend to promote decomposition of hydrogen peroxide, whereas calcium and magnesium cations tend to stabilize hydrogen peroxide in solution.[11] Other potential factors include the role of light-related reactions, although any interference from diatoms was minimized because these experiments were run for newly placed electrodes. However, both Figure 1B and C show that without electrode polarization (more negative than −180 mVAg/AgCl) hydrogen peroxide was not detected near the cathode surfaces, which confirmed that any other sources or sinks of hydrogen peroxide were transient, subsequently having minimal impact on our measurements. To ensure that ORR was the predominant source of hydrogen peroxide, we chose a more negative polarization potential of −700 mVAg/AgCl; the faradaic current was thus several orders of magnitude higher than the background (nonfaradaic) current.
Figure 1.
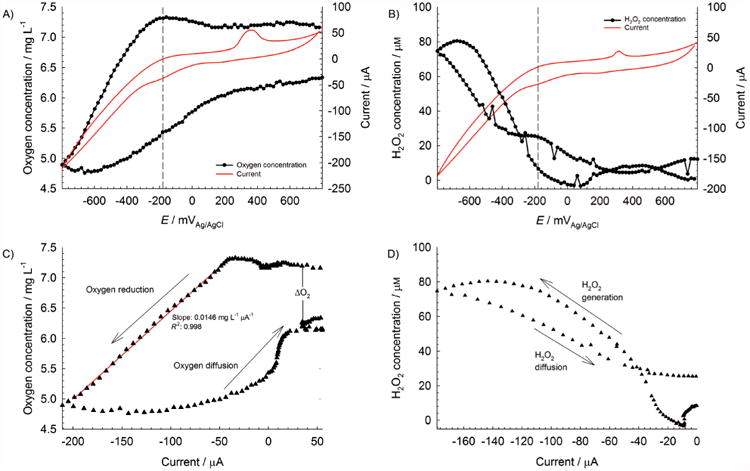
Stationary profiles at t = 0 d of A) oxygen and B) hydrogen peroxide at an initially unpolarized cathode (fresh electrode); plots of C) oxygen concentration versus current; and D) hydrogen peroxide concentration versus current derived from CV spectra and stationary profiles. The dashed lines of both (A) and (B) are centered at −180 mVAg/AgCl. Red trace in C) is a linear regression fit.
By relating both ORR and cathodic current, we were able to monitor the effect of introducing a known cathodic biofilm into our system. In our case, we grew a L. discophora SP-6 biofilm on an initially unpolarized cathode (see the Supporting Information, Figure SI-1). Briefly, manganese-oxidizing bacteria (MOB) colonizing cathodes formed biofilms that deposited biomineralized manganese oxides onto the cathode surfaces. Over time, the manganese oxides accumulated on the cathode surface and inside the biofilm. Manganese oxides could then be electrochemically reduced through a two-step two-electron reduction as follows:
| (3) |
| (4) |
where the overall reaction was:
| (5) |
The soluble manganese ions were then regenerated inside the biofilm, where they were reoxidized to manganese oxides, which continued the cycle indefinitely. After a steady open-circuit potential value was reached, we measured stationary profiles similar to Figure 1C. Relative to initial CV spectra without biofilm, CV spectra with L. discophora SP-6 biofilms exhibited a large cathodic current at more positive potentials (−240 μA at −40 mVAg/AgCl, Figure 2). Additionally, the onset of ORR began at approximately −40 mVAg/AgCl. The large cathodic current at more positive potentials could be attributed to the discharge of accumulated manganese oxides deposited on the electrode surface by the biofilm. A comparison of CV spectra in the absence and presence of a biofilm (scan 1 or scan 2) in Figure 2 shows that ORR catalysis is associated with a decrease in overpotential (in this case 160 mV). This form of manganese-catalyzed ORR has been shown previously for nonbiogenic manganese.[12] The presence of manganese was catalytic towards ORR[13] as previously observed in microbial catalysis of ORR.[3a] However, the term “discharge” is purposefully used in this case because the cathodic current was not sustainable. For CV scan 2 (Figure 2), the cathodic current attributed to manganese oxide reduction decreased to about 15% of its original value at 0 VAg/AgCl. The inability of the biofilm to regenerate the cathodic current highlighted a potential weakness of manganese-catalyzed biocathodes: sustainability. The rate of manganese oxide deposition by L. discophora SP-6 could not sustain the initial current and suggested that continuous energy harvesting may be less efficient than more adaptive energy-harvesting techniques, such as intermittent energy harvesting.[14] It could be argued, however, that the cathodic current was still 20 times larger than it was in the absence of a biofilm (scan 2 in Figure 2) and that the overpotential was reduced. This observation demonstrated an important facet of cathodic biofilm behavior that can either increase ORR rate, decrease overpotential, or generate a cathodic reactant, such as manganese, to enhance cathode performance.
Figure 2.
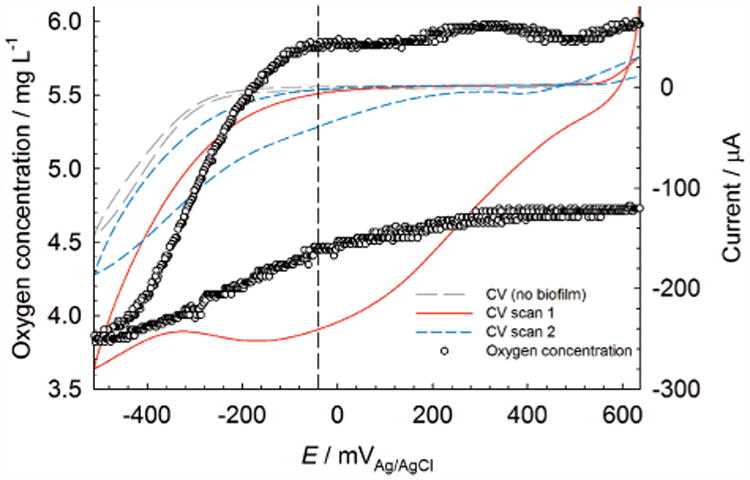
Stationary profile of oxygen at a glassy carbon electrode with L. discophora SP-6 grown on the surface. The dashed line is centered at −40 mVAg/AgCl.
Colonization of the cathode surface over time
Because our flat-plate reactors were fed with fresh river water without modification, they also contained a significant amount of suspended solids. In all experimental runs, the suspended solids contaminated the cathode surfaces (Figure 3, non-polarized cathodes at various stages of contamination). At day 4, the cathode surface could still be seen. By day 20 and day 94, the cathode surface was barely visible. Within the layer forming on the cathode surfaces, SEM imaging showed various micro-organisms scattered intermittently along the available surfaces. In particular, Figure 3 shows that diatoms (inset, red squares) were predominant, with smaller bacteria (white circles) being sparsely observed. The observation was consistent with previous reports;[15] the large structure in the image is a diatom and the inset red squares are cutouts from similar images at different locations on the cathode surface. In most cases, bacteria appeared on the diatoms. The presence of primarily diatoms on the surfaces of the cathodes suggested that they could increase cathodic current through oxygen reduction by generating oxygen near the electrode surface. Energy dispersive spectroscopy (EDS) analysis of similar cathode surfaces has been previously reported.[9b] Renslow et al. showed the presence of silicon, aluminum, iron, oxygen, magnesium, and calcium.[9b] EDS analysis of these cathodes showed nearly identical results (see the Supporting Information, Figure SI-2). Thus, cathodes were spontaneously colonized by multiple micro-organisms to form what we call river-water biofilms.
Figure 3.
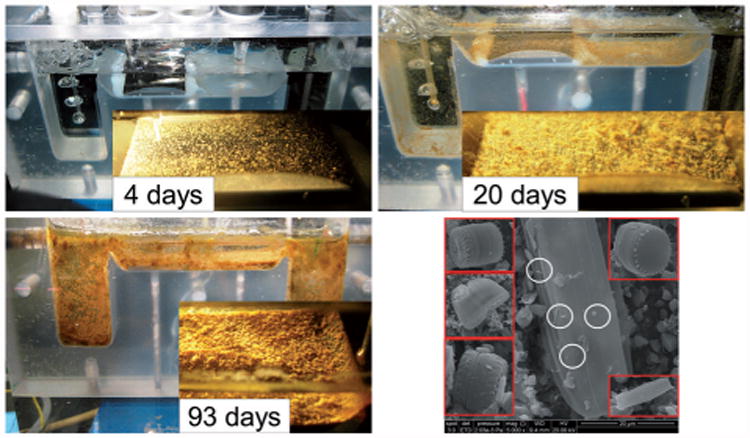
Selected images of cathodes during different stages of contamination. The inset red squares in the SEM image (right bottom; scale bar corresponds to 20 μm) are diatoms found at different locations. The white circles indicate bacteria colonizing the diatom surface.
Role of biofouling on oxygen reduction
Initially, the cathodes studied herein were unpolarized for an extended period of time. They were only polarized to characterize ORR. The rate of oxygen consumption was characterized by measuring oxygen depth profiles from 1000 to within 100 μm of the cathode surface. Figure 4A shows the oxygen depth profiles at unpolarized cathodes for times t=0 and 23 d under unpolarized conditions and at −700 mVAg/AgCl. At t=0, the oxygen concentration was 8.8 mgL−1 and remained constant towards the cathode surface under unpolarized conditions. At −700 mVAg/AgCl, the oxygen concentration decreased to 0.5 mgL−1 from the bulk. At t=23 d, the oxygen concentration had decreased to 2.2 mgL−1 at 100 μm from the cathode surface under unpolarized conditions. As expected, the oxygen concentration decreased near the cathode surface as the polarization potential decreased: the oxygen concentration was below the detection limit at −700 mVAg/AgCl at 100 μm from the cathode surface. When comparing the oxygen depth profiles under unpolarized conditions at t=0 and 23 d, one possible conclusion was that oxygen was consumed by micro-organisms; that is, biofouling.
Figure 4.
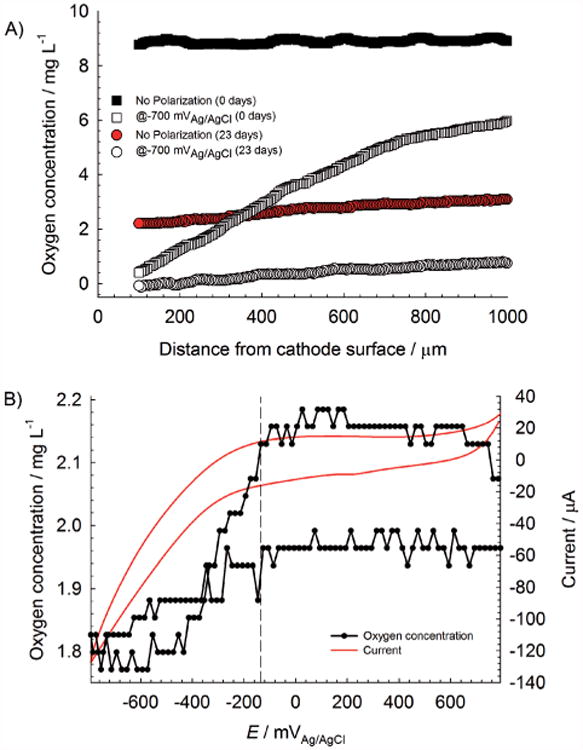
A) Comparison of oxygen depth profiles at an initially unpolarized cathode at t=0 and 23 d; B) stationary profile of oxygen at an initially unpolarized cathode at t=23 d. The dashed line is centered at −135 mVAg/AgCl.
Figure 4B shows a trend nearly identical to that in Figure 1A except that both the current and the oxygen concentration are lower because of biofouling. The onset of ORR was estimated at −135 mVAg/AgCl, which indicated a decrease in overpotential by 45 mV from −180 mVAg/AgCl in Figure 1A. However, that change was not as substantial as that observed in Figure 2, in which the overpotential for ORR decreased by 160 mV. In the present study, the spontaneous colonization of the cathode surface by oxygen scavengers reduced the cathode performance. We expected that the presence of oxygen-producing diatoms would have enhanced the cathodic current by generating oxygen near the cathode surface. However, contrary to this expectation and to what is shown in Figure 2, the biofouled cathodes did neither generate an increased cathodic current nor exhibit manganese-like characteristics of enhanced ORR or cathodic current at more positive polarization potentials. In other words, river-water biofilms formed on initially unpolarized cathodes were not acting as cathodic biofilms that enhance cathode performance. If oxygen was produced by the observed diatoms in Figure 3, the oxygen was most probably consumed by oxygen scavengers.
Utilizing hydrogen peroxide generated in Equation (1) can be an effective way to treat biofouling of cathodes. Figure 1B predicts the accumulation of hydrogen peroxide at cathode surfaces resulting in a steady-state depth profile. This accumulation is difficult to detect because the hydrogen peroxide concentration in the bulk can drop below the detection limits for most assays. Figure 5 shows that hydrogen peroxide with a concentration of at least 80 μM accumulated at a height of 100 μm from the cathode surface. This is a significant concentration that has been shown to delay contamination.[10] Continuous polarization or closed-circuit acclimatization is commonly believed to promote colonization of electrochemically active biofilms on cathodes by providing an electron source. However, hydrogen peroxide accumulation may be an alternative explanation as to why continuous polarization or continuous generation of a cathodic current leads to robust cathode performance. Simply, polarization initially reduces and delays biofouling. The 1:1 stoichiometric ratio in Equation (1) also predicts that maintaining a high cathodic current density would enhance the effect. A high cathodic current density can be maintained by decreasing the effective cathode surface area, contrary to what is traditionally done to alleviate cathodic limitations. In the case of anode-limited MFCs or SMFCs, the cathode surface area could be decreased until it becomes cathode-limited. This increases the cathodic current density. However, there is a trade-off because decreasing the cathode surface area could also increase overpotentials associated with mass transport of oxygen as shown previously.[3e,7c] Essentially, cathodes with large surface areas minimize mass-transfer limitations.
Figure 5.
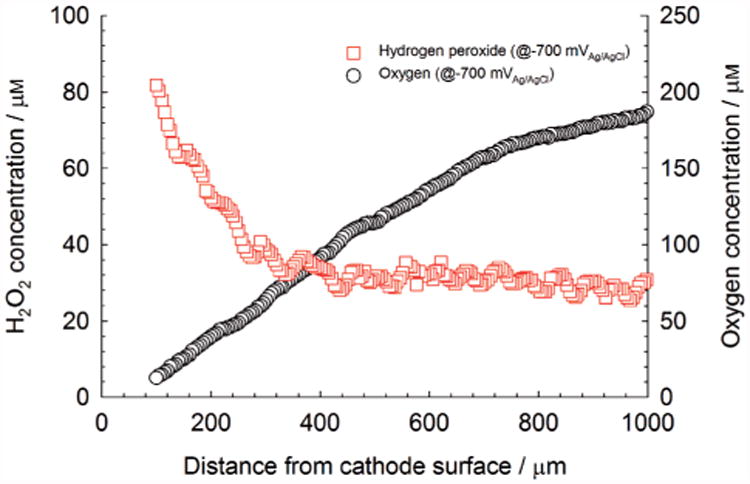
Hydrogen peroxide depth profiles at t=0 d above an initially unpolarized cathode.
Effect of long-term polarization
To assess the role of hydrogen peroxide and continuous polarization, we initially and continuously polarized a cathode at −700 mVAg/AgCl for an extended period of time. The accumulation of hydrogen peroxide was expected to reduce biofouling. Figure 6A shows that near the surface of the cathode the oxygen concentration remained at a nonzero level of approximately 2.5 mgL−1, relative to a bulk value of 4.3 mgL−1. Unlike the oxygen depth profile for the unpolarized cathode at t=0 in Figure 4A, which shows a continuous decrease in oxygen concentration, Figure 6A shows distinct layers. From 800 to 600 μm from the electrode surface, the change in oxygen concentration was negligible; this layer was considered the bulk. From 600 to 260 μm from the electrode surface, there was a linear decrease in oxygen concentration with a slope of 3.27 ×10⁻³ mgL−1 μm−1 (R2 = 0.995); this was considered the river-water layer. From 260 to 40 μm from the surface, there was a linear decrease in oxygen concentration with a slope of 1.74×10⁻³ mgL−1 μm−1 (R2 = 0.990) that we considered the biofilm. Right at the surface of the cathode, there was a sharp decrease in oxygen concentration with an approximate slope of 1.79×10⁻² mgL−1 μm−1 (R2 = 0.979); this was considered as the reaction layer near the electrode surface. Because the slope inside of these layers was proportional to the flux of oxygen through the zone, the decrease in slope from the river-water layer to the biofilm showed the blocking effect of the cathodic biofilms. The decreased oxygen flux also implied that the microbial consumption of oxygen was minimal in the biofilm relative to consumption by the electrode.
Figure 6.
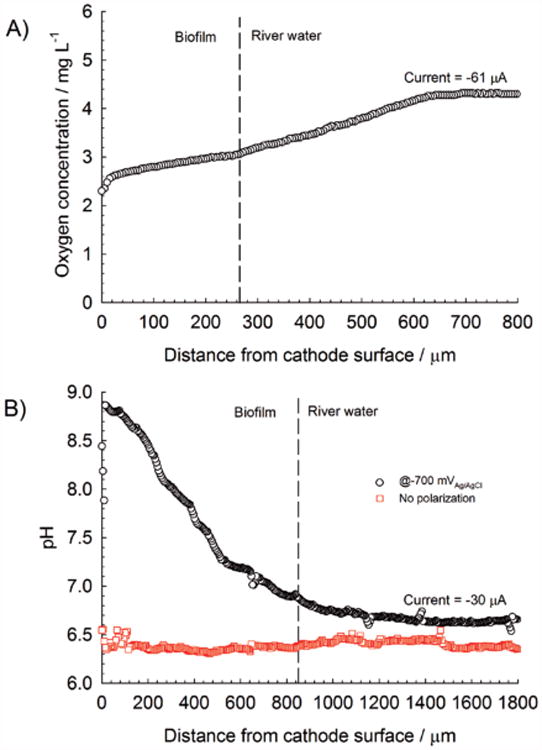
A) Oxygen depth profile of a cathode after 19 d of continuous polarization at −700 mVAg/AgCl; B) pH depth profile of the same polarized cathode after 25 d. For comparison, a pH depth profile of an initially unpolarized cathode is shown. Dashed lines represent the approximate biofilm/river-water interface.
Figure 6B shows an increase in the pH value for the polarized cathode, from 6.6 in the bulk to 8.8 near the electrode surface. The net increase of 2.2 pH units represents an approximate 100-fold decrease in proton concentration, which severely restricts cathodic-current generation. By comparison, we had previously measured a pH change of 0.9 pH units in a similar system while passing a current of −1.85 mA (electrode type and geometry were the same).[16] Thus, a pH change of 2.2 pH units at a current of only −30 μA was a consequence of the severely underbuffered river water. We concluded that the constant polarization of cathodes in poorly buffered systems could also reduce biofouling because of high pH values. Another noteworthy observation was that bulk pH values far away from the polarized cathode surface (>1000 μm) were nearly identical to bulk pH values above the unpolarized cathode, highlighting the importance of microscale measurements over bulk measurements. Initial and continuous polarization of cathodes resulted in a reduction of biofouling or increased oxygen concentration above the cathode surface. Although the cathodic current was higher for a longer period of time, the effect was not permanent because the cathodic current eventually decreased over time (Figure 7A).
Figure 7.
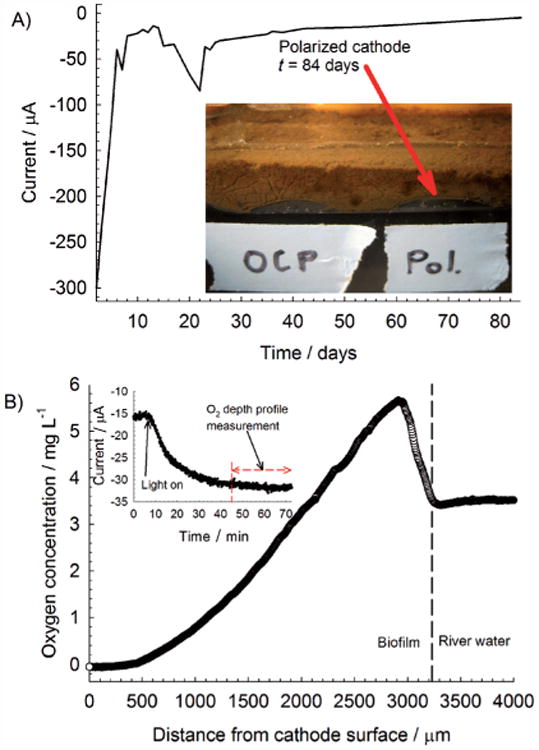
A) Current over time for a continuously polarized cathode at −700 mVAg/AgCl; B) oxygen depth profile at t=54 d inside the biofilm showing an increase in oxygen concentration near the biofilm/river-water interface.
Developing a cathodic biofilm naturally
Figure 7A shows that after 84 d, the current was reduced to only −5 μA, which was only 2% of the initial cathodic current at day 2. Subsequently, the amount of hydrogen peroxide produced decreased by the same fraction. Either the microbial consumption of oxygen or the restriction of oxygen diffusion was the cause. Regardless, the protection provided by continuous hydrogen peroxide generation and a high pH value was reduced. Interestingly, an oxygen-producing layer formed inside the biofilm rather than an oxygen-consuming layer. Figure 7B shows the oxygen concentration increasing at the top of the biofilm and then decreasing to zero at the biofilm/electrode interface. These increases in oxygen concentration were similar to oxygen depth profiles measured in layers of phototrophic oxygen-producing microbial mats.[17] In these microbial mats, oxygen depth profiles are typically supersaturated under illumination. In agreement with this observation, the increase in oxygen concentration was associated with an increase in current under illumination by a halogen lamp (100 W) directed toward the biofilm/river-water interface. Notably, no light-dependent current was observed when depth profiles were taken at day 19 (Figure 6A). The current increased from −15 to −32 μA after the biofilm/river-water interface was illuminated. The time elapsed from the previous steady current to the increased steady current was approximately 1 h.
Landoulsi et al. proposed metabolic pathways that could explain how diatoms or possibly phototrophic bacteria interact with a conductive surface (stainless steel or electrode).[15] They proposed that: photosynthetic metabolism directly alters the physicochemical environment (mechanism 1); production of reactive oxygen species or other metabolic products influence electrochemical behavior of the surface (mechanism 2); photosynthetic metabolism indirectly stimulates nearby bacteria that influence the electrochemical behavior of the surface (mechanism 3).[15] Diatoms are suspected to play a major role in free ennoblement of stainless steel surfaces by altering local pH values and oxygen concentration near those surfaces. Thus, in our work, the increase in oxygen concentration was direct evidence of mechanism 1. The association of bacteria with diatoms (Figure 3) was indirect evidence of mechanism 3. Mechanism 2, however, was not conclusively observed.
Figure 7B shows the oxygen concentration at the electrode surface as nearly constant and zero, whereas Figure 6A shows a sharp decrease in oxygen concentration. The difference in trends could be ascribed to the effect of oxygen consumption by oxygen scavengers in the biofilm. Oxygen produced by the oxygen-producing layer was consumed by oxygen scavengers beneath and eventually by the cathode. Although complicated by an unknown cell density of oxygen producers and scavengers inside the biofilm, the slope of the oxygen depth profile in Figure 7B decreased from 2900 to 1500 μm was 2.78× 10⁻³ mgL−1 μm−1 (R2 = 0.999). The net flux of oxygen in this layer (1400 μm) was only slightly lower than that observed in the river-water layer calculated for Figure 6A. Thus, the presence of an oxygen-producing biofilm enhanced the net oxygen flux towards the electrode surface. However, the oxygen that diffused towards the electrode surface was quickly consumed, reducing the slope to nearly zero. Although river-water biofilms were producing oxygen that was then rapidly consumed within the biofilm, this oxygen was effectively unusable by the electrode and, therefore, did not improve cathodic current. Interspecies electron transfer through oxygen inside the biofilm would not affect cathodic current unless that electron transfer facilitated the production of another cathodic reactant that was: 1) available to the electrode and 2) could be reduced by the electrode. Because the CV spectrum presented in Figure 4B did not show significant current peaks other than the expected cathodic current related to ORR, we inferred that there were no other usable cathodic reactants produced from the river-water biofilm. In practical terms, the oxygen-producing layer was spatially too far from the cathode surface to take advantage of the increased flux of oxygen.
Conclusions
Herein, we demonstrated the effect of oxygen reduction on cathodic biofilms by relating oxygen, hydrogen peroxide, and pH value to cathodic current generation. A decrease in oxygen concentration of 75 μM at a height of 100 μm from the cathode surface produced hydrogen peroxide (80 μM), corresponding to the stoichiometry of the 2e− pathway. Therefore, oxygen reduction was shown to proceed directly to hydrogen peroxide and not completely to water. Future studies should account for the production of hydrogen peroxide. Unpolarized cathodes were observed to become biofouled, whereas polarized cathodes could be protected by hydrogen peroxide and high pH values. This provides an alternative explanation for higher cathodic currents; in this case polarization most probably delays biofouling rather than selecting indigenous bacteria. The presence of hydrogen peroxide and an elevated pH value of 8.8 were undetectable in the bulk solution, demonstrating the importance of microscale measurements in dynamic systems. There was no indication of microbial catalysis of oxygen reduction through a decreased overpotential or increased cathodic current in our river-water cathodic biofilms similar to that of manganese-oxidizing cathodic biofilms of L. discophora SP-6. In the long term, oxygen-producing cathodic biofilms that were light-sensitive could colonize polarized cathodes; however, they did so after the cathodic current had decreased substantially from −300 to − 15μA, which could reflect the suboptimal conditions created by oxygen reduction. Therefore, the accumulation of hydrogen peroxide and an increase in local pH values should be considered carefully for cathodes in SMFCs and aerobic biocathodes in general, even at low cathodic current densities (−4.7 to −15 μAcm−2). We have also demonstrated a new alternative technique using microelectrodes to determine the active pathway for oxygen reduction. Relative to the traditional use of the rotating ring disk electrodes, this alternative method enables direct measurement of oxygen and hydrogen peroxide concentrations near the electrode surface.
Experimental Section
Environmental cathodes and reactors
Glassy carbon electrodes (SPI-Glas #4370GCP-AB) were cleaned by sonication in hot 1 M HCl, followed by overnight exposure and thorough rinsing with water (18 MΩcm). Glassy carbon electrodes were glued to the bottom of custom-built polycarbonate flat plate reactors (25mm×25mm). For unpolarized cathodes, a single-chamber flat-plate reactor was used. For polarized cathodes, a dual-chamber flat-plate reactor was used to prevent contamination of electrochemically generated species at the counter electrode. Details of these reactors have been described previously[16,18] and are summarized in Figure 8. The reactor volume was 100 mL The feed dilution rate was 0.90 h−1.
Figure 8.
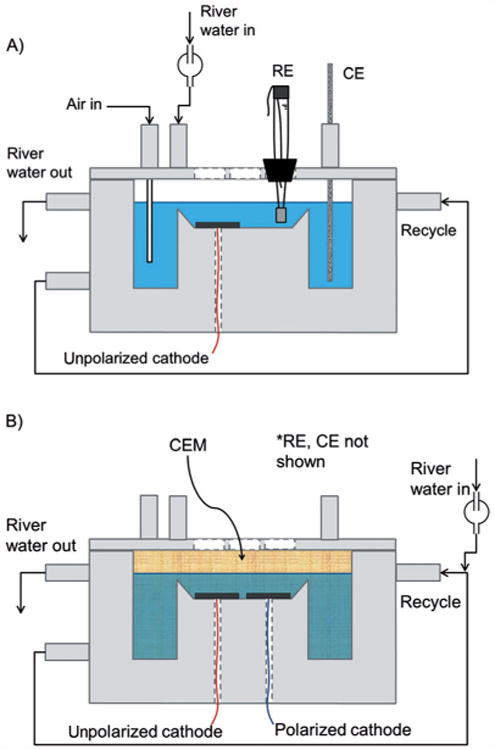
Side view of flat-plate reactors: A) single-chamber reactor used for unpolarized cathodes; B) dual-chamber reactor used for long-term polarized cathodes. One polarized cathode and one unpolarized cathode were placed adjacent to each other. The auxiliary chamber was isolated with a cation exchange membrane (CEM). The counter electrode (CE) and reference electrode (RE) were placed in the auxiliary chamber.
Operating the flat plate reactors
Water was obtained every other day from the Palouse River (South Fork, Pullman, WA) and was fed into the flat plate reactors without modification (constituents in river water are provided in the Supporting Information). Experiments were run on the lab bench at room temperature (22°C). River water was fed in through the top. A recycle line provided the channel flow across the cathode surface. Water level was maintained at a constant height through active effluent pumping. For unpolarized cathodes, the open-circuit potential (OCP) was monitored during reactor operation. For polarized cathodes, a custom-built multipotentiostat was used to apply a potential of −700 mVAg/AgCl and monitor the resulting cathodic current.[9b]
Measuring cathode performance
First, the cathodic current was measured. A potentiostat was then used to apply a potential of −700 mVAg/AgCl, and microelectrode measurements were taken to correlate cathodic currents with oxygen and hydrogen peroxide concentrations and pH values. For polarized cathodes, microelectrode measurements were taken during operation at steady state, so that the constantly measured cathodic current would not be affected. The control measurements were taken at an unpolarized cathode placed adjacent to the polarized cathode, making them as comparable as possible. The control measurements were taken while the unpolarized cathodes were disconnected (no cathodic current).
Microelectrodes
The hydrogen peroxide microelectrodes were constructed according to a literature procedure[19] with the exception that the hydrogen peroxide microelectrode was modified so that it could operate on polarized surfaces.[10,19] Briefly, for the hydrogen peroxide microelectrode, a platinum wire was encased in a glass capillary, which was pulled at a high temperature to seal the wire. The platinum tip was then exposed by grinding away the sealed tip using a diamond grinding wheel (Narishige, EG-4). The exposed tip was 10–15 μm in diameter. Platinum was electrochemically deposited onto the exposed platinum microelectrode tip, which resulted in a porous platinum ball that increased the effective surface area and consequently the sensitivity of the microelectrode. A cellulose acetate (5%, Sigma–Aldrich) membrane was then deposited on the platinum ball. The final tip diameter was about 20 μm. The hydrogen peroxide microelectrode was placed in a glass outer casing with the tip exposed to the solution. The glass junction was sealed with an agar (1.812 gL−1, R-2A Agar, Fluka) salt bridge containing 1 mm sodium sulfate (Fisher), and the outer case was filled with saturated KCl and Ag/AgCl reference filling solution (SP135–500, Fisher). An Ag/AgCl reference electrode was inserted into the glass outer casing. The procedure of Lewandowski and Beyenal for constructing the oxygen microelectrode was followed exactly.[19] The final tip diameter of the oxygen microelectrode was about 15 μm. The pH microelectrodes were potentiometric sensors that had a liquid ion-exchange membrane at the tip and were calibrated using standard buffer solutions (pH 4, 7, and 10) from ACROS Organic. The pH microelectrodes were constructed exactly as described by Babauta et al.[18]
Microelectrode measurements
The hydrogen peroxide and oxygen microelectrodes were amperometric sensors. Specifically, the oxygen microelectrode was a Clark-type microelectrode that operated similarly to the more common large oxygen probes. The silicone rubber membrane of the tip of the oxygen microelectrode was only permeable to gases. The gases in river water passed through the membrane and dissolved in the electrolyte solution. The gold cathode located next to the rubber membrane was operated at a potential so that oxygen could be reduced and the reduction current was a function of the dissolved oxygen concentration near the vicinity of the microelectrode tip. The use of gold as the cathode prevented the poisoning effect of sulfide gas if present.[19] The hydrogen peroxide microelectrode tip was covered with a cellulose acetate membrane that selectively passed H2O2 towards the Pt working electrode, where it was oxidized to oxygen and protons. The hydrogen peroxide microelectrode was calibrated in river-water solutions of known hydrogen peroxide concentration ranging from 0 to 150 μM. The calibration curve was always linear in this concentration range. The oxygen microelectrode was calibrated in a solution with zero oxygen concentration and in air-saturated river water. No spurious background currents were observed when placed in river water inside the biofilm reactors, indicating that the microelectrodes worked as expected without interference by river-water constituents. A Keithley 6517A electrometer/high-resistance meter was used as both the voltage source and a picoammeter. The hydrogen peroxide microelectrode was polarized to +600 mVAg/AgCl, and the oxygen microelectrode was polarized to −800 mVAg/AgCl. For pH microelectrode measurements, a Keithley 6517A electrometer/high-resistance meter was operated as a high-resistance meter. The potential difference was read between the pH microelectrode tip and the reference electrode. Each microelectrode was calibrated right before use, and the calibrations were also verified after the measurements. The use of traditional pH microelectrodes with a separate reference electrode did not operate properly under electrical current flow. For the measured pH values to be correct, the distance between reference and microelectrode tip must be constant and as small as practically possible. Thus, we developed and used new combined pH microelectrodes, the reference electrode of which moved in conjunction with the microelectrode tip.
Depth profiles
Before measurements, microelectrodes were positioned above the cathode. A computer-controlled micromanipulator was used to bring the microelectrode tip down into the reactor volume just above the cathode. The microelectrode was then positioned generally 1000 μm from the electrode surface and stepped down in increments of 5 μm using custom microprofiler software. The microelectrode tip and the surface of the cathode were located using a stereomicroscope (Zeiss Stemi 2000). During the measurement of each depth profile, the measured current was confirmed as steady.
Stationary profiles
Microelectrode measurements were combined with CV analyses to correlate ORR with cathodic currents. Prior to CV measurements, the microelectrode tip was positioned approximately 100μm above the cathode surface and held there for the duration of the experiment. Microelectrode measurements were taken prior to CV analyses to obtain a baseline. CV scans were then started at positive potentials (minimal oxygen reduction) and decreased to negative potentials (significant oxygen reduction) during microelectrode measurements. The microelectrode data-acquisition rate and the CV scan rate were aligned in such a way as to produce plots of either oxygen or hydrogen peroxide concentration against electrode potential. A diagram of the measurement technique is shown in Figure 9. The scan rate was 20 mVs−1.
Figure 9.
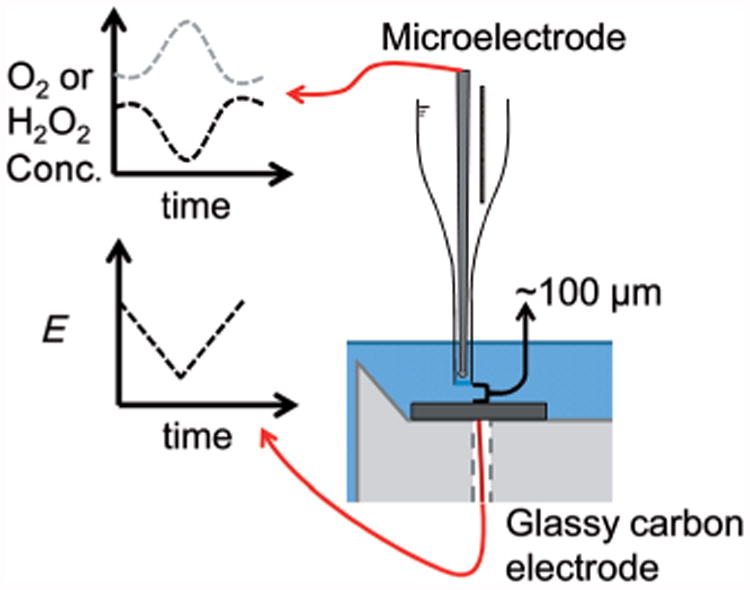
Oxygen or hydrogen peroxide stationary profiles. The potential is swept over a range, in which oxygen is reduced and the change in concentration is measured by the microelectrode.
Leptothrix discophora SP-6 biocathodes
L. discophora SP-6 biofilms were grown on glassy carbon electrodes according to Rhoads et al.[4] Briefly, stock cultures (1 mL) were taken from a freezer (−85 °C), thawed at room temperature, and added to a flask (100 mL) of a defined medium. The following components of the defined medium were dissolved in distilled water (900 mL): (NH4)2SO4 (0.24 g), MgSO4·7H2O (0.06 g), CaCl2·2 H2O (0.06 g), KH2PO4 (0.02 g), Na2HPO4·7H2O (0.06 g), and 2-[4-(2-hydroxyethyl)-1-piperazinyl]ethanesulfonic acid (HEPES, 2.383 g). The pH was then adjusted to a value of 7.2 by using NaOH or H2SO4. Afterwards, the solution was autoclaved at 121 °C for 15 min and allowed to cool to approximately 50°C. Finally, the following solutions were aseptically added: sodium pyruvate (1.0 mL, 20%), FeSO4 (1.0 mL, 10 mM), MnSO4·H2O (5.0 mL, 40 mM), and a vitamin solution (1.0 mL). The vitamin solution (1 L) consisted of biotin (20.0 mg), folic acid (20.0 mg), thiamine·HCl (50.0 mg), D-(+)-calcium pantothenate (50.0 mg), vitamin B12 (1.0 mg), riboflavin (50.0 mg), nicotinic acid (50.0 mg), pyridoxine·HCl (100.0 mg), and p-aminobenzoic acid (50.0 mg). The inoculum flask was kept on a shaker (100 rpm) at room temperature until visible dark brown flocs appeared. Then the inoculum (20 mL) was aseptically transferred to a sterile syringe with a needle and injected into a completely enclosed sterile single-chambered flat-plate reactor. Detailed information on this type of flat-plate reactor has been given previously.[16] The reactor was operated in batch mode until an increase in OCP was measured (typically 1–2 d). Then the reactor was operated continuously and biofilm growth was monitored. Once OCP reached a steady state, the reactor was opened for oxygen microelectrode measurements as described above.
Supplementary Material
Figure SI-1. Schematic diagram of manganese cycling inside biofilms of manganese-oxidizing bacteria.
Figure SI-2. EDS spectrum for the river cathode Protocols for EDS were followed from Renslow et al. 2011[1].
Acknowledgments
This work was supported by the U.S. Office of Naval Research (ONR), grant #N00014-09-1 0090. The authors gratefully acknowledge the financial support provided by the National Institutes of Health (NIH) Protein Biotechnology Training program, grant #T32-GM008336, for helping to fund J.T.B. The authors thank Akin Paksoy and Jessica Boyce for their help in conducting some of the experiments.
Footnotes
Supporting Information for this article is available on the WWW under http://dx.doi.org/10.1002/cssc.201300019.
References
- 1.a) Donovan C, Dewan A, Peng HA, Heo D, Beyenal H. J Power Sources. 2011;196:1171–1177. [Google Scholar]; b) He Z, Shao HB, Angenent LT. Biosens Bioelectron. 2007;22:3252–3255. doi: 10.1016/j.bios.2007.01.010. [DOI] [PubMed] [Google Scholar]; c) Reimers CE, Tender LM, Fertig S, Wang W. Environ Sci Technol. 2001;35:192–195. doi: 10.1021/es001223s. [DOI] [PubMed] [Google Scholar]
- 2.Menicucci J, Beyenal H, Marsili E, Veluchamy RA, Demir G, Lewan-dowski Z. Environ Sci Technol. 2006;40:1062–1068. doi: 10.1021/es051180l. [DOI] [PubMed] [Google Scholar]
- 3.a) Bergel A, Feron D, Mollica A. Electrochem Commun. 2005;7:900–904. [Google Scholar]; b) Cao XX, Huang X, Liang P, Boon N, Fan MZ, Zhang L, Zhang XY. Energy Environ Sci. 2009;2:498–501. [Google Scholar]; c) Liang P, Fan MZ, Cao XX, Huang X. J Chem Technol Biotechnol. 2009;84:794–799. [Google Scholar]; d) Rabaey K, Read ST, Clauwaert P, Freguia S, Bond PL, Blackall LL, Keller J. Isme J. 2008;2:519–527. doi: 10.1038/ismej.2008.1. [DOI] [PubMed] [Google Scholar]; e) Ter Heijne A, Strik DPBTB, Hamelers HVM, Buisman CJN. Environ Sci Technol. 2010;44:7151–7156. doi: 10.1021/es100950t. [DOI] [PubMed] [Google Scholar]; f) Zhang JN, Zhao QL, Aelterman P, You SJ, Jiang JQ. Biotechnol Lett. 2008;30:1771–1776. doi: 10.1007/s10529-008-9751-0. [DOI] [PubMed] [Google Scholar]
- 4.Rhoads A, Beyenal H, Lewandowski Z. Environ Sci Technol. 2005;39:4666–4671. doi: 10.1021/es048386r. [DOI] [PubMed] [Google Scholar]
- 5.a) Erable B, Féron D, Bergel A. ChemSusChem. 2012;5:975–987. doi: 10.1002/cssc.201100836. [DOI] [PubMed] [Google Scholar]; b) Strik D, Timmers RA, Helder M, Steinbusch KJJ, Hamelers HVM, Buisman CJN. Trends Biotechnol. 2011;29:41–49. doi: 10.1016/j.tibtech.2010.10.001. [DOI] [PubMed] [Google Scholar]
- 6.De Schamphelaire L, Boeckx P, Verstraete W. Appl Microbiol Biotechnol. 2010;87:1675–1687. doi: 10.1007/s00253-010-2645-9. [DOI] [PubMed] [Google Scholar]
- 7.a) Scott K, Cotlarciuc I, Head I, Katuri KP, Hall D, Lakeman JB, Browning D. J Chem Technol Biotechnol. 2008;83:1244–1254. [Google Scholar]; b) Dewan A, Beyenal H, Lewandowski Z. Environ Sci Technol. 2008;42:7643–7648. doi: 10.1021/es800775d. [DOI] [PubMed] [Google Scholar]; c) Freguia S, Rabaey K, Yuan Z, Keller J. Electrochim Acta. 2007;53:598–603. [Google Scholar]
- 8.a) Vetter KJ. Electrochemical Kinetics: Theoretical and Experimental Aspects. Academic Press; New York: 1967. [Google Scholar]; b) Fu L, You SJ, Yang FL, Gao MM, Fang XH, Zhang GQ. J Chem Technol Biotechnol. 2010;85:715–719. [Google Scholar]
- 9.a) Parot S, Vandecandelaere I, Cournet A, Delia ML, Vandamme P, Berge M, Rogues C, Bergel A. Bioresour Technol. 2011;102:304–311. doi: 10.1016/j.biortech.2010.06.157. [DOI] [PubMed] [Google Scholar]; b) Renslow R, Donovan C, Shim M, Babauta J, Nannapaneni S, Schenk J, Beyenal H. Phys Chem Chem Phys. 2011;13:21573–21584. doi: 10.1039/c1cp23200b. [DOI] [PMC free article] [PubMed] [Google Scholar]
- 10.Istanbullu O, Babauta J, Duc Nguyen H, Beyenal H. Biofouling. 2012;28:769–778. doi: 10.1080/08927014.2012.707651. [DOI] [PMC free article] [PubMed] [Google Scholar]
- 11.Nicoll WD, Smith AF. Ind Eng Chem. 1955;47:2548–2554. [Google Scholar]
- 12.Valim RB, Santos MC, Lanza MRV, Machado SAS, Lima FHB, Calegaro ML. Electrochim Acta. 2012;85:423–431. [Google Scholar]
- 13.Zhang L, Liu C, Zhuang L, Li W, Zhou S, Zhang J. Biosens Bioelectron. 2009;24:2825–2829. doi: 10.1016/j.bios.2009.02.010. [DOI] [PubMed] [Google Scholar]
- 14.Dewan A, Beyenal H, Lewandowski Z. Environ Sci Technol. 2009;43:4600–4605. doi: 10.1021/es8037092. [DOI] [PubMed] [Google Scholar]
- 15.Landoulsi J, Cooksey KE, Dupres V. Biofouling. 2011;27:1105–1124. doi: 10.1080/08927014.2011.629043. [DOI] [PubMed] [Google Scholar]
- 16.Babauta JT, Nguyen HD, Harrington TD, Renslow R, Beyenal H. Bio-technol Bioeng. 2012;109:2651–2662. doi: 10.1002/bit.24538. [DOI] [PMC free article] [PubMed] [Google Scholar]
- 17.Paerl HW, Pinckney JL, Steppe TF. Environ Microbiol. 2000;2:11–26. doi: 10.1046/j.1462-2920.2000.00071.x. [DOI] [PubMed] [Google Scholar]
- 18.Babauta JT, Nguyen HD, Beyenal H. Environ Sci Technol. 2011;45:6654–6660. doi: 10.1021/es200865u. [DOI] [PMC free article] [PubMed] [Google Scholar]
- 19.Lewandowski Z, Beyenal H. Fundamentals of Biofilm Research. CRC Press; Boca Raton, FL: 2007. [Google Scholar]
Associated Data
This section collects any data citations, data availability statements, or supplementary materials included in this article.
Supplementary Materials
Figure SI-1. Schematic diagram of manganese cycling inside biofilms of manganese-oxidizing bacteria.
Figure SI-2. EDS spectrum for the river cathode Protocols for EDS were followed from Renslow et al. 2011[1].


