Abstract
We developed molecular tension probes (TPs) that report traction forces of adherent cells with high spatial resolution, can be linked to virtually any surface, and obviate monitoring deformations of elastic substrates. TPs consist of DNA hairpins conjugated to fluorophore-quencher pairs that unfold and fluoresce when subjected to specific forces. We applied TPs to reveal that cellular traction forces are heterogeneous within focal adhesions and localized at their distal edges.
Traction forces are critical for many cellular processes, including migration, proliferation, and differentiation1–4. Despite the central role played by such forces in cell function, the primary technique to measure them uses specialized elastic substrates including polyacrylamide gels or elastomeric posts5, 6. The elasticity of these materials itself modulates cellular tractions, adhesion, and function7–9, thereby confounding the measurement. Furthermore, the spatial resolution of conventional methods to measure traction forces is typically limited to micrometers by the sizes of substrate deformations, or by the density of posts or other fiducial markers used to map the deformations10. To overcome this limit, Salaita and coworkers recently described a molecular force sensor in which an entropic polyethylene glycol spring separates a FRET pair11. While promising, it is difficult to tune the stiffness of this spring to capture different ranges of relevant forces. The Ha group reported an alternative approach using double stranded DNA, wherein the sequence and length of basepair complementarity can tune the force required to pull apart the strands12. In this system, the detachment of cells provides a quantitative measure of forces, but no spatiotemporal resolution.
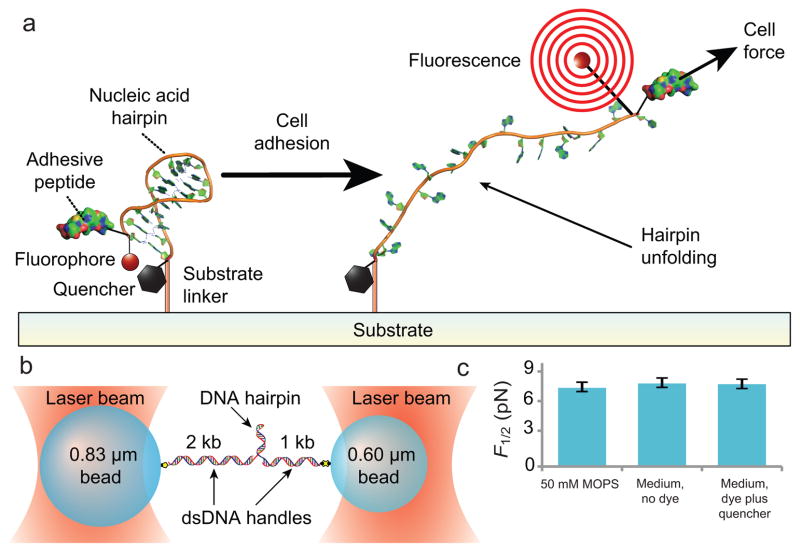
To address these limitations, we engineered a new class of molecular tension probes (TPs) that spatiotemporally report traction forces based on DNA hairpins. DNA hairpins unfold in response to precise amounts of force13, 14 that can be tuned by varying the length and composition of the DNA sequence15, 16. DNA hairpins of various stem lengths and sequences were conjugated to different fluorophore-quencher pairs, such that fluorophores were quenched in the folded state, but fluoresced in the unfolded state (Supplementary Fig. 1). The 5′ end of each hairpin was conjugated to the GGRGDS peptide, which binds integrin adhesion receptors17. While we chose the well-established RGD sequence as the cell adhesive functionality for this study, the synthesis could be modified to attach different peptides, or larger proteins, through either their N-termini or lysine side chains. The 3′ end of the hairpin was functionalized with a free thiol linker, enabling chemical conjugation to cell-culture substrates. When a cell is attached to a substrate through TPs, TP fluorescence enables the reversible, optical measurement of cell traction forces (Fig. 1a).
Figure 1. Design and characterization of DNA hairpin force probe.
(a) Schematic depiction of the TPs. A DNA hairpin is functionalized with a fluorophore-quencher pair, covalently conjugated by its 3′ end to a solid substrate, and conjugated at its the 5′ end, via a PEG spacer, to the integrin-binding peptide RGD. Upon the application of sufficient force to unfold the hairpin, the fluorophore separates from the quencher and fluoresces. (b) Schematic of the experimental geometry used to characterize the mechanics of the hairpins. The DNA hairpin is attached at each of it ends to dsDNA handles bound to optically trapped beads (not to scale) in a force-clamped arrangement. (c) Measured F1/2 (hairpin opening force) values as a function of media and fluorophore-quencher conjugation at 21 °C (mean ± s.e.m.). n>3 for each condition.
We used a dual-beam optical trapping apparatus to determine the forces needed to open TP constructs. We tested whether the chemical modifications made to these nucleic acids (including the attachment of a fluorophore-quencher pair and the addition of the PEG spacer) or the composition of the cell culture medium used for live-cell experiments perturbed the values previously determined for DNA hairpins with otherwise similar sequences16 (Fig. 1b). Single TPs were attached to DNA handles and held in a ‘dumbbell’ arrangement between two optically trapped beads, then subjected to a range of loads using a force clamp to determine the F1/2 value, the force at which the hairpin spends equal time in its folded and unfolded states. The F1/2 values for chemically modified hairpins in culture medium did not differ substantially from values obtained with unmodified DNA hairpins in a simple monovalent salt buffer (Fig. 1c, Supplementary Table 4)16,18, suggesting that the chemical modifications and culture medium compositions did not strongly influence the forces needed to open various TP hairpins.
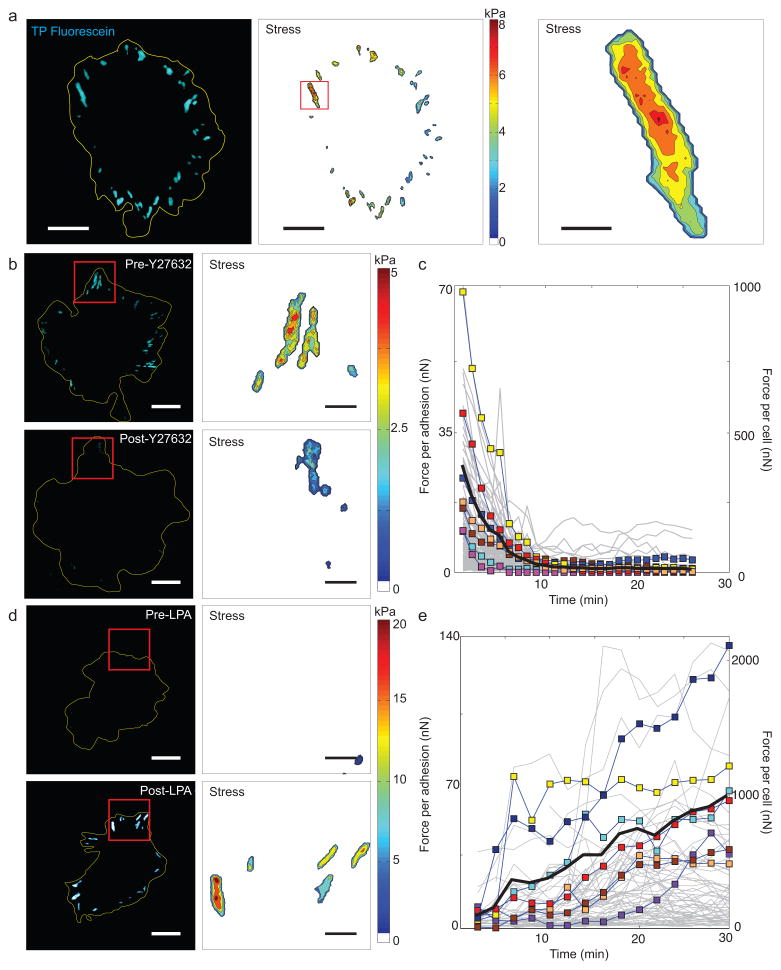
We plated mouse embryonic fibroblasts (MEFs) on TP-conjugated glass substrates and imaged cell-generated force signals via total internal reflectance fluorescence (TIRF) microscopy. Strong fluorescent signals over background noise (500:1) were detected that mirrored the sizes, shapes, and locations of FAs (Fig. 2a and Supplementary Fig. 2–5 and Supplementary Table 5). Time-lapse imaging revealed that TP fluorescence appeared, shifted, disappeared, and reappeared dynamically, reminiscent of adhesion assembly-disassembly dynamics (Supplementary Movie 1). TPs with different fluorophores (fluorescein, Alexa 546, and Alexa 647) and different F1/2 values, ranging from 5.7–16.5 pN, all exhibited similar responses to attached cells (Supplementary Fig. 5–7). Cells cultured on a surface coated with an equimolar mixture of two TPs with different F1/2 values demonstrated that both TPs reported the same magnitude and pattern of traction stresses in cells. The ratio of signal intensity between the two TPs was constant across the range of observed cellular forces, suggesting that TP fluorescence signal and traction force have a simple linear relationship across this range (Supplementary Fig. 6).
Figure 2. Fluorescence reports cellular traction forces.
(a) Image of MEF attached on TP-coated substrate. Fluorescent signal from TPs beneath a spread cell (yellow outline) were acquired (left panel), then converted to traction maps calculated from the fluorescence level (middle). The maps show distributions of forces across the cell consistent with the size, shape, and location of FAs. Examination of individual adhesion sites (right) shows a heterogeneous distribution of stress within each site (scale bars: 20 μm, left two panels; 3 μm, right panel. (b,d) Fluorescence (left) and traction map (right) reported by TPs of cells spread before (top panels) and after (bottom) addition of either the ROCK inhibitor Y27632 (15 min after treatment) (panel B) or LPA (1 hr after treatment), an activator of Rho (panel D) (scale bars: 20 μm; left; 5 μm, right. (c,e) Plots of mean stress per adhesion site as a function of time for individual cells treated with Y27632 (panel c) or LPA (panel e). Individual adhesions (grey lines); individual cells (colored squares and lines); mean of all cells (black solid line). n ≥ 7 cells and 650 adhesions. TP calibrations were carried out using the values for 37°C found in Supplementary Table 1.
The fluorescence signal reports the number of unfolded TPs per pixel and therefore may be used to infer traction stress (force per unit area) (see Online Methods). The resulting stress maps revealed mean traction levels per adhesion (~1 kPa) that are consistent with previous estimates calculated by assuming that forces were evenly distributed across the area of adhesions19. These maps, however, revealed that the spatial distribution of traction stresses between, and within, each FA is strikingly heterogeneous, with stresses peaking as high as 30 kPa (Fig. 2a). To confirm that the fluorescence signals reflected traction forces, we examined the effects of either suppressing or enhancing cell contractility. Addition of Y-27632, an inhibitor of contraction20, rapidly extinguished traction signals distributed in large adhesions to dim, punctate signals (Fig. 2b,c and Supplementary Movie 2). Conversely, treatment of starved cells with lysophosphatidic acid (LPA), a strong stimulant of contraction21, led to a rapid growth of bright foci again reminiscent of FAs (Fig. 2d,e and and Supplementary Movie 3). Together, these results suggest that the observed fluorescence signals reflect bona fide changes in cellular traction forces.
Diminished surface density of adhesive ligand decreases the total force that cells exert22, but the forces experienced by individual adhesions are unknown. Consistent with prior studies, decreasing stoichiometries of the TP and its non-adhesive analogue lacking RGD and fluorophore resulted in decreased cell spreading, fewer and smaller adhesions, and decreased total cell force (Supplementary Fig. 9 and 10a–f). Surprisingly, the tension per adhesion and tension per TP peaked at intermediate TP density (Supplementary Fig. 10g,h), implying that adhesive ligand-induced activation of cellular contractility occurs at a lower ligand density than ligand-induced adhesion assembly.
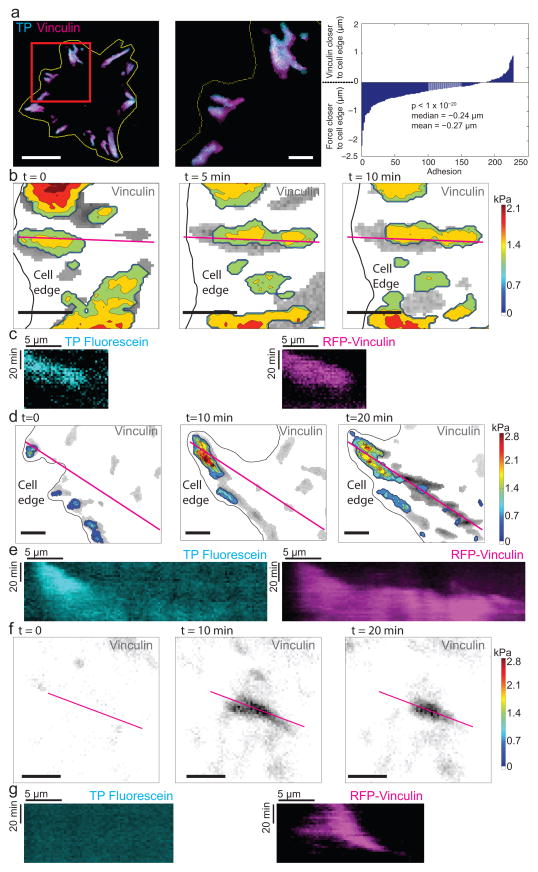
TPs offer a substantial improvement in spatial resolution compared to traditional traction force methods, which typically report forces on a scale of several μm23. Because TPs are single fluorescent molecules, the resolution of traction force measurements is dictated by photon capture efficiency and microscope optics (in this work, 200 × 200 nm image pixels). To demonstrate the utility of this resolution, we cultured MEFs expressing red fluorescent protein-tagged vinculin, a scaffolding protein that localizes to FAs, and compared the distribution of vinculin to the distribution of TP signal. The locations and geometries of traction foci correlated strongly with those of FAs; however, the TP foci were consistently closer to the cell edge than vinculin foci by ~200 nm (Fig. 3a and Supplementary Fig. 5). Two recent studies using traction force microscopy on elastic gels also reported forces focused to distal edges24, 25, but it is difficult to interpret whether the larger spatial shift (1.4 μm) reported in those studies is due to differences in resolution or substrate stiffness.
Figure 3. Localizations of traction forces with respect to FA proteins.
(a) Fluorescence image of TP-coated substrate (cyan) and overlying cell (yellow outline) expressing mRFP-vinculin (magenta). High-magnification inset (middle) illustrates the high degree of co-localization of FA relative to TP-measured tractions, with tractions slightly more distal from the cell center than vinculin. The right panel plots the difference in distance (in μm) of the geometric centroid from the cell edge of the two signals for selected adhesions. The skew in the distribution reflects a distal bias for tractions relative to adhesions (p-value reported from Wilcoxon signed-rank test of difference between distances of centroids of adhesions from the cell edge as reported by TPs and mRFP-vinculin). Scale bar is 20 μm (left) and 5 μm (center). n = 7 cells; 227 adhesions. (b–g) Representative examples of the three classes of adhesions. Images show a sequence over time of the vinculin fluorescence (gray scale) overlaid with the TP-reported stress map (b, d, f). The edge of the cell is illustrated with a black line. Scale bars are 5 μm. The magenta line indicates the position used for kymographs (c, e, g) showing the evolution of the TP (left) and vinculin (right) signals over time. Vertical scale bar is 20 min; horizontal bar is 5 μm. TP calibrations were carried out using the values for 37°C found in Supplementary Table 1. Of the 112 adhesions catalogued using this analysis, 86 adhesions were observed where force and assembly/disassembly were correlated, 12 adhesions where force only localized to the tip of a growing adhesion, and 14 adhesions that spontaneously formed without force.
Following the evolution of traction forces and FAs, we also observed three distinct classes of adhesions. In one class, traction force and vinculin location correlated to a high degree throughout the lifetime of the adhesion; force increased during adhesion assembly and subsided during its disassembly (Fig. 3b,c). In a second class, force and vinculin co-localized at the initiation of the adhesion, but as the adhesion continued to grow and extend towards the center of the cell, force remained localized to the distal tip of the elongating adhesion (Fig. 3d,e). In a third class of adhesions that form in the cell interior well behind lamellipodia, no force was observed despite vinculin clustering (Fig. 3f,g). Time-lapse studies highlighted the heterogeneity of stress experienced within any given adhesion: some exhibited a single concentrated peak of stress, some showed multiple peaks that appeared, disappeared, merged, or split, and some showed a plateau in stress, with no concentrated peaks. All together, these findings reveal a complex orchestration of cellular forces within FAs.
This study establishes DNA hairpins as versatile molecular reporters to study cellular forces. Methods to measure traction forces using elastic substrates have been instrumental in establishing the importance of forces26. While molecular TPs are not currently able to provide directional information about forces, their improved resolution, ability to attach to arbitrary substrates, and the versatility afforded by coupling different adhesive ligands, all afford special advantages in elucidating the contribution of cellular forces to cell adhesion and function. Previous studies have coupled elastic chains and FRET probes to report forces across vinculin and EGFR27, 28. The TPs developed here, by contrast, generate a higher signal-to-noise ratio due to the substantial change in fluorescence as a function of fluorophore-quencher distance. Furthermore, the well-established relationship between DNA sequence and DNA folding energetics16 enables the rational design of TPs for sensing force over various ranges of interest. While the investigation of DNA mechanics has largely been used to establish fundamental models of polymer physics, using these physical principles to engineer DNA-based probes that report molecular forces may enable a new class of measurement tools, and new insights into forces generated by living systems at the cellular level.
Supplementary Material
Acknowledgments
This work was supported in part from grants from the National Institutes of Health (EB00262, EB08396, EB001046, HL115553, GM065865, GM74048, and GM57035) and the Howard Hughes Medical Institute. We thank Michael Woodside (Univ. Alberta, Canada) for assistance in modeling hairpin opening forces. B.L.B., C.K.C, B.M.B., and C.E.D. acknowledge fellowships from the National Science Foundation, the American Heart Association, the Ruth L. Kirschstein National Research Service Award, and the Novartis Foundation, respectively.
Footnotes
Author Contributions
B.L.B., C.E.D., C.S.C., and D.R.L. conceived and initiated the project. B.L.B., C.E.D., B.T., L.M.M., C.K.C., P.C.A., V.K.D., and B.M.B. designed, performed, analyzed, and interpreted experiments. C.E.D., B.T., and L.M.M. synthesized TPs. P.C.A. and V.K.D characterized TP mechanics. B.L.B, B.T., C.K.C., and B.M.B. performed the cell-based experiments. S.M.B., C.S.C., D.R.L. supervised the project.
References
- 1.Beningo KA, Wang YL. Trends Cell Biol. 2002;12:79–84. doi: 10.1016/s0962-8924(01)02205-x. [DOI] [PubMed] [Google Scholar]
- 2.Mammoto T, Ingber DE. Development. 2010;137:1407–1420. doi: 10.1242/dev.024166. [DOI] [PMC free article] [PubMed] [Google Scholar]
- 3.McBeath R, Pirone DM, Nelson CM, Bhadriraju K, Chen CS. Dev Cell. 2004;6:483–495. doi: 10.1016/s1534-5807(04)00075-9. [DOI] [PubMed] [Google Scholar]
- 4.Pirone DM, et al. J Cell Biol. 2006;174:277–288. doi: 10.1083/jcb.200510062. [DOI] [PMC free article] [PubMed] [Google Scholar]
- 5.Dembo M, Wang YL. Biophys J. 1999;76:2307–2316. doi: 10.1016/S0006-3495(99)77386-8. [DOI] [PMC free article] [PubMed] [Google Scholar]
- 6.Tan JL, et al. Proc Natl Acad Sci U S A. 2003;100:1484–1489. doi: 10.1073/pnas.0235407100. [DOI] [PMC free article] [PubMed] [Google Scholar]
- 7.Engler AJ, Sen S, Sweeney HL, Discher DE. Cell. 2006;126:677–689. doi: 10.1016/j.cell.2006.06.044. [DOI] [PubMed] [Google Scholar]
- 8.Paszek MJ, et al. Cancer Cell. 2005;8:241–254. doi: 10.1016/j.ccr.2005.08.010. [DOI] [PubMed] [Google Scholar]
- 9.Pelham RJ, Jr, Wang Y. Proc Natl Acad Sci U S A. 1997;94:13661–13665. doi: 10.1073/pnas.94.25.13661. [DOI] [PMC free article] [PubMed] [Google Scholar]
- 10.Legant WR, et al. Nat Methods. 2010;7:969–971. doi: 10.1038/nmeth.1531. [DOI] [PMC free article] [PubMed] [Google Scholar]
- 11.Liu Y, Yehl K, Narui Y, Salaita K. J Am Chem Soc. 2013;135:5320–5323. doi: 10.1021/ja401494e. [DOI] [PMC free article] [PubMed] [Google Scholar]
- 12.Wang X, Ha T. Science. 2013;340:991–994. doi: 10.1126/science.1231041. [DOI] [PMC free article] [PubMed] [Google Scholar]
- 13.Kong F, Garcia AJ, Mould AP, Humphries MJ, Zhu C. J Cell Biol. 2009;185:1275–1284. doi: 10.1083/jcb.200810002. [DOI] [PMC free article] [PubMed] [Google Scholar]
- 14.Sun Z, et al. Am J Physiol Heart Circ Physiol. 2005;289:H2526–2535. doi: 10.1152/ajpheart.00658.2004. [DOI] [PubMed] [Google Scholar]
- 15.Woodside MT, et al. Science. 2006;314:1001–1004. doi: 10.1126/science.1133601. [DOI] [PMC free article] [PubMed] [Google Scholar]
- 16.Woodside MT, et al. Proc Natl Acad Sci U S A. 2006;103:6190–6195. doi: 10.1073/pnas.0511048103. [DOI] [PMC free article] [PubMed] [Google Scholar]
- 17.Ruoslahti E, Pierschbacher MD. Cell. 1986;44:517–518. doi: 10.1016/0092-8674(86)90259-x. [DOI] [PubMed] [Google Scholar]
- 18.Anthony PC, et al. J Am Chem Soc. 2012;134:4607–4614. doi: 10.1021/ja208466h. [DOI] [PMC free article] [PubMed] [Google Scholar]
- 19.Balaban NQ, et al. Nat Cell Biol. 2001;3:466–472. doi: 10.1038/35074532. [DOI] [PubMed] [Google Scholar]
- 20.Uehata M, et al. Nature. 1997;389:990–994. doi: 10.1038/40187. [DOI] [PubMed] [Google Scholar]
- 21.Yoshioka K, Matsumura F, Akedo H, Itoh K. J Biol Chem. 1998;273:5146–5154. doi: 10.1074/jbc.273.9.5146. [DOI] [PubMed] [Google Scholar]
- 22.Reinhart-King CA, Dembo M, Hammer DA. Langmuir. 2003;19:1573–1579. [Google Scholar]
- 23.Sabass B, Gardel ML, Waterman CM, Schwarz US. Biophys J. 2008;94:207–220. doi: 10.1529/biophysj.107.113670. [DOI] [PMC free article] [PubMed] [Google Scholar]
- 24.Plotnikov SV, Pasapera AM, Sabass B, Waterman CM. Cell. 2012;151:1513–1527. doi: 10.1016/j.cell.2012.11.034. [DOI] [PMC free article] [PubMed] [Google Scholar]
- 25.Legant WR, et al. Proc Natl Acad Sci U S A. 2013;110:881–886. doi: 10.1073/pnas.1207997110. [DOI] [PMC free article] [PubMed] [Google Scholar]
- 26.Style RW, et al. Soft Matter. 2014;10:4047–4055. doi: 10.1039/c4sm00264d. [DOI] [PubMed] [Google Scholar]
- 27.Grashoff C, et al. Nature. 2010;466:263–266. doi: 10.1038/nature09198. [DOI] [PMC free article] [PubMed] [Google Scholar]
- 28.Stabley DR, Jurchenko C, Marshall SS, Salaita KS. Nat Methods. 2012;9:64–67. doi: 10.1038/nmeth.1747. [DOI] [PubMed] [Google Scholar]
Associated Data
This section collects any data citations, data availability statements, or supplementary materials included in this article.


