Abstract
Aim of the study
To explore the correlation of the expression of vascular endothelial growth factor (VEGF) and epidermal growth factor receptor (EGFR) with maximum standardised uptake value (SUVmax) of 18FDG-PET-CT in non-small cell lung cancer (NSCLC).
Material and methods
Thirty patients received PET-CT imaging protocol first, and then all the patients underwent needle biopsy though CT guidance. The tumour tissue of each patient was taken from two biopsy areas: one area was SUVmax = 2.5–5, and the other was SUVmax > 5. Expression of VEGF and EGFR were detected and analysed by immunohistochemical staining.
Results
The expressions of both VEGF and EGFR had no statistically significant correlation with SUVmax in age, gender, pathology, or differentiation (p > 0.05). The expressions of both VEGF and EGFR had statistically significant correllation with SUVmax in tumour size and clinical stage (p < 0.05). SUVmax correlated positively with VEGF and EGFR expressions (r = 0.879, p < 0.05).
Conclusions
SUVmax correlated positively with expressions of VEGF and EGFR (r = 0.879, p = 0.000; r = 0.839, and p = 0.000, respectively). This study may provide guidance for radiotherapy of NSCLC.
Keywords: vascular endothelial growth factor, non-small cell lung cancer
Introduction
Lung cancer is currently one of the most common malignant tumours, and non-small cell lung cancer (NSCLC) accounts for about 75–80% of lung cancer [1, 2]. Due to lack of early diagnostic methods 75% of patients are diagnosed too late and lose the opportunity for surgery [3, 4]. Non-small cell lung cancer is prone to distant metastasis, and currently there is no effective treatment to control it. So far, in NSCLC, the 5-year survival rate after treatment is only 10% [5]. So how to further improve the efficacy of NSCLC is still a major issue of clinical research. For stage I, II, and III of some selective patients, surgical resection is the preferred method of treatment, but unfortunately only 25–30% patients choose radical surgery [6, 7]. For unresectable NSCLC, comprehensive treatment with radiotherapy and chemotherapy provides a possible chance of cure. In NSCLC, radiotherapy is an important local treatment. It shows that about (64.3 ±4.7%) of patients at different stages in their treatment need to receive radiation therapy [8, 9].
Radiotherapy has developed from ordinary radiotherapy to conformal radiotherapy, intensity-modulated radiation therapy (IMRT), and image guided radiotherapy (IGRT). The GTV (tumour volume) is determined to be dependent on imaging, the so-called image target area. There are still low rates of local control in many tumours given equal doses because of radiation-related cancer genes [such as vascular endothelial growth factor (VEGF), epidermal growth factor receptor (EGFR)] heterogeneity expression in tumours [10–12]. In theory, tumours should be given different doses based on the heterogeneity expression of radiation-related genes to develop radiotherapy into the biological target era.
This study aims to detect the correlation between the expressions of VEGF and EGFR in different parts of tumour tissue by immunohistochemistry and SUV (standardised uptake value) values in PET-CT (positron emission tomography-computed tomography) in NSCLC, to provide guidance in determining radiation doses.
Material and methods
Patients and specimens
We selected 30 patients with NSCLC who were treated at the Affiliated Hospital of Qingdao University Medical College between June 2009 and December 2010. The study was conducted in accordance with the declaration of Helsinki and with approval from the Ethics Committee of the Affiliated Hospital of Qingdao University Medical College. Written informed consent was obtained from all participants. The clinical and pathological characteristics of the 30 patients with NSCLC are as follows: 18 (60%) were male and 12 were female. Eleven (36.7%) were diagnosed as adenocarcinoma, and 19 were diagnosed as other types of carcinoma (squamous carcinoma, 17; large cell carcinoma, 1; adenosquamous carcinoma, 1). Two (6.7%) were stage I, 9 (30%) were stage II, 13 (43.3%) were stage III, and 6 (20%) were stage IV according to the NSCLC staging system. All patients were primary lung cancer without chemotherapy and radiotherapy.
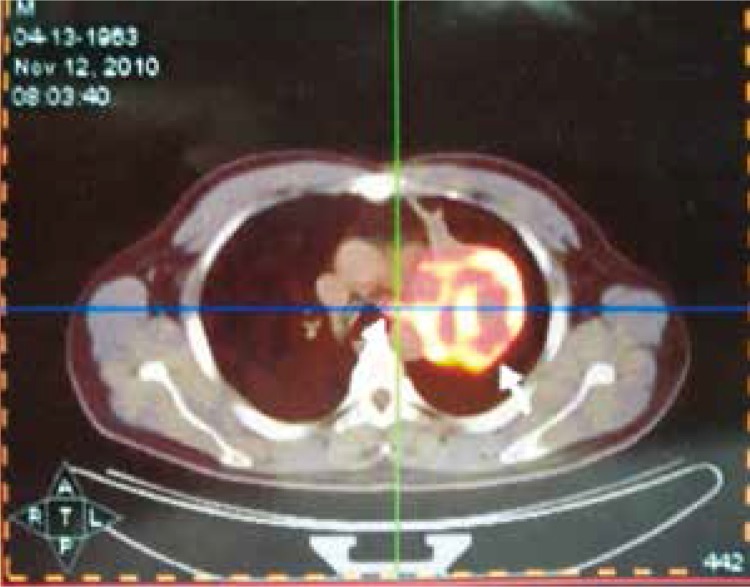
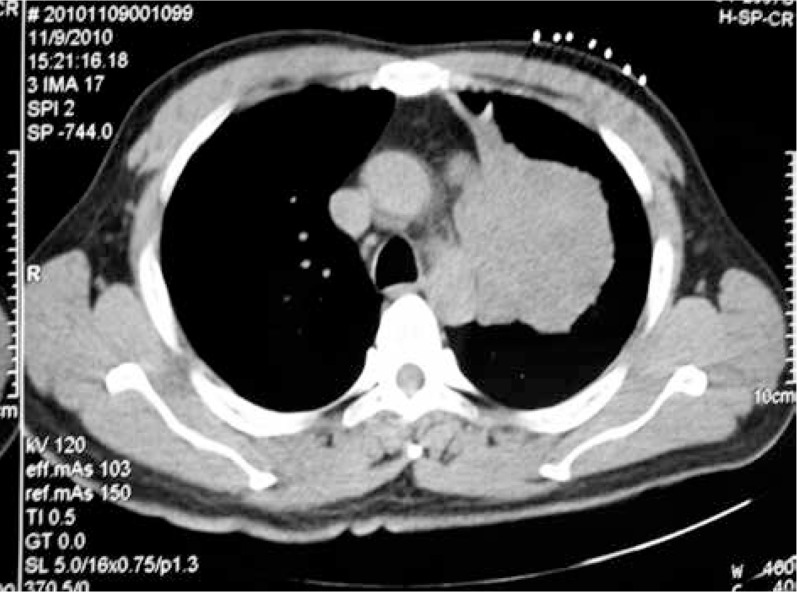
All patients underwent PET-CT within two weeks following CT. The results of PET-CT were regarded as negative if there was no or very low metabolic activity within lesions. A maximum standardised uptake value (SUVmax) of 2.5 was used as an arbitrary tumour limit. Two tumour areas of the same lesion selected from each patient were recorded if one was SUVmax = 2.5–5, the other was SUVmax > 5 by CT guided biopsy (Figs. 1, 2).
Fig. 1.
PET-CT Fused image
Fig. 2.
CT-guided biopsy
Immunohistochemistry
All the specimens were fixed in 10% neutral buffered formalin and processed routinely for VEGF and EGFR immunohistochemistry. In all cases, each of the formalin-fixed and paraffin-embedded tissue blocks was cut into five pieces with 2-µm spacing and transferred onto slides. One slice was stained with HE, and the others were used for IHC studies. The expressions of VGFR and EGFR were detected by immunohistochemistry method (pv-6000 two-step) (Zhongshan Golden Bridge Biotechnology Corporation, Beijing, China). Phosphate buffered saline (PBS) was used in place of primary antibodies as a negative control, and positive results were used as a positive control.
Judgment of results
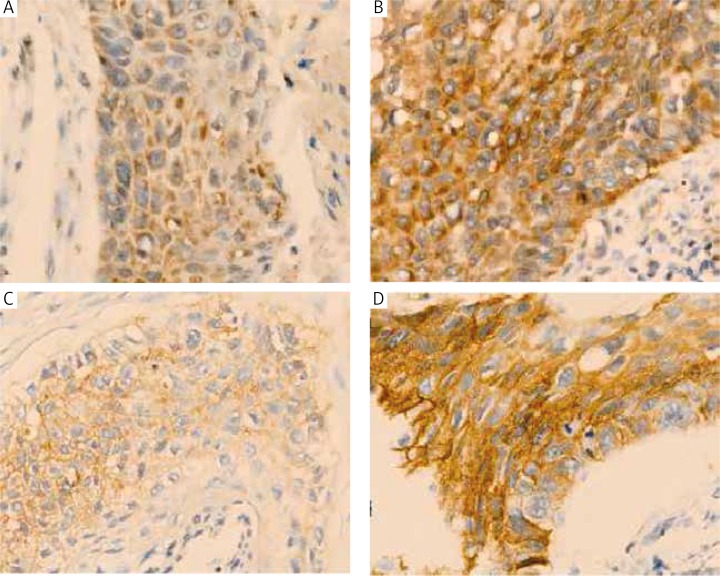
VEG-positive cells were stained with brown-yellow granules or masses, specifically in the cytoplasm or cell membrane. EGFR-positive expression was seen in cytomembrane or cytolymph. Both the intensity and percentage of positive cells were measured. The staining intensity was determined for the following four classes: 0 = undetectable; 1 = faint buff; 2 = moderate buff; and 3 = high buff or sepia. Stained cell sections in each case were randomly selected and five high-power fields were counted under the microscope up to 400. We counted 200 cells in each region for a total number of 1000 cells, calculated the percentage of positive cells, and then calculated the score. Using the percentage of stained cells × staining intensity, the integrated scoring was assessed. Cell expression was stratified as follows: 0 (negative) for less than 10% positive cells, 1 (weak) for less than 25% positive cells, 2 (moderate) for less than 50% positive cells, and 3 (strong) for more than 50% positive cells. The product of the staining intensity and positive cell scores determined the final result for each section (Figs. 3A-D).
Fig. 3.
A) VGFR low expression (400×); B) VGFR high expression (400×); C) EGFR low expression (400×); D) EGFR high expression (400×)
Statistical analysis
Using SPSS11.5 statistical analysis software, the two samples were compared by t-test, and multiple samples were compared by chi-squared analysis. Bivariate correlation analysis was used to evaluate the SUVmax, respectively, correlated with VGFR and EGFR expression. Continuous variables were expressed as median ± standard deviation and the difference had statistical significance p < 0.05.
Results
VGFR-positive expression was found in 21 cases (70%). VGFR expression had no difference with regard to age, gender, pathology, and differentiation (p > 0.05). The expression of VGFR was statistically significantly different with regard to tumour sizes and clinical stage (p < 0.05) (Table 1).
Table 1.
Relation between EGFR expression and clinical pathological factors in NSCLC
|
n VEGF x ±s |
P |
n SUV value x ±s |
P | |
|---|---|---|---|---|
| Sex Male female |
12 5.19 ±0.96 9 5.81 ±1.24 |
0.217 |
18 8.71 ±2.09 12 9.90 ±2.73 |
0.188 |
| Age < 60 years ≥ 60 years |
12 5.40 ±1.22 9 5.53 ±1.00 |
0.786 |
19 9.12 ±2.44 11 9.30 ±2.43 |
0.848 |
| Pathology adenocarcinoma others |
7 4.80 ±1.14 14 5.78 ±0.97 |
0.053 |
11 8.25 ±2.41 19 9.73 ±2.27 |
0.102 |
| Differentiation poor moderate-well |
7 5.73 ±1.06 14 5.32 ±1.14 |
0.437 |
10 10.11 ±2.12 20 8.73 ±2.44 |
0.138 |
| Tumour size ≥ 5 cm < 5 cm |
6 4.58 ±1.15 15 5.81 ±0.90 |
0.017 |
10 7.71 ±1.60 20 9.93 ±2.41 |
0.014 |
| Stage I–II III–IV |
8 4.43 ±0.78 13 6.09 ±0.74 |
0.000 |
11 7.94 ±2.19 19 9.91 ±2.25 |
0.027 |
EGFR expression showed no difference with age, gender, pathology, and differentiation (p > 0.05). The expression of EGFR showed statistically significant differences with regard to tumour size and clinical stage (p < 0.05) (Table 2).
Table 2.
Relation between EGFR expression and clinical pathological factors in NSCLC
|
n EGFR x ±s |
P |
n SUV value x ±s |
P | |
|---|---|---|---|---|
|
Sex male female |
12 5.37 ±0.96 9 6.02 ±0.98 |
0.144 |
18 8.71 ±2.09 12 9.90 ±2.73 |
0.188 |
|
Age < 60 years ≥ 60 years |
12 5.53±1.18 9 5.80 ±0.73 |
0.538 |
19 9.12 ±2.44 11 9.30 ±2.43 |
0.848 |
|
Pathology adenocarcinoma others |
7 5.16 ±0.96 14 5.89 ±0.96 |
0.115 |
11 8.25 ±2.41 19 9.73 ±2.27 |
0.102 |
|
Differentiation poor moderate-well |
7 5.62 ±0.89 14 5.66 ±1.08 |
0.941 |
10 10.11 ±2.12 20 8.73 ±2.44 |
0.138 |
|
Tumour size ≥ 5 cm < 5 cm |
15 5.84 ±0.95 6 5.17 ±1.03 |
0.171 |
20 9.93 ±2.41 10 7.71 ±1.60 |
0.014 |
|
Stage I–II III–IV |
8 4.94 ±0.92 13 6.08 ±0.79 |
0.007 |
11 7.94 ±2.19 19 9.91 ±2.25 |
0.027 |
The SUVmax correlated positively with VGFR expression and the higher VEGF expression score, SUV values greater (r = 0.879, p = 0.000).
The SUVmax correlated positively with EGFR expression and the higher EEGF expression score, SUV values greater (r = 0.839, p = 0.000).
Discussion
With the popularity of CT, magnetic resonance (MR), and other equipment, three-dimensional conformal radiotherapy (3-DCRT) and intensity-modulated radiation therapy (IMRT) have been widely recognised and applied. Target radiation doses may have been upgraded to improve the efficacy of radiotherapy to a certain extent. However, there are still some deficiencies using conventional CT for intensity-modulated conformal radiotherapy planning. It may determine the target area of tumour cell distribution and radiation sensitivity differences in different regions by functional imaging such as PET and single photon emission computed tomography (SPECT) imaging. The rapid development of these technologies has resulted in the production of biological target volume (BTV) and biological intensity-modulated radiation therapy (BIMRT), and can provide the basis for individualised treatment to determine BTV and BIMRT for non-small cell lung cancer (NSCLC). Application of intensity-modulated radiotherapy with different irradiation doses for different biological targets can improve local control rates and survival rates of NSCLC, as well as reduce the exposure doses of surrounding lung tissue, heart, oesophagus, spinal cord, etc., in order to reduce radiation complications.
18F-FDG-PET is a kind of functional or metabolic imaging using 18-fluorodeoxyglucose as tracers. Standardised uptake value (SUV) as a semi-quantitative index reflecting the organisation of glucose metabolic rate, plays an important role in diagnosis [13], staging [14, 15], efficacy evaluation [16, 17], and prognosis [18] of NSCLC. PET-CT has a very important clinical significance for radiation treatment planning to determine the target. Giraud et al. [19] reported that two radiotherapy doctors outlined a separate target, and the compliance of the target was 84% with the use of PET-CT, while it was only 37% with the use of CT in line. Steenbakkers et al. [20] reported that doctors from 11 different agencies outlined GTV in 22 patients with NSCLC using CT, and a year later the overall difference of the target outlined by reusing PET-CT decreased from 45% to 18%.
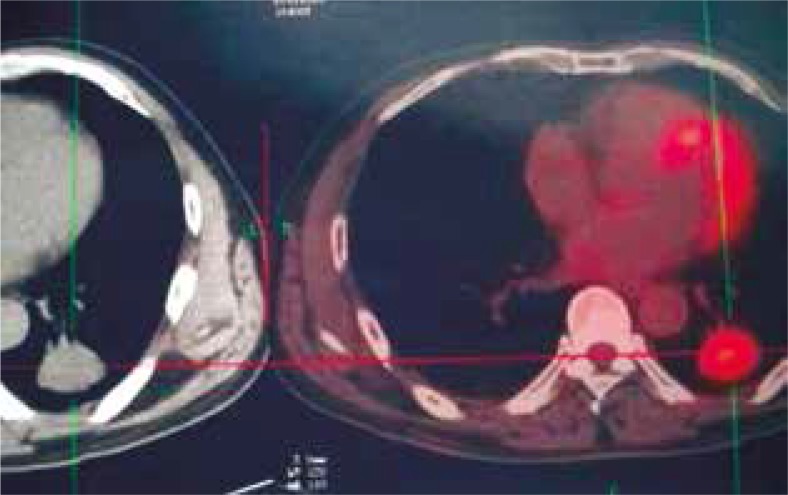
As shown in Fig. 4, a lesion of lung cancer had different features on the CT image and the 18F-FDG-PET image. On the CT image, the lesion of lung cancer had no difference of CT value within the mass. While on the 18F-FDG-PET image, from the centre to the edge of the mass, the lesion had obvious differences in SUV. The different SUVs reflect the different metabolic rates of the lung cancer cells.
Fig. 4.
A lesion of lung cancer shown on CT image (on the left) and on 18FDG-PET-CT image (on the right)
Biological target volumes are tumour targets with different radio-sensitivity in the region determined by a series of biological factors. These biological factors include the lack of oxygen, blood supply, proliferation, apoptosis and cell cycle regulation, change of oncogenes and suppressor genes, invasion, and metastasis. Epidermal growth factor receptor and VEGF are important biological factors in the decision of BTV. Vascular endothelial growth factor is also known as vascular permeability factor (VPF). Now it has been confirmed that VEGF and its family members are essential for the induction factor in tumour angiogenesis and other physiological and pathological angiogeneses. Tumour growth must rely on new blood vessels. Vascular endothelial growth factor can strongly induce angiogenesis and plays an important role in sustaining the survival of endothelial cells. Many experimental studies and clinical data have proven that the radiation sensitivity of tumour cells is negatively correlated with the expression level of VEGF. Epidermal growth factor receptor (erbB1) is one of four members of the ErbB receptor family. They have a common structure, including an external ligand binding domain, a transmembrane domain, and intracellular tyrosine kinase activity for signal transduction. A ligand binding, such as epidermal growth factor (EGF) or transforming growth factor α (TGF-α), cause EGFR to dimerise or heterodimerise with other erbB family members. This leads to activation of receptor tyrosine kinase signalling cascade and produces different effects including migration, maturation, differentiation, metastasis, angiogenesis, and apoptosis [21]. Domestic studies have shown that in patients with VEGF- and EGFR-positive expression of non-small cell lung cancer, SUV increased with VEGF and EGFR expression strength, but there is no in-depth study about the correlation between the two. This is the first study of the correlation between SUV and VEGF and EGFR expression scores in NSCLC. The expression of VEGF and EGFR in non-small cell lung cancer showed no statistically significant difference with regard to age, sex, tumour histological type, or tumour differentiation degree, but showed statistically significant differences with regard to tumour size and TNM stage. The greater the tumour diameter and the later the clinical stage, the higher the expression of VEGF and EGFR. The positive expressions of VEGF and EGFR were significantly higher than the negative expressions of VEGF and EGFR in lung cancer. The differences were statistically significant. This study also found that the expression scores of VEGF and EGFR were significantly correlated with the SUV in NSCLC. The expression scores of VEGF and EGFR were higher, and the SUVs were higher. The differences were statistically significant.
Heterogeneity of tumours means differences in the tumour cells within the same lesion caused by different tumour cell lines. Heterogeneity of tumours has its main differences in the histology, antigen, immunity, hormone receptors, metabolism, growth rate, sensitivity to radiotherapy and chemotherapy, invasion, and metastasis. The study showed that SUV values were unequal within the same tumour tissue, and both VGFR and EGFR expressions were different in different SUV regions of the same tissue, which were associated with tumour heterogeneity. Therefore, it may provide a reference on the delineation of BTV according to the heterogeneity of the expression of tumour radiotherapy-related genes (VEGF and EGFR). According to the results of this study, in which both VEGF and EGFR expression are positively correlated with the SUV in NSCLC, in theory the same tissue can be given different radiation doses according to different SUV values. The higher SUV-value areas in the same tissue can be given greater radiation doses in non-small cell lung cancer. This study may gradually transform non-small cell lung cancer radiotherapy into BIMRT, and provide theoretical guidance to determine doses of intensity-modulated radiation therapy.
The authors declare no conflict of interest
References
- 1.Navada S, Lai P, Schwartz AG, Kalemkerian GP. Temporal trends in small cell lung cancer: analysis of the national Surveillance Epidemiology and End-Results (SEER) database. J Clin Oncol. 2006;24:384S. [Google Scholar]
- 2.Sher T, Dy GK, Adjei AA. Small cell lung cancer. Mayo Clin Proc. 2008;83:355–67. doi: 10.4065/83.3.355. [DOI] [PubMed] [Google Scholar]
- 3.Carney DN. Lung cancer-time to move on from chemotherapy. N Engl J Med. 2002;346:126–8. doi: 10.1056/NEJM200201103460211. [DOI] [PubMed] [Google Scholar]
- 4.Chute JP, Chen T, Feigal E, Simon R, Johnson BE. Twenty years of phase III trials for patients with extensive-stage small-cell lung cancer: perceptible progress. J Clin Oncol. 1999;17:1794–801. doi: 10.1200/JCO.1999.17.6.1794. [DOI] [PubMed] [Google Scholar]
- 5.Visbal AL, Williams BA, Nichols FC, 3rd, et al. Gender differences in non-small cell lung cancer survival: an analysis of 4, 618 patients diagnosed between 1997-2002. Ann Thorac Surg. 2004;78:209–15. doi: 10.1016/j.athoracsur.2003.11.021. [DOI] [PubMed] [Google Scholar]
- 6.Boffa DJ, Allen MS, Grab JD, Gaissert HA, Harpole DH, Wright CD. Data from The Society of Thoracic Surgeons General Thoracic surgery database: the sergical management of primary lung tumors. J Thorac Cardiovasc Surg. 2008;135:247–52. doi: 10.1016/j.jtcvs.2007.07.060. [DOI] [PubMed] [Google Scholar]
- 7.Scott WJ, Howington J, Feigenberg S, Movsas B, Pisters K. Treatment of non-small cell lung cancer stage I and stage II: ACCP evidence-based clinnical practice guidelines (2nd edition) Chest. 2007;132:234S–42S. doi: 10.1378/chest.07-1378. [DOI] [PubMed] [Google Scholar]
- 8.Pfister DG, Johnson DH, Azzoli CG, et al. American Society of Clinical Oncology treatment of unresectable non-small-cell lung cancer guideline: updated 2003. J Clin Oncol. 2004;22:330–53. doi: 10.1200/JCO.2004.09.053. [DOI] [PubMed] [Google Scholar]
- 9.Tyldesley S, Boyd C, Schulze K, Walker H, Mackillop WJ. Estimating the need for radio-therapy for lung cancer: an evidence based, epidemiologic approach. Int J Radiat Oncol Biol Phys. 2001;49:973–85. doi: 10.1016/s0360-3016(00)01401-2. [DOI] [PubMed] [Google Scholar]
- 10.Shigematsu H, Gazdar AF. Somatic mutations of epidermal growth factor receptor signaling pathway in lung cancers. Int J Cancer. 2006;118:257–62. doi: 10.1002/ijc.21496. [DOI] [PubMed] [Google Scholar]
- 11.Jänne PA, Engelman JA, Johnson BE. Epidermal growth factor receptor mutations in non-small-cell lung cancer: implications for treatment and tumor biology. J Clin Oncol. 2005;23:3227–34. doi: 10.1200/JCO.2005.09.985. [DOI] [PubMed] [Google Scholar]
- 12.Calvo E, Baselga J. Ethnic differences in response to epidermal growth factor receptor tyrosine kinase inhibitors. J Clin Oncol. 2006;24:2158–63. doi: 10.1200/JCO.2006.06.5961. [DOI] [PubMed] [Google Scholar]
- 13.Port JL, Andrade RS, Levin MA, Korst RJ, Lee PC, Becker DE, Altorki NK. Positron emission tomographic scanning in the diagnosis and staging of non-small cell lung cancer 2 cm in size or less. J Thorac Cardiovasc Surg. 2005;130:1611–5. doi: 10.1016/j.jtcvs.2005.07.014. [DOI] [PubMed] [Google Scholar]
- 14.Yang JJ, Wu YL, Yan J. A comparative study of 18FDG-PET and CT on diagnosing mediastinal lymph nodes in non-small cell lung cancer. J Evidence-Based Med. 2003;3:132–41. [Google Scholar]
- 15.De Leyn P, Lardinois D, Van Schil PE, et al. ESTS guidelines for preoperative lymph node staging for non-small cell lung cancer. Eur J Cardiothorac Surg. 2007;32:1–8. doi: 10.1016/j.ejcts.2007.01.075. [DOI] [PubMed] [Google Scholar]
- 16.Yang JJ, Wu YL, Xu WP. 18FDG-PET evaluation of the objective respons in advanced non-small cell lung cancer. Clin Cancer Res. 2007;19:461–3. [Google Scholar]
- 17.Sunaga N, Oriuchi N, Kaira K, et al. Usefulness of FDG-PET for early prediction of the response to gefitinib in non-small cell lung cancer. Lung Cancer. 2008;59:203–10. doi: 10.1016/j.lungcan.2007.08.012. [DOI] [PubMed] [Google Scholar]
- 18.de Jong WK, van der Heijden HF, Pruim J, Dalesio O, Oyen WJ, Groen HJ. Prognostic value of different metabolic measurements with fluorine-18 fluomdeoxyglucose positron emission tomography in resectable non-small cell lung cancer: a two-center study. J Thorac Oncol. 2007;2:1007–12. doi: 10.1097/JTO.0b013e31815608f5. [DOI] [PubMed] [Google Scholar]
- 19.Giraud P, Elles S, Helfre S, et al. Conformal radiotherapy for lung cancer: different delineation of the gross tumor volume (GTV) by radiologists and radiation oncologists. Radiother Oncol. 2002;62:27–36. doi: 10.1016/s0167-8140(01)00444-3. [DOI] [PubMed] [Google Scholar]
- 20.Steenbakkers RJ, Duppen JC, Fitton I, et al. Reduction of observer variation using matched CT-PET for lung cancer delineation: a three-dimensional analysis. Int J Radiat Oncol Biol Phys. 2006;64:435–48. doi: 10.1016/j.ijrobp.2005.06.034. [DOI] [PubMed] [Google Scholar]
- 21.Woodburn JR. The epidermal growth factor receptor and its inhibition in cancer therapy. Pharmacol Ther. 1999;82:241–50. doi: 10.1016/s0163-7258(98)00045-x. [DOI] [PubMed] [Google Scholar]


